Stocks are on the march again with the re-open trade leading the way here in 2021. The year ended with small-caps, retail, banks and energy leading the last two months of the year and this theme picked up again this week. A new year and a new month translates into money ready to go to work and this money found its way into the momentum leaders of the last three months.
With a surge the last three days, we saw breakouts in the Semiconductor ETF, Metals & Mining SPDR, DB Base Metals ETF, Industrials SPDR, Materials SPDR and Alternative Harvest ETF. We are also seeing market-leading strength in mid-caps and small-caps. Strength in these areas was countered by weakness in the biotech and tech-related ETFs. This weakness, however, is just one to two weeks and comes after these ETFs recorded new highs. Let’s not read to much into a short pullback after a new high.
Note that I will cover the ETF Rankings, Trends and Setups table tomorrow in a separate piece. The table is updated as of Wednesday’s close. I also updated the article explaining the table and made an adjustment to the oversold requirement. Instead of identifying oversold conditions for just one day, the table shows oversold if this condition was true anytime over the last five trading days. This means RSI can be above 50 and the ETF can still show as oversold, which means RSI was in the 30-50 zone and StochClose shows an uptrend.
New High and Momentum/Trend Leader
PBW, TAN, REMX, PHO
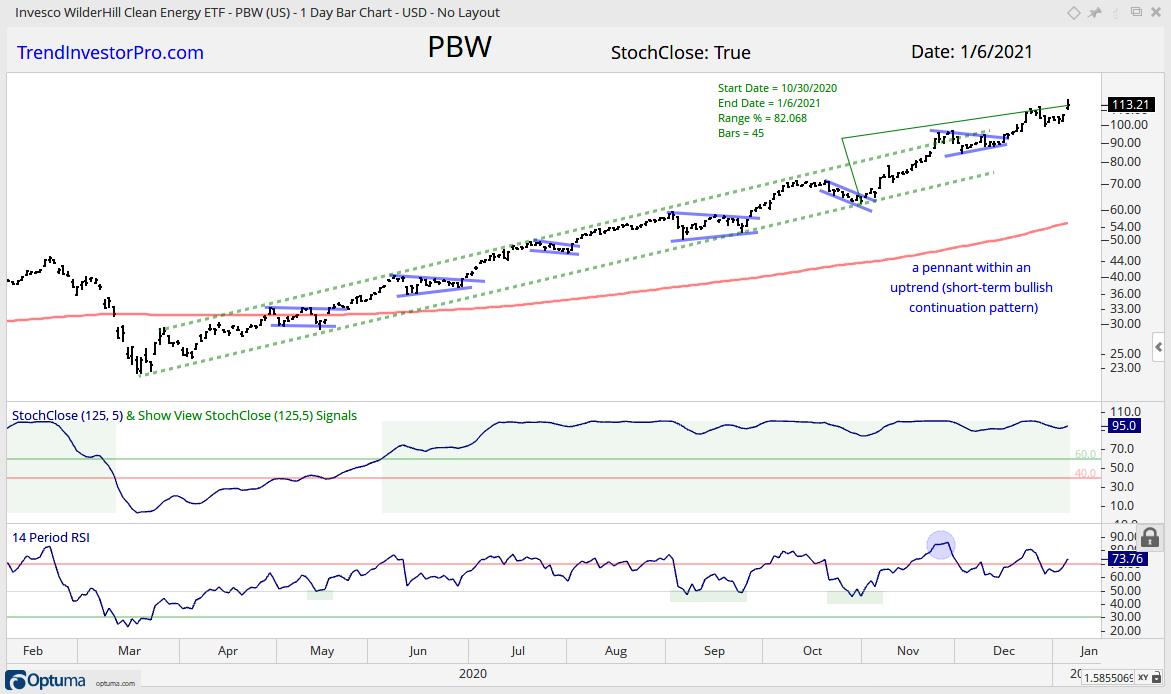
ETFs in the first group hit new highs this week and are momentum-trend leaders. These four sport strong uptrends since late March and new highs in each of the last four months. They did not rest as the tech-related ETFs consolidated in Sept-Oct and they sport market leading gains since early November. The only concern is the extended nature of these ETFs and the possibility of a corrective period. The chart below shows the Clean Energy ETF (PBW) with an 80+ percent gain the last 45 days. Wow.
52-week High early November, Market Leading Gains Since
MDY, IJR, IWM, XRT
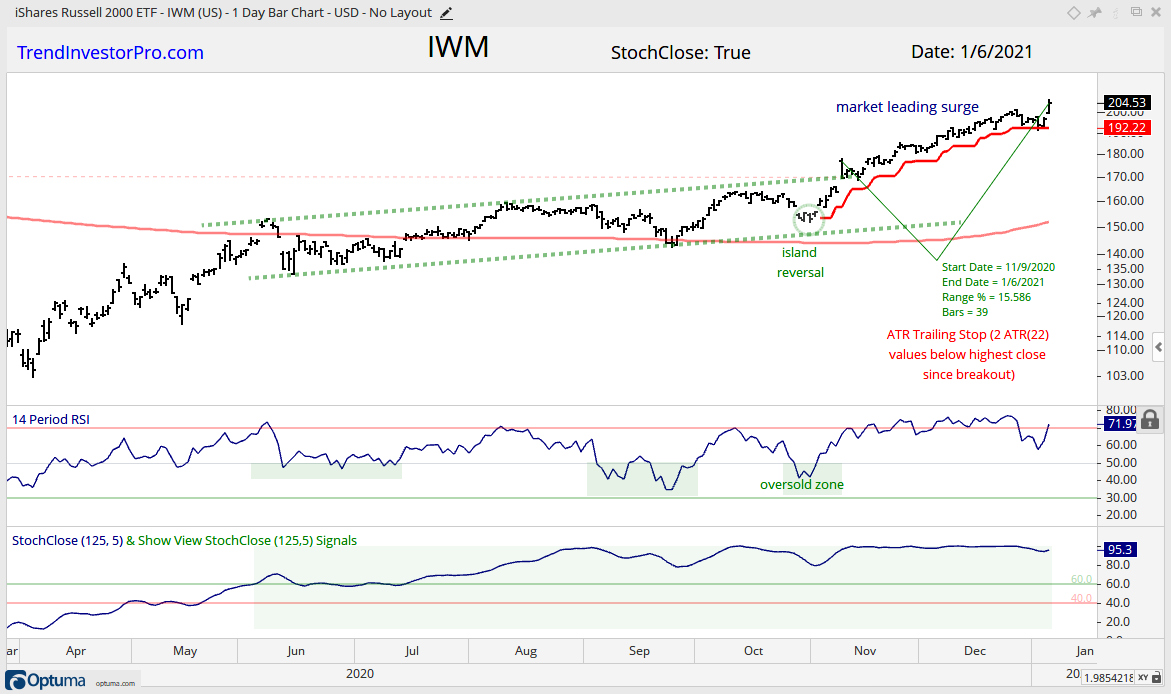
ETFs in group two are also leading with new highs in November and market leading gains since the gap up on November 9th (Vaccine Day V-Day). Mid-caps (MDY), small-caps (IJR, IWM) and retail (XRT) are all benefitting from the reopening trade. The chart below shows IWM gaining 15.6% from the gap open on November 9th until the close on Wednesday (39 days). After hitting a new high on December 28th, the ETF edged lower for five days and surged to another new high this week. The ETF looks quite extended still, but shows no signs of weakness. IWM is simply in the trend-monitoring stage and continues to hold the ATR Trailing Stop.
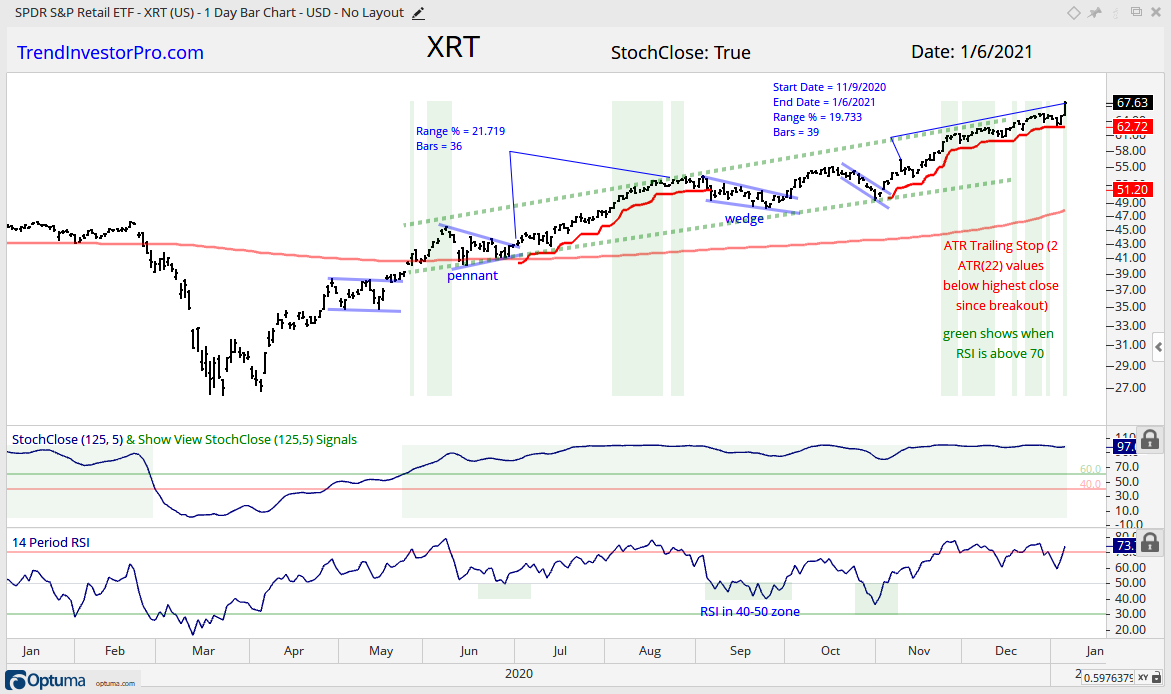
The next chart shows XRT with a flag breakout in early November and then a 20% gain since the November 9th open. RSI has been flirting with the 70 area since November 23rd (some 30 trading days). This is a classic example of becoming overbought and remaining overbought in a strong uptrend. Notice that the ATR Trailing Stop continues to hold.
You can learn more about ATR Trailing stops in this post, which includes a video and charting option for everyone.
Early November Breakout, Strong Extension
IPAY, KRE, TIP, DBA
We have the old (Regional Bank ETF) and the new (Mobile Payments ETF) in this next group. Regional Banks represent the old way for making transactions and mobile payments are the new way. There is also the Inflation-Protected Bond ETF (TIP) and DB Agriculture ETF (DBA), with the former benefitting from strength in the latter (rising agriculture prices).
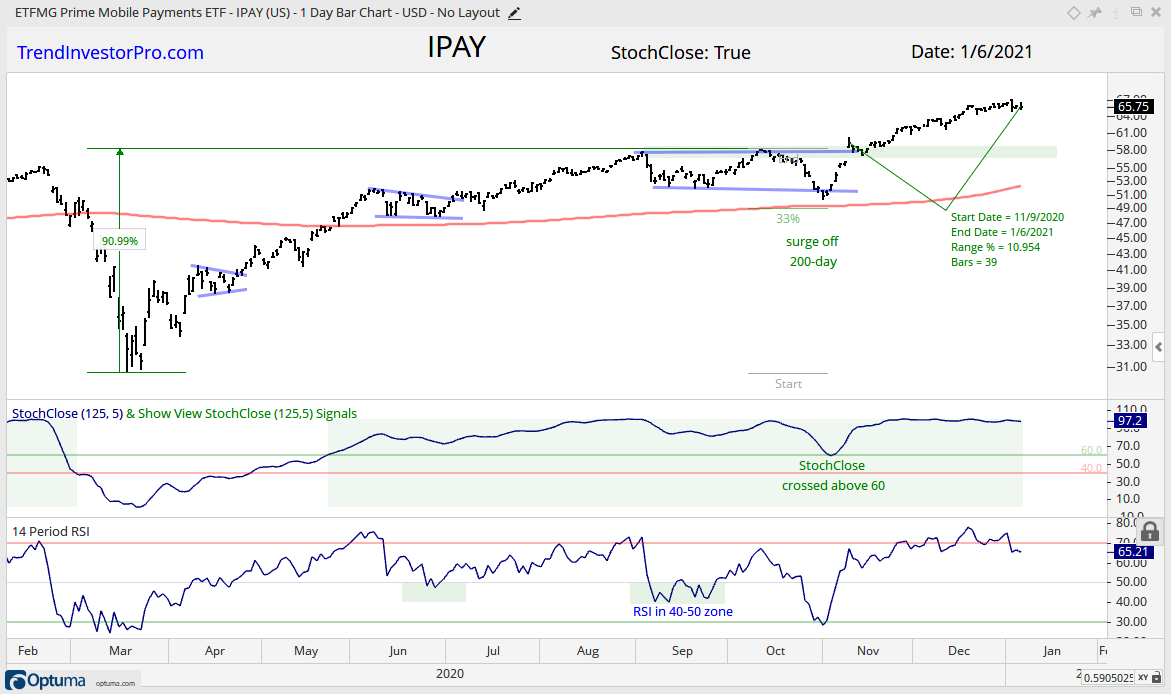
The first chart shows IPAY breaking out on November 9th and extending higher the last eight weeks (+11%). There is no setup on the chart right now, just a strong uptrend. There will be a correction at some point, but picking that exact point is a lesson in futility when the bigger trend is up. For now, the breakout zone around 58 marks the first support area to watch should we see a pullback.
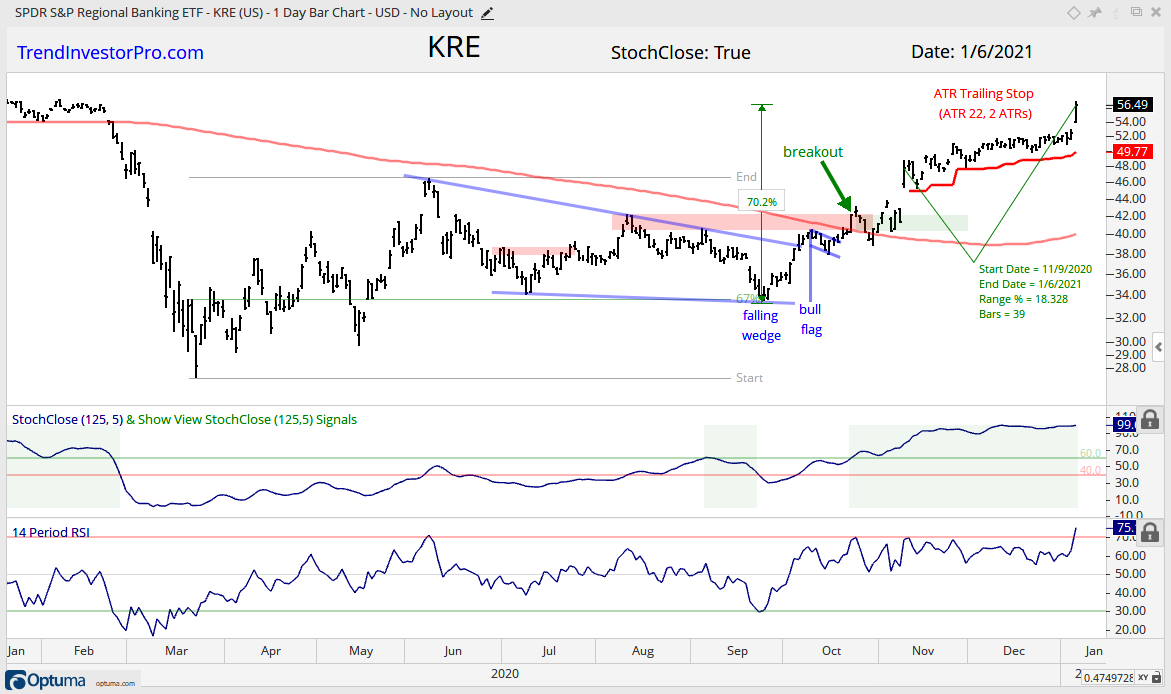
The next chart shows KRE with a breakout in late October and early November. The ETF worked its way higher after the November 9th surge and is up some 18% since then. Even though the trend is up and Wednesday’s 7.81% gain seems very bullish, I am not a fan of outsized gains after an extended advance. Keep in mind that KRE is up 70% since late September. Outsized gains off a low often lead to more gains (rocket lifting off), but outsized gains after an extended advance show frothiness.
2 Week Consolidation, Breakout, New High
SOXX, IHI, XME, DBB
ETFs in this group recorded new highs, consolidated for a couple weeks and broke out to new highs again. I covered the Semiconductor ETF (SOXX) and Metals & Mining SPDR (XME) on Monday. Today will focus on the Medical Devices ETF (IHI) and DB Base Metals ETF (DBB).
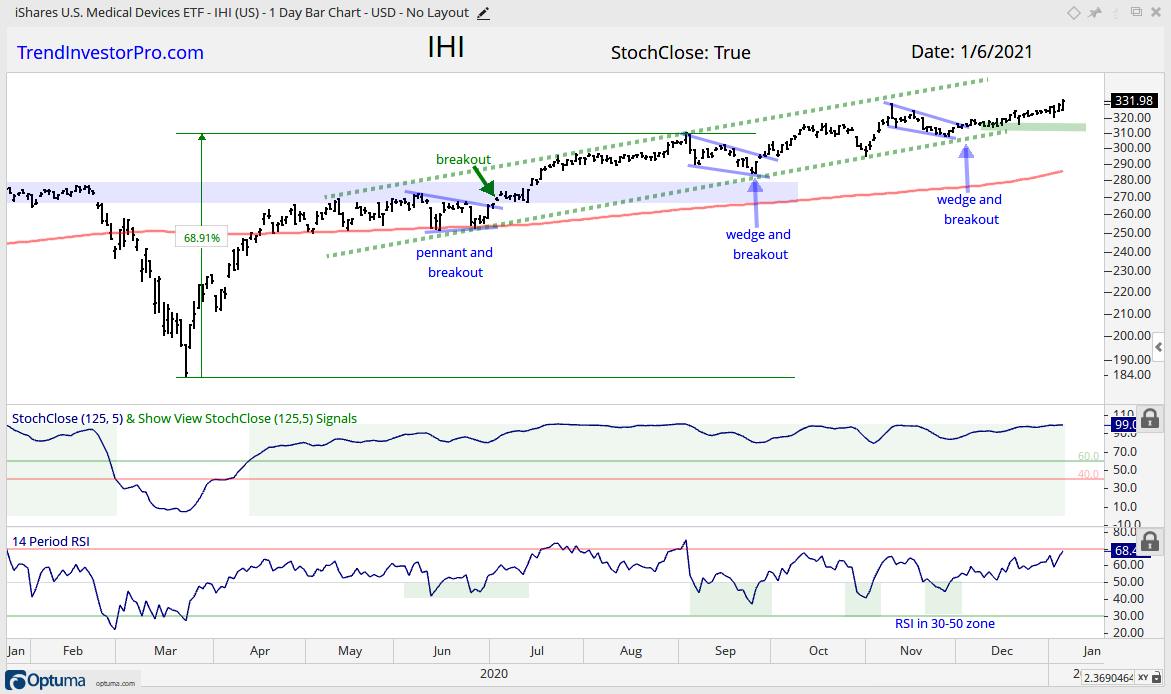
The first chart shows IHI with a new high in early November and a falling wedge into early December. The ETF broke out in early December and tentatively advanced the last four weeks with fresh new highs this week. The December lows mark support at 310.
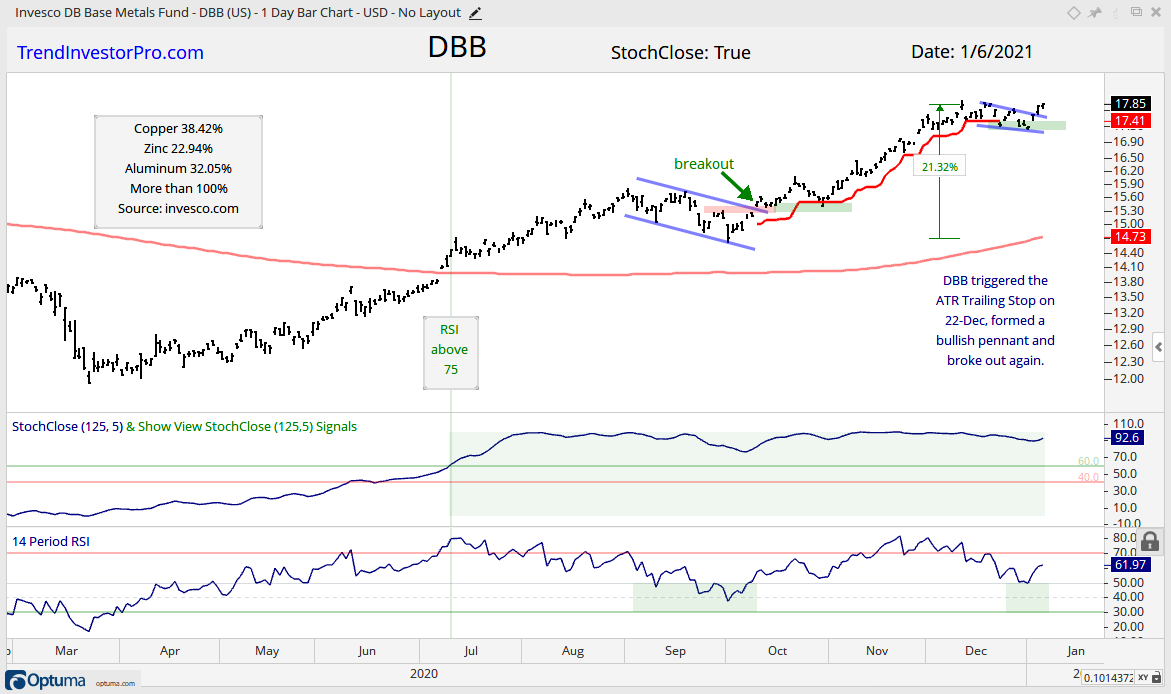
The DB Base Metals ETF (DBB) is a case-in-point on booking some profits and taking the next signal. DBB broke out in mid October and advanced into mid December, holding the ATR Trailing Stop the entire time (closing basis). The pullback into early January triggered the stop and formed the next bullish continuation pattern (pennant). RSI also dipped below 50 (49.37) on December 31st. Thus, the mean-reversion setup and pattern were there. DBB broke out over the last few weeks and the pennants low marks first support.
Early November Breakout, Grind Higher, New High
SPY, XLY
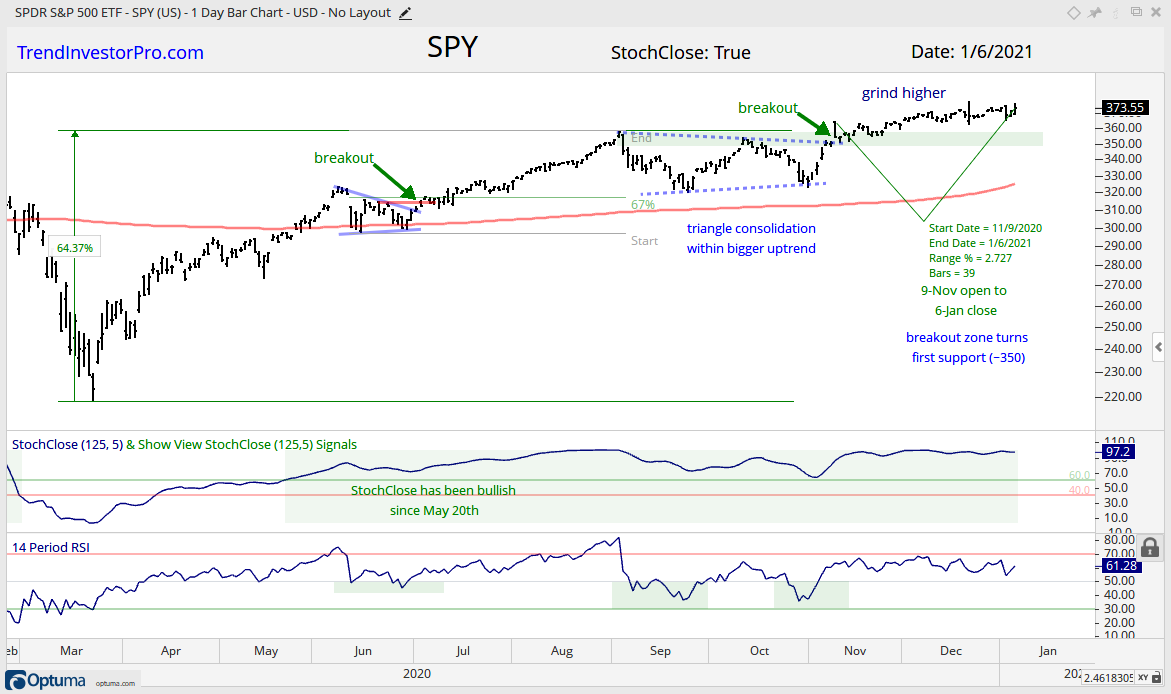
The next two ETFs sport breakouts in early November (9-Nov) and rather lethargic advance for follow through. Nevertheless, they did grind higher the last eight weeks and recorded new highs. The chart below shows SPY gaining just 2.72% since the November 9th open, which is far less than the 15.6% gain in IWM. Despite a weaker advance, an advance is an advance and the breakout is holding (bullish). The prior resistance zone around 350 turns first support to watch should we see a pullback.
4-6 Week Consolidation, Breakout, New High
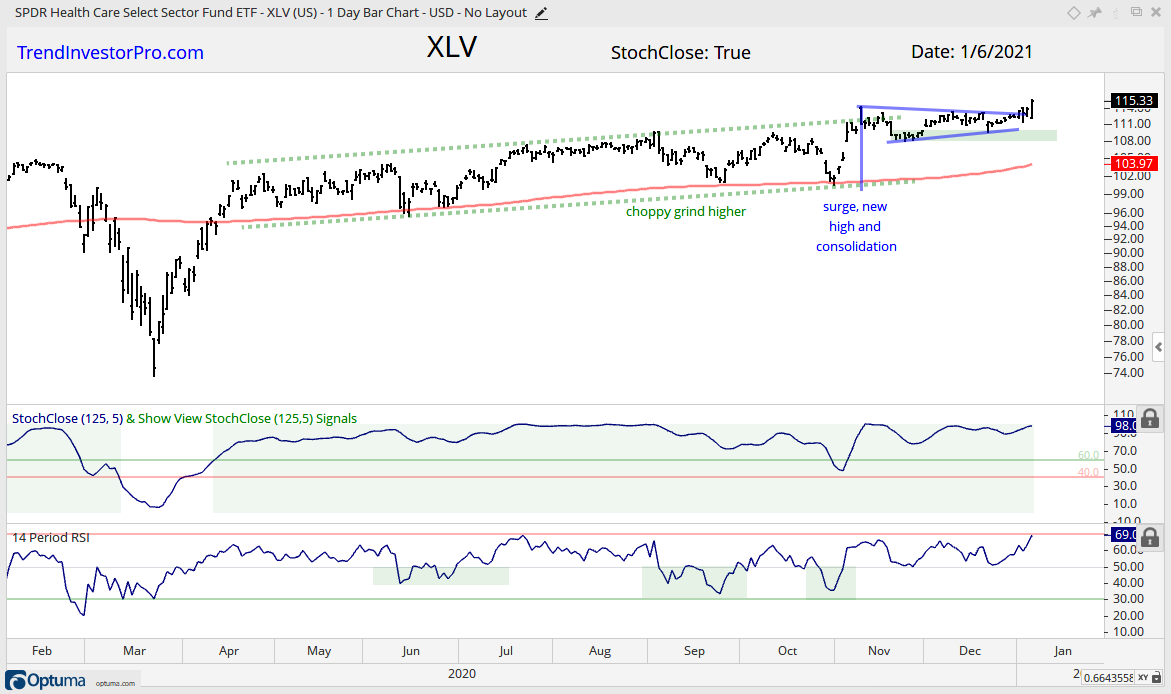
RSP, XLI, XLF, XLV, XLB, IHF
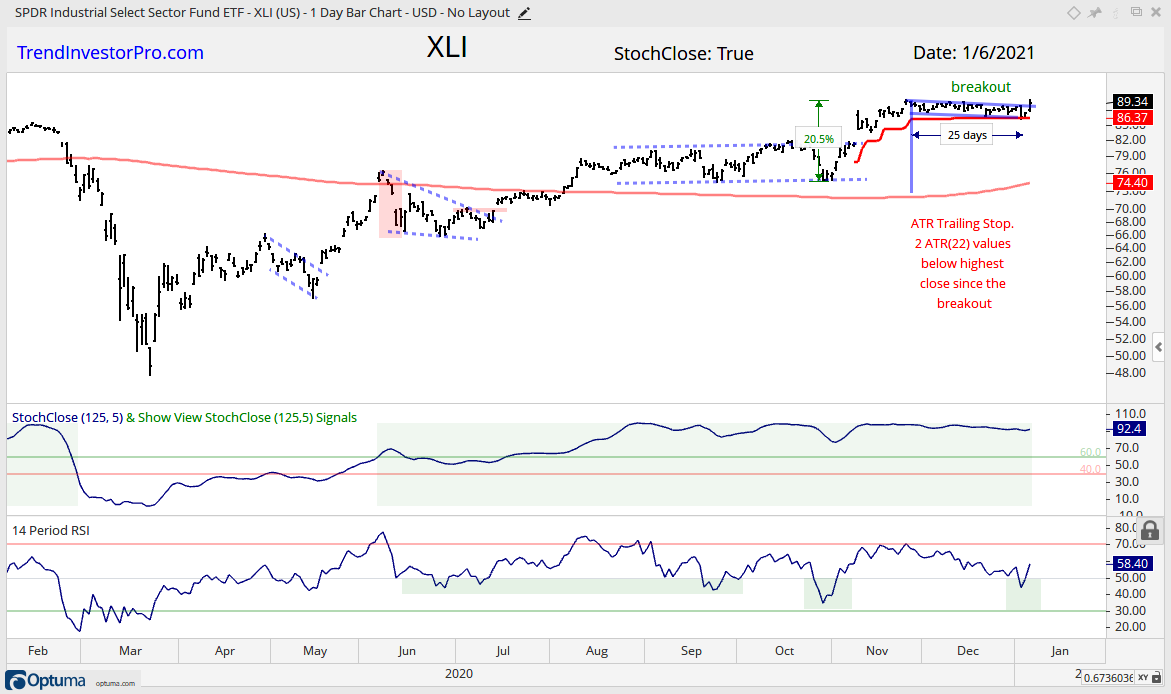
The next group of ETFs stalled over the last four to six weeks with flat trading and broke out. These stalls were viewed as consolidations within an uptrend and bullish continuation patterns. They broke out this week and these breakouts signal a continuation higher. This group includes the S&P 500 EW ETF (average stock in S&P 500), the Industrials SPDR (core component of economy) and Materials SPDR (a cyclical sector dominated by chemical stocks). RSP, XLF, XLV and XLB were covered on Monday.
The first chart shows the Industrials SPDR (XLI) with a 20% surge in November and a five week consolidation into early December. XLU hit new highs in November and this consolidation is viewed as a bullish continuation pattern. It lasted longer than expected, but appears to have ended with a breakout on Wednesday. The breakout signals a continuation of the bigger uptrend. Notice that RSI dipped in the 40-50 zone just before the breakout. The red line marks the ATR Trailing Stop and it aligns with the consolidation lows.
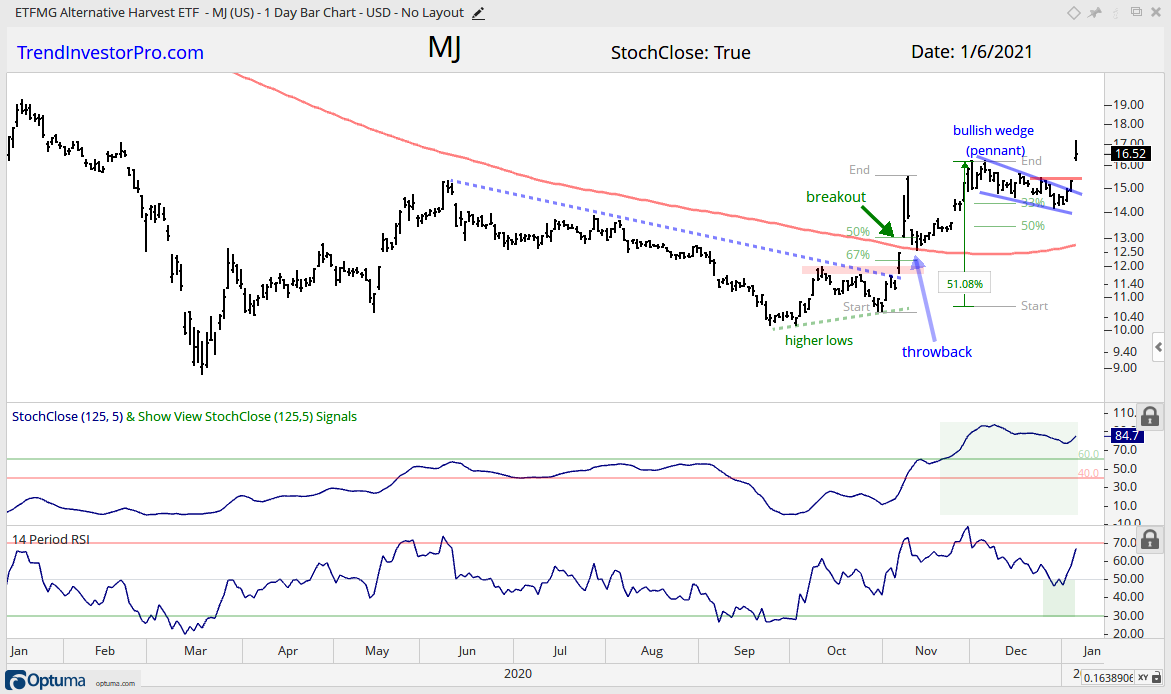
Surge Oct-Nov, December Pullback, Breakout
MJ
The Alternative Harvest ETF (MJ) surged some 50% in November, retraced 1/3 to 1/2 of this surge with a falling wedge as RSI dipped into the 40-50 zone. This is text-book stuff for a correction within a bigger uptrend. MJ caught a bid on Monday and broke out with a surge this week. The trend is clearly up and the ETF is close to a 52-week high. The Pure Cannabis ETF (YOLO) is stronger and already recorded 52-week highs.
New High, Short-term Pullback
IBB, XBI
Now we get to ETFs that hit new highs in late December and pulled back. The first group features the two biotech ETFs (IBB and XBI), and the second group covers the tech-related ETFs. My focus remains on XBI because it is the strongest of the two biotech ETFs. The chart below shows XBI with a 49% advance to new highs and a pullback the last eight days. XBI did not trigger the wider ATR Trailing Stop and bounced on Wednesday. RSI dipped to 50 and change, but did not cross into the oversold zone. There is no real setup here because we do not have an oversold reading and we have yet to see a bullish continuation pattern form. It is probably time to exercise some patience and wait for the next setup to emerge (or just follow the trend).
Pullback/Consolidation after Breakout and New High
QQQ, XLK, XLC, IGV, FDN, HACK, SKYY, FINX
The tech-related ETFs remain highly correlated with similar chart characteristics. They all hit new highs in early September, consolidated into October and broke out in November. After hitting new highs in late December, they all pulled back over the last one to two weeks. Even with these pullbacks, QQQ, XLK, XLC, IGV and FDN are up more than 10% since early November, while HACK, SKYY and FINX are up more than 20%. Despite short-term weakness, these ETFs are still in long-term uptrends and have medium-term breakouts from November in play. Short-term weakness is deemed a correction within a bigger uptrend. Broken resistance turns first support for QQQ, XLK, XLC, IGV and FDN. The chart below shows QQQ with first support set in the 295-300 area. Also note that an RSI dip into the 30-50 zone would create a short-term oversold condition and pave the way for a mean-reversion setup.
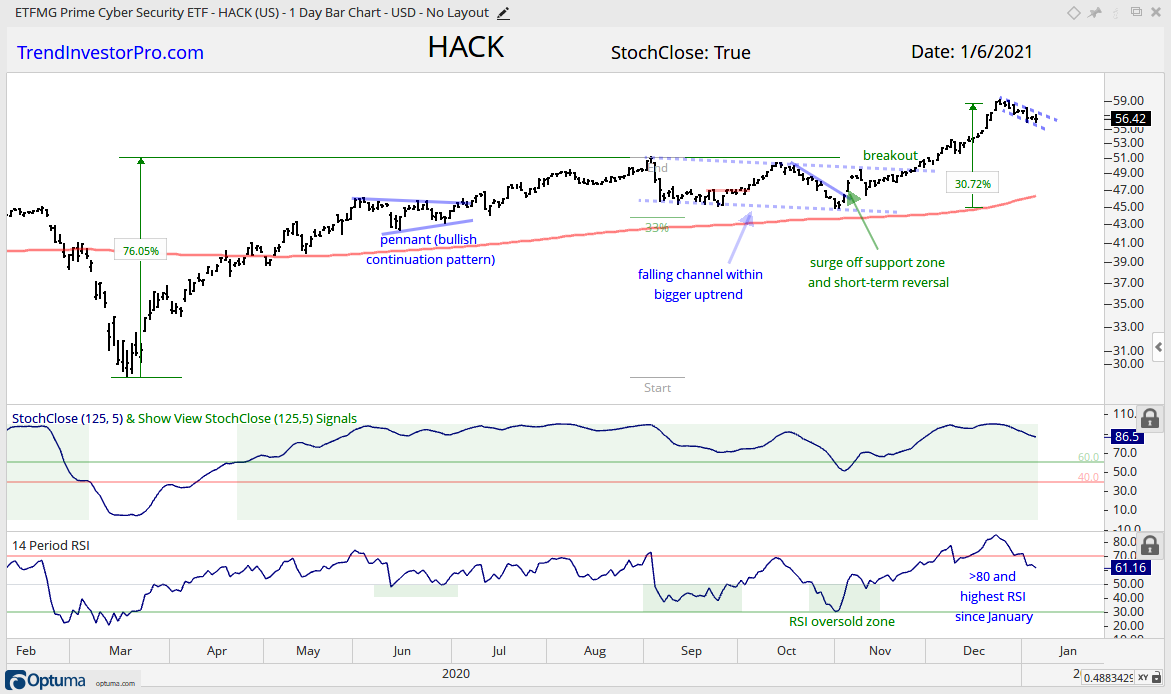
HACK, SKYY and FINX are up much more than the five above, and thus showing relative strength. Broken resistance seems too far for a support level so I will cue off the chart pattern and RSI. The chart below shows HACK with a short pullback that looks like a falling flag. A breakout would reverse the fall and signal a continuation higher. This is a very short-term pattern and prone to whipsaw. RSI is still at 61 and not close to becoming short-term oversold. Again, some patience may just be a virtue here.
Mean-Reversion Bounce, Short-term Breakout
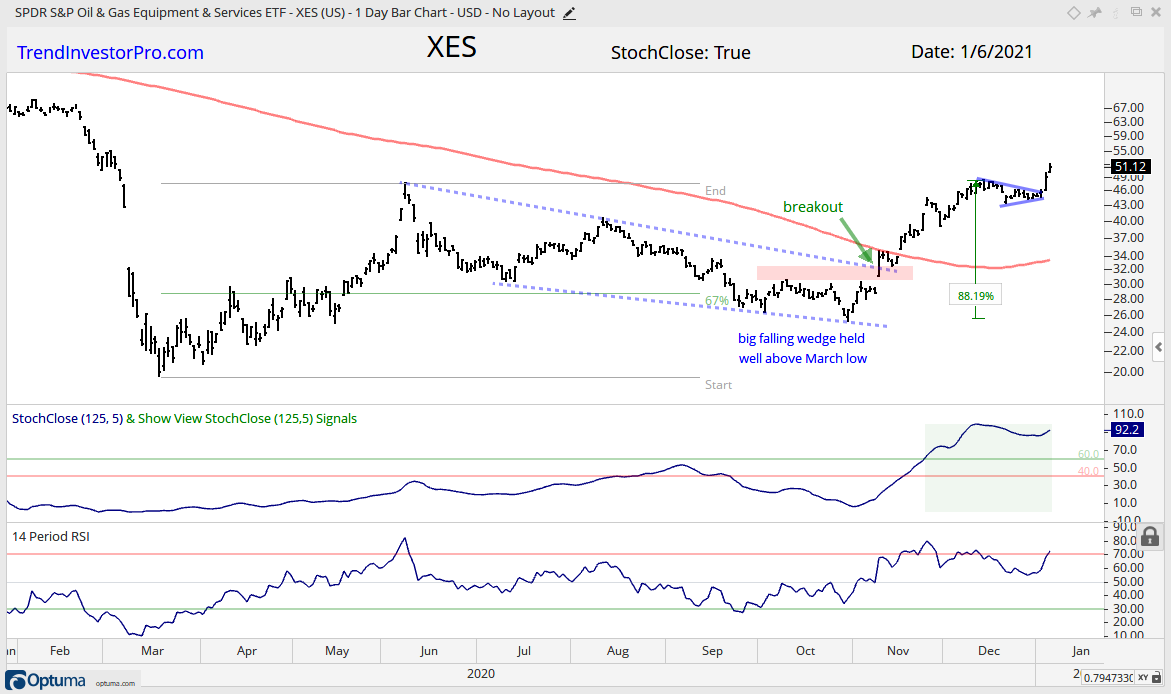
XLE, XES, XOP, AMLP, FCG
Oil popped the last two days and this gave way to a bounce in the energy-related ETFs. The Oil & Gas Equipment & Services ETF (XES) is the strongest of the group because it is the only one above its June high. The chart shows XES surging some 88%, consolidating for a few weeks and breaking out with a 14% surge the last three days. Strong stuff, but not my cup of tea, even though it is Texas tea.
New High Aug, Correction, December Breakout
GLD, SLV, DBP
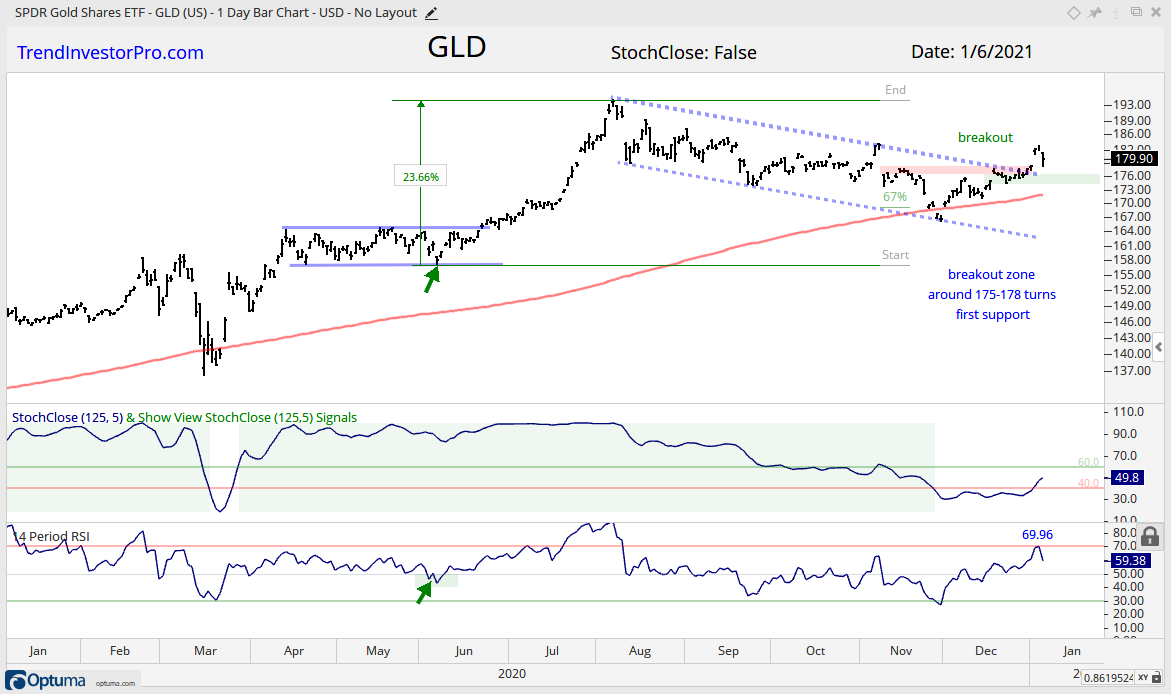
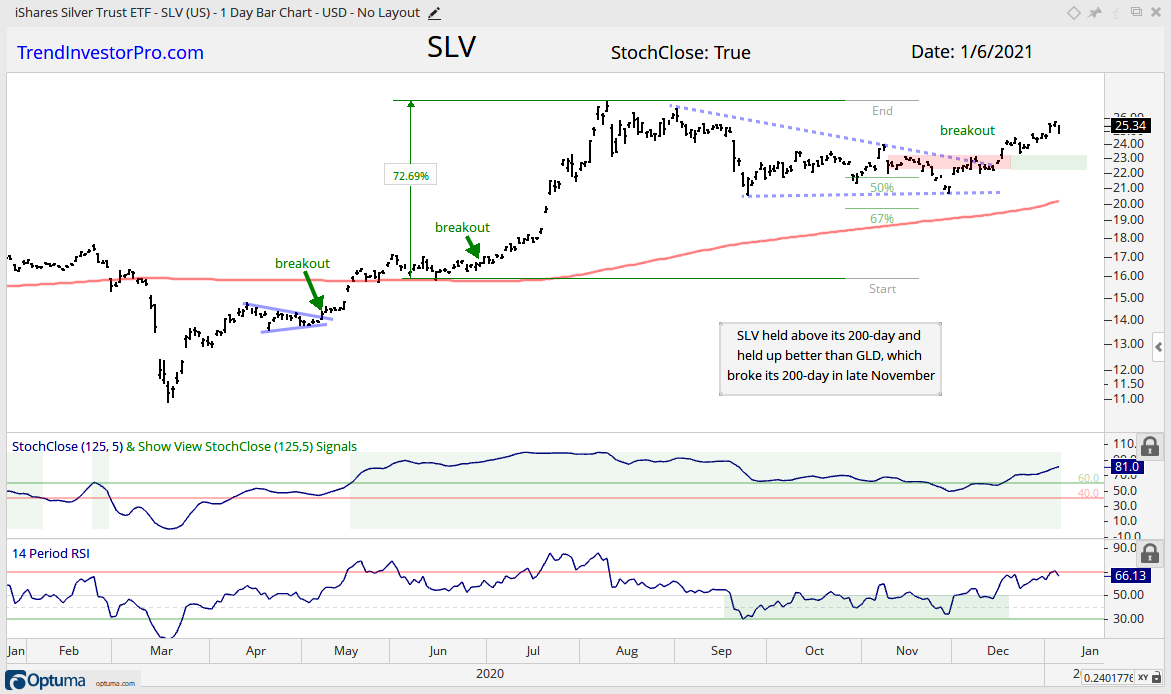
The Gold SPDR (GLD) and Silver ETF (SLV) were covered on Monday with weekly charts. SLV broke out first (early December) and GLD followed with a breakout in late December. Both fell back on Wednesday, but this is just one day of noise and the breakouts are still valid. The chart shows GLD retracing 2/3 of its prior advance with a falling channel back to the 200-day SMA. GLD bounced with a market leading move in December and broke out of the channel. This signals an end to the correction and a resumption of the bigger uptrend. The breakout zone around 175 turns first support to watch.
Note that I am calling an audible here and overriding the bearish StochClose signal. This is because the price chart sports a bullish configuration (normal correction within uptrend). Even though StochClose is still on a bearish signal, it turned up sharply and GLD shows the second largest 5-day change (+16.5). GDX was first at +16.9 and SIL was third with +16.3 points. Also note that RSI hit 70 (69.96) and this shows strong momentum. RSI should peter out in the low to mid 60s when the trend is down.
New High in October, Bullish Consolidation Since
ITB
The Home Construction ETF (ITB) continues to tease as it bounces to and fro within a consolidation, which began after the new high in October. Again, this consolidation is viewed as a bullish continuation pattern because the big trend is up. The pattern is putting everyone to sleep by overstaying its welcome so perhaps it is ready to make a move. Again, watch for a surge off support here as the first sign. Well, such a surge would be the fourth attempt to resume the uptrend.
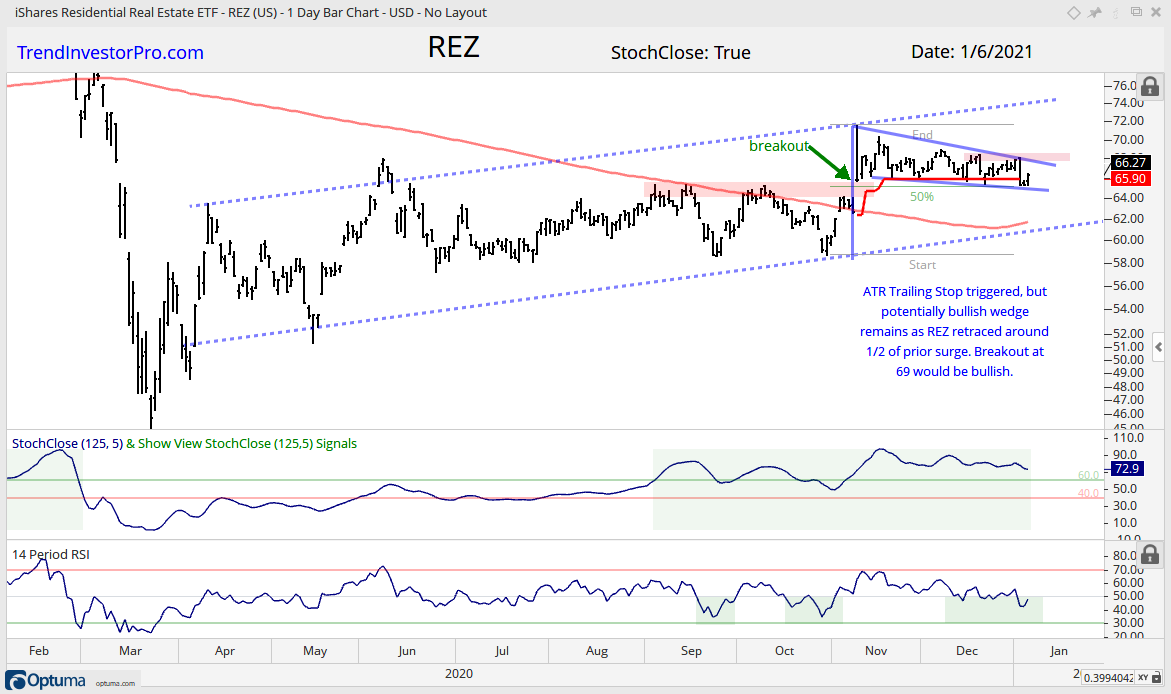
Reversal Working Near Key Retracement
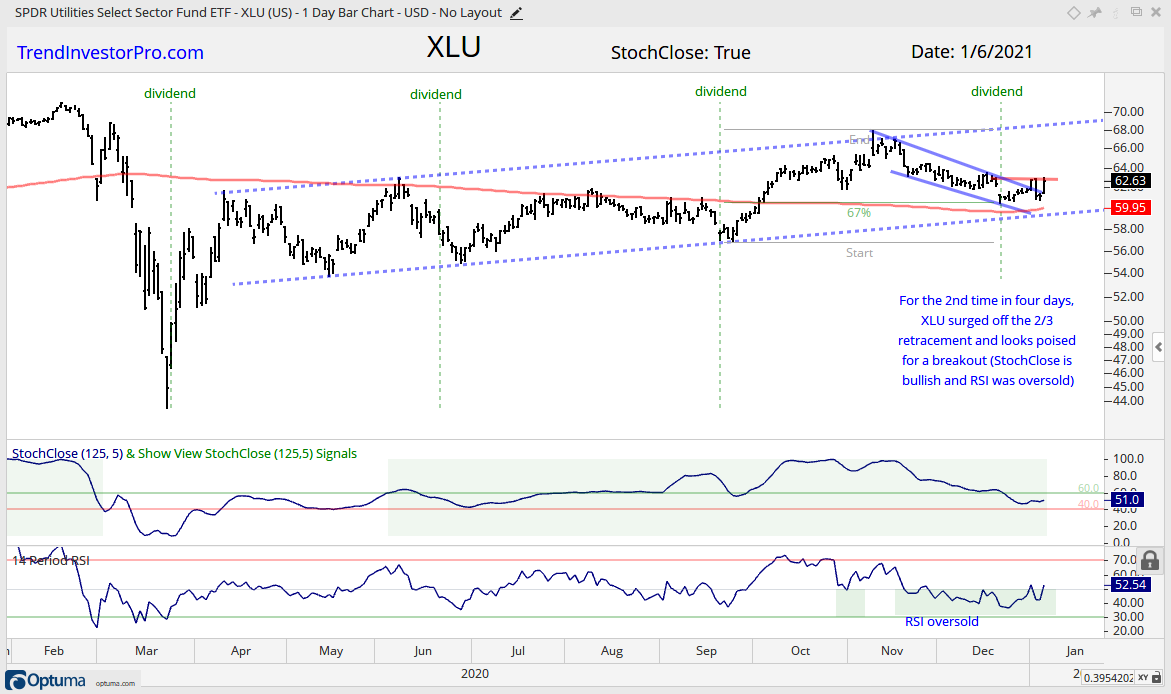
XLU, REZ
The Utilities SPDR (XLU) and the Residential REIT ETF (REZ) are not exactly leaders, but they do sport uptrends since April and they are above their 200-day SMAs, which turned up over the last two weeks. These two bond proxies surged in early November and then worked their way lower with falling wedges into early January. These wedges retraced 1/2 to 2/3 of the prior advance. The retracement amount and pattern are typical for corrections within bigger uptrends, as is the RSI dip into the oversold zone. Thus, bullish setups are still possible here.
Other ETFs and Groups:
New High Mid November, Consolidation Since: XLP
4-6 Week Consolidation, Breakout, No New High: KIE, XAR
")