Stocks are in the middle of a strong advance with small-caps leading the charge. The middle, in this instance, refers to a point after the beginning because I do not know where the end will be. IWM appears quite extended after a 39% advance the last eleven weeks, but the price charts for SPY and QQQ do not look that extended. The latter two broke out in early November and continue to work their way higher. Even though small-caps, micro-caps and mid-caps are getting most of the attention right now, SPY and QQQ are holding their own just fine. The chart below shows these two with gains of 14.62% and 16.43%, respectively.
Despite some signs of excess, the weight of the evidence remains firmly bullish for stocks. The trends are up with the big three hitting new highs here in January (SPY, QQQ, IWM). The breadth models are firmly bullish with all five indexes net bullish on the Trend Breadth Models and all eleven sectors net bullish on the Sector Breadth Model. Yield spreads continue to narrow at the junk end of the market and this shows more confidence in less credit-worthy borrowers.
There will be a correction at some point, but timing such a correction is easier said than done. For now, we are in the middle of a move and it will continue until it doesn’t. I am watching two breadth indicators and these are covered further below.
Note that we have seen corrections in some of the big names over the last few months. Amazon (AMZN), Microsoft (MSFT), Nvidia (NVDA), Home Depot (HD), McDonalds (MCD), Mastercard (MA), Adobe (ADBE) and Netflix (NFLX) are all flat over the last few months and did not hit new highs in November, December or January. SPY and QQQ will get their mojo back when these big names end their corrections and resume their bigger uptrends.
SPY Extends on Triangle Breakout
SPY stalled so far this week and may even close lower on the week. I am not going to read into the candlesticks because that would detract from the bigger picture, which is the focus of this weekly report. SPY broke out of a consolidation and this signaled a resumption of the bigger uptrend. The post-breakout extension is pretty modest because small-caps are getting all the attention. Classical technical analysis suggests that broken resistance turns support and this points to the 350 area. Thus, a pullback to this area could provide an opportunity. For now, SPY is post-breakout and the path of least resistance is up. The Nasdaq 100 ETF (QQQ) chart shows similar characteristics.
Another Big Week for Small-Caps
It’s another week and I am adding a few more percentage points to the surge in IWM. The ETF is up around 3% the last four days and up some 39% the last 11 weeks. This is the biggest 11 week gain since early June. IWM gave that week’s gain back with a big outside reversal, but immediately firmed and marched higher the next few months. IWM is clearly overextended and has been overextended for a few weeks now. Even though this increases the odds for a correction, it does not help with timing a correction.
Breadth Models Remain Firmly Bullish
All five trend models remain bullish and 24 of 25 signals are bullish. It all started with the Nasdaq 100 turning net bullish in May. The S&P 500 and S&P 100 followed in July, mid-caps joined in August and small-caps finally tipped bullish in September. Since turning bullish in September, the S&P SmallCap 600 SPDR (IJR) has led the five major index ETFs in this table, and by an obscene amount. IJR +37%, MDY +27%, SPY +8.35%, QQQ +6.6% and OEF +5.4%.
Four of the five thrust models remain bullish. Only the S&P 100 is net bearish because it did not fully recover from the October dip. Small-caps, on the other hand, fully recovered and led the market after the October dip.
The chart below shows the Trend and Thrust Breadth Models for the S&P 500 and the signals over the last five years. There is no change in either as all five trend indicators are bullish and all three thrust indicators are bullish.
You can learn more about the methodology and historical performance for these breadth models in this article.
Two Indicators to Watch for a Correction
The next chart shows the SPX Thrust Breadth Model turning bullish on April 29th and the three indicators in each window. I am watching the percentage S&P 500 stocks above the 50-day SMA for signs that a correction may unfold. Currently, 74.85% are above their 50-day SMAs and a move below 60% would signal some deterioration that could give way to a correction. No signs yet.
The next chart shows the SPX Trend Model turning bullish on July 20th. Currently, 89.29% of stocks are above their 200-day SMAs, 85.91% are above their 150-day SMAs and 82.94% are above their 100-day SMAs. This shows broad strength within the index. %Above 100-day SMA continues to hold above 75% and I am watching this level for signs that a correction may be unfolding. No signs yet.
Finance Leads New High List
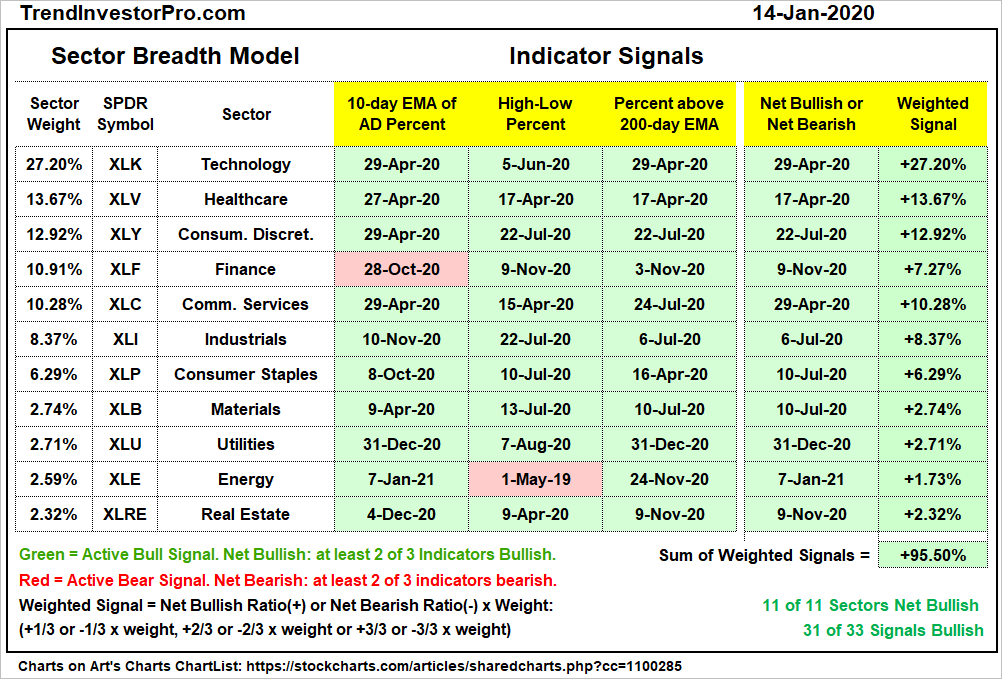
There is no change in the Sector Breadth Model, which remains unequivocally bullish. All eleven sectors are net bullish and 31 of 33 signals are bullish. Tech, Healthcare and Communication Services have been bullish since April. Consumer Discretionary, Industrials, Consumer Staples and Materials have been bullish since July. Finance is leading the new high list this week as Finance High-Low% ($XLFHLP) hit 29.23%.
Even though the Utilities SPDR (XLU), Real Estate SPDR (XLRE) and Consumer Staples SPDR (XLP) are net bullish, they are the weakest sectors since November. This makes sense because they are the traditionally defensive sectors. The chart below shows sector performance since November 1st and XLU is the only sector showing a loss. XLRE is barely positive. XLE and XLF are leading the re-opening charge, but XLK is in third place with a most respectable 17.65% gain. XLE and XLF were underperforming in October and made up for deep discounts with the surge of the last ten weeks. Even though XLF and XLE are getting all the attention, XLK still has the better looking long-term chart (much more stable uptrend).
Yield Spreads and Fed Balance Sheet
AAA yield spreads are at .55, which means AAA corporate bonds yield .55 more than Treasuries. The BBB spread fell to a new low for the move and the spread is now 1.26, which means BBB corporate bonds yield 1.26% more than US Treasuries. These are very narrow spreads and net positive for stocks.
The Junk and CCC spreads continued to narrow and recorded new lows for the cycle this month. Oil is up some 40% since November and this is creating confidence in energy-related junk bonds. The narrowing of junk bond spreads points to less risk of default and this is beneficial to banks.
The Fed balance sheet contracted over the last three weeks. The current week’s contraction was miniscule and barely shows up on the histogram. Overall, the balance sheet has expanded since mid July and remains near record highs.
On a funny-mental note, the Fed expanded the balance sheet to compensate for inaction on fiscal stimulus this summer and fall. We could see more fiscal stimulus in the coming months and this may take some of the onus off the Fed. Of course, don’t forget that stimulus needs to be financed and this means the Treasury will be issuing more debt. The Fed will likely continue to monetize this debt and be a big buyer.
Jurrien Timmer (@TimmerFidelity) notes: We have to go back to the 1940s to find a cycle in which large deficits were absorbed or monetized by the #Fed through balance sheet expansion, ultra-low nominal rates, and sharply negative real rates. Japan has been doing this for years. Will the US do it now?
Timmer also notes: If inflation rises and the #Fed stays put, we could see real rates go further into negative territory in the months or years ahead. That’s what happened from 1941-46 and it was bullish for #stocks, until inflation arrived.
I realize that the situation in 2021 (covid) is completely different than the 1940s (war), but the macro picture points to more borrowing from uncle Sam, debt monetization, negative real rates and inflation down the road. This could result in more TINA: There Is No Alternative to stocks.
")