With some pretty sizable declines the last five days, a number of ETFs are now in the red for the year. 99 of the 118 ETFs in the Core list are down over the last five days and 38 are down year-to-date. This shows some pretty broad selling pressure. The biggest losers year-to-date include: Gold Miners ETF (GDX), Mobile Payments ETF (IPAY), Aerospace & Defense ETF (ITA), Airlines (JETS), Industrials SPDR (XLI) and Metals & Mining SPDR (XME). In addition, five of the eleven sector SPDRs are down 1% or more year-to-date. XLI is the worst performing sector.
A Warning Shot from Outsized Declines
There were a lot of outsized declines over the last few days and I consider these to be bearish when they occur after an extended advance. Well, maybe not exactly bearish, but a sign that a corrective phase could be starting. An outsized decline is an above average decline that shakes up the bulls. Consider it as a boxer being hit with a good left hook. The punch may not be enough for a knockout, but it often takes time for the boxer to stabilize and find his (or her) feet.
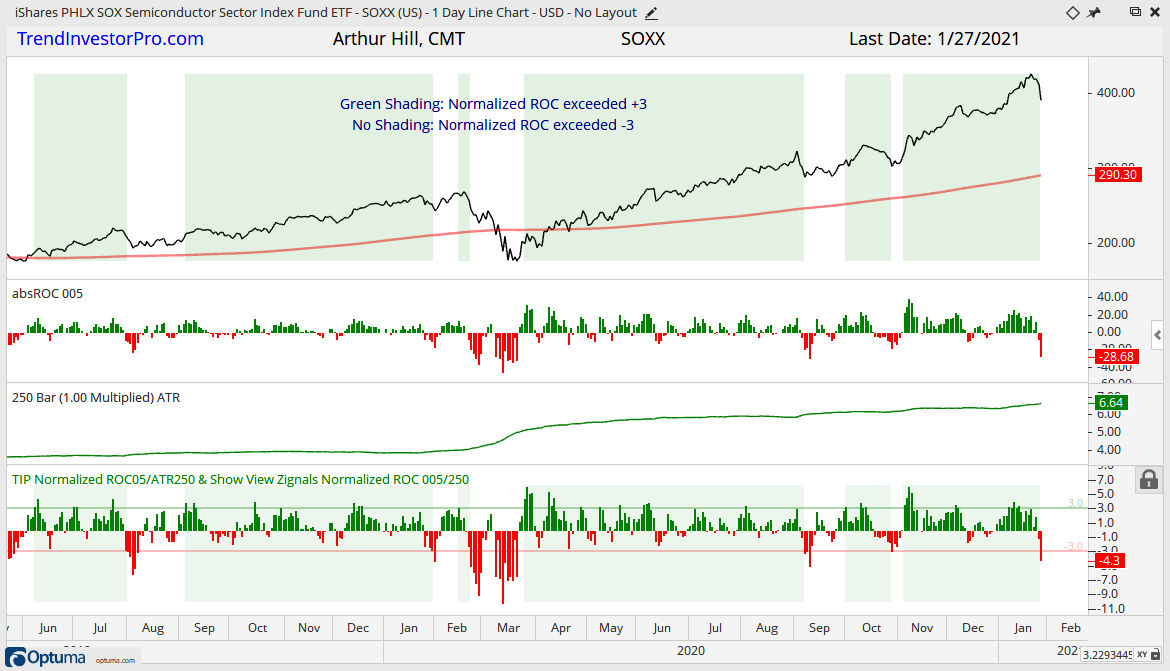
The chart below shows the Semiconductor ETF (SOXX) with four indicators to quantify an outsized decline. The red line is the 250-day SMA (290.30). The first window shows 5-day Absolute change (-28.68) and third window shows the 250-day Average True Range (6.64). The lowest window shows Normalized ROC, which is the 5-day absolute change divided by 250-day ATR (-4.32). This means SOXX fell 4.32 ATR(250) values over the last five days. This is the biggest such decline since September 10th.
(revised) A big move in the Absolute ROC(5)/ATR(250) indicator, which I call Normalized ROC, can signal the start of an extended trend or correction. I placed the significant levels at +3/-3, but these levels may vary depending on the ETF and its volatility. The following signals occurred over the past year. Outsized advances February 14th, March 25th, October 1st and November 4th (green shading). Outsized declines on February 24th, September 8th, October 28th and January 26th (no shading).
The table below shows ETFs where AbsROC5/ATR(250) exceeded 3. This means the 5-day change was more than three 250-day ATR values (outsized declines). SOXX is highlighted in yellow. Also note that we saw outsized declines in the Materials SPDR (XLB), Metals & Mining SPDR (XME) and Finance SPDR (XLF). On the flipside, there were outsized advances in the Retail SPDR (XRT) and Video Game Tech ETF (GAMR), 15.20 and 24.21, respectively. These two can thank Gamestop (GME) for their big moves.
The column with ATR(250)/SMA(250) shows a measure of annual volatility in ATR terms. It is the 250-day ATR divided by the 250-day SMA, and multiplied by 100. ETFs with the highest values are generally the most volatile (GBTC = 7.56, XES = 7.05, MJ = 5.03, KRE = 3.41, MUB = .29, AGG = .31). And finally, the links on the right are to a SharpChart with 5-day ROC and ATR(250), which is the closest I could get.
Consequences of a Correction
The stock market was hit with a hard left hook as SPY and QQQ gapped down on the open and closed weak on Wednesday. Percentage-wise, the 1-day decline was the largest since late October. For SPY, this could be a breakaway gap or island reversal. Notice that SPY gapped up on 20-Jan, stalled for four days and gapped down. The bull market remains intact and the big trends for SPY, QQQ and IWM are up. With a gap down, however, it looks like a corrective phase may be beginning. This could involve a sideways trading range, a pullback or a combination of the two (choppy slow decline). Also of note, the June consolidation, which lasted just four weeks, started with an island reversal.
The trading environment will become difficult should stocks move into correction mode over the coming weeks or even months. This means short-term oversold conditions, such as RSI in the 40 area, will lead to weak bounces, if at all. RSI can flirt with the 40 area during short (3-4 week) and long (2-3 month) corrections. For example, the chart below shows the Home Construction ETF (ITB) with RSI becoming oversold in late October and continuing to dip into the oversold zone until early January. ITB consolidated for three months as it digested the prior 170% advance.
Strong Uptrend, New High, Overbought
XRT, PBW, TAN, REMX, IBB, XBI
We will lead off with the Retail SPDR (XRT) because this “equally weighted” ETF surged some 20% the last three days and over 80% the last 12 weeks. The weighting of Gamestop (GME) went from around 1% to 9.52%. Amazon, which has a market cap of $1.62 trillion weighs less than 1% of XRT. GME has a market cap of $24 billion and XRT will likely be rebalanced. XRT went from overbought (font size 8) to overbought (font size 14) to OVERBOUGHT (all caps font size 64). RSI is above 90 and at its highest level ever and the ATR Trailing Stop is still 14% below the current close. Calling tops is foolhardy, but volatility is through the roof and a wild correction is likely at some point.
The next chart shows the Biotech SPDR (XBI) with a new high Monday-Tuesday and sharp decline on Wednesday. This decline is not enough to affect even the short-term uptrend or the ATR Trailing Stop. The ETF, however, is still quite extended after a 50+ percent advance since early September. A 50% retracement at this stage would extend to the 130 area.
Flag/Pennant Breakout in January, New High Recently
XLC, SKYY, HACK, MJ, TIP
ETFs in this group are showing strength because they have flag/pennant breakouts working in January and recently recorded new highs. XLC, HACK SKYY, and TIP hit new highs this week, while MJ hit a new high last week. The first chart shows the Cyber Security ETF (HACK) breaking out on January 7th and gaining 8.7% this month and 40% since late October. There is a strong secular theme behind this advance, but HACK is also getting a bit extended. The Cloud Computing ETF (SKYY) also has a strong secular theme behind it, but its price chart is not quite as strong. SKYY is also ripe for a rest.
Consolidation Breakout
ITB, SLV
The Silver ETF (SLV) held up surprisingly well on Wednesday and finished with a small loss. Overall, the triangle breakout is bullish and it is holding. The breakout zone in the 23 area turns first support and held as SLV fell back to this area. This area, however, is a make or break zone because a close below 22 would negate the breakout.
Market Leader with Tight Rising Channel
MDY, IJR, IWM
Small-caps led the broader market higher since late October and the Russell 2000 ETF (IWM) continues to hold its tight rising channel, which defines the short-term uptrend. A break here would argue for a correction within the bigger uptrend.
You can learn more about ATR Trailing stops in this post, which includes a video and charting option for everyone.
Slower Ascent with Tight Rising Channel
RSP, SPY, QQQ, XLK, XLY, HYG
The Nasdaq 100 ETF (QQQ) also formed a rising channel, but the rate of ascent is slower than that of IWM. QQQ is also holding the channel for now and the short-term trend is still up, despite the gap and sharp decline on Wednesday. A channel break would argue for a correction and we could then see a move towards the breakout zone (295-300).
Flag Breakout early January, Test of Breakout Zone
IGV, FDN, XAR
The next group of ETFs are in uptrends overall and broke out of flag patterns. Short-term, they fell back and these flag breakouts are under pressure. With the broad market correction possible, these flag breakouts could fail as they join a bigger correction. The chart below shows the Software ETF (IGV) breaking out on January 7-8, but failing to take out the flag high and falling back the last two days. Further weakness would make for a failed breakout and argue for a longer corrective period.
Uptrend, Correction within Uptrend
XLV, IHI, XME, PHO, DBB
ETFs in this next group are in long-term uptrends, but correcting within these uptrends. All five hit new highs in late December or early January and then fell back. XLV and IHI fell back with big gaps on Wednesday. The others worked their way lower the last two to three weeks. Even though RSI is in the oversold zone for all five already, these ETFs may need some time to stabilize and form clearer setups before the correction actually ends. The first chart shows the Healthcare SPDR (XLV) with a gap and its biggest 1-day decline since late October. The big trend is clearly up with a slow grind higher since April. Perhaps a move into the 110 will led to the next setup.
The next chart shows the Metals & Mining SPDR (XME) hitting a new high on January 5th and then falling back to the mid December lows. This decline retraced 33-50% and RSI dipped into the oversold zone. Actually, XME is at support and trading in a potential reversal zone.
Failed Breakout, 2021 Laggard, Correcting
XLF, XLB, IPAY, FINX, KIE, REM
The next group of ETFs corrected pretty hard the last few days and are all down year-to-date. The speed and depth of the recent decline is a bit disconcerting and suggest that these ETFs need more time to stabilize. The chart below shows XLF with a setup similar to XME above. XLF hit a new high and then fell back towards the prior consolidation the last three weeks. RSI is oversold as the ETF hits the 33-50% retracement zone and support from the December consolidation. This is an area that could give way to a bounce.
Performance Leader October to December, Correcting
KRE, DBE, XLE, XES, XOP, AMLP, FCG
ETFs in this next group led the market from November to early January and then corrected the last two weeks with a pullback. They are still positive year-to-date and RSI is in or near the oversold zone. Normally, this means a mean-reversion setup is brewing. All but one of the ETFs in this group are energy-related and this makes them dependent on oil or the DB Energy ETF (DBE). A breakout in DBE would lead to breakouts in the others. The first chart shows DBE with a tight flag forming and the second shows the Oil & Gas Equipment & Services ETF (XES) with a falling pennant/wedge.
Lagging since mid November
XLI, XLP
The Industrials SPDR (XLI) slipped way down the list this week as the flag breakout failed to hold and the ETF moved below the December low. The overall trend is still up for XLI, but this one is lagging the broader market since late November. The breakout zone in the 81 area marks the first zone to watch for support.
Failed Breakout, Lagging since mid November
XLU, REZ
The Utilities SPDR (XLU) failed to hold its breakout after a sharp decline, while the Residential REIT ETF (REZ) fell back after a very tentative breakout. Both are lagging since mid November because they are below their mid November highs. They are still in slow grinding uptrends since April and above their 200-day SMAs. However, it is hard to have confidence in a laggard.
I will cover the 20+ Yr Treasury Bond ETF (TLT), Gold SPDR (GLD) and Dollar Bullish ETF (UUP) tomorrow. Note the gold and silver were covered on Monday.
Other ETFs and Groups:
Range Bound since August: LQD
Downtrend Since August: TLT, AGG, GLD, GDX
Lagging since June, Trading Range since June: XLRE
Long-term Downtrend, but Inverse Correlation to SPY: UUP
")