Weekend Video – Spinning Tops, Wedge Breakouts, ATR Trailing Stops, Bullish Breadth Thrust, New Highs in Cyclical ETFs and Oil Breakout

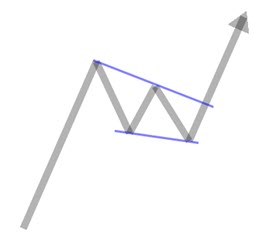
Today’s video starts with a review and outlook for the broader market. SPY formed a weekly spinning top to show indecision, but the falling wedge breakouts and follow through still dominate the charts. Small-caps are making a bid to outperform as a key ratio broke above its 200-day for the first time in two years. The rally continues to broaden with two more bullish breadth thrusts. Many ETFs are in the trend monitoring phase and I will cover the ATR Trailing Stop in detail. Elsewhere, four cyclical ETFs hit new highs, oil broke out, GLD and TLT are battling their wedges and the Dollar is firming.

ETF ChartNotes
Saturday, 17 October 2020

Many of the charts with flag/wedge breakouts in late September show the ATR Trailing Stop. This stop is based on the highest close since the breakout and the 22-day ATR value on the day of the highest close. It “rachets” up as long as the closing highs rise. It flatlines when prices fail to make a new closing high. A close below this trailing stop can be used for exits if trading the flag/wedge breakouts. The chart below shows SPY with an example. The highest close since the breakout is 352.43 on 12-Oct and ATR(22) was 5.73 on 12-Oct. The trailing stop is 340.97 (352.43 – (5.73 x 2)).

Note that longer term players can ignore these stops and focus on the bigger trends: 200-day SMAs, support from the September lows and bullish StochClose. It is also possible to accumulate based on falling wedge breakouts, triangle breakouts and RSI dips into the oversold zone (~40), and then sell when the bigger trend reverses.

IWM has a rising channel working since June with higher highs and higher lows. IWM and MDY exceeded their early September highs and led the broad market ETFs the last four weeks. SPY and QQQ are not exactly weak, but they have yet to exceed their early September highs. The chart below shows the IWM:SPY ratio breaking its 200-day SMA for the first since September 2018.

The late September breakouts remain the patterns in play at the moment for dozens of ETFs. Most followed through after these breakouts and they are in the trend monitoring phase. These include QQQ, XLK, XLY, XLV, XLP, IGV, SOXX, FDN, SKYY, HACK, IPAY, FINX, BOTZ, XRT

The Home Construction ETF (ITB), EW Consumer Discretionary ETF (RCD), Retail SPDR (XRT) and Semiconductor ETF (SOXX) recorded new highs this week. These are cyclical groups and new highs bode well.

The Regional Bank ETF (KRE) and Bank SPDR (KBE) formed small bull flags the last five days. The Solar Energy ETF (TAN) formed a high and tight pennant/wedge. These are very short-term patterns. Breakouts in KRE and KBE could lead to bigger triangle breakouts. A breakout in TAN would be bullish, but this is one of the more volatile ETFs.

The Medical Devices ETF (IHI) and Biotech SPDR (XBI) recorded new highs this week. The Biotech ETF (IBB) fell short and is not as strong as XBI.

The Utilities SPDR (XLU) broke out of a long triangle consolidation and this breakout is holding as XLU consolidated last week. A small bull flag could be forming and XLU appears to be breaking out with a bounce on Friday.

The Gold SPDR (GLD) broke out of a falling wedge pattern on 9-Oct (Friday), but fell back this week as the Dollar firmed. The breakout is still largely holding, but a close watch is warranted.

The 20+ Yr Treasury Bond ETF (TLT) remains within its falling wedge after a pullback the last two days. This established a resistance level to watch and a breakout at 164 would be bullish.

The long-term trend for oil, XLE and XES is clearly down, but the US Oil Fund (USO) has a short-term breakout working and StochClose turned bullish for the first time since January. I realized that USO and UNG cannot be used for long-term analysis, but short-term I am seeing a falling wedge correction and a breakout that is holding.

Thanks for tuning in and have a great weekend!

Timing Models – Small-caps Poised to Outperform, GLD Divorces TLT, Breadth Models Improve, Yield Spreads Continue to Narrow

Today we will start with small-caps, industrials and banks, because these three could be turning the corner. The IWM:SPY ratio moved above its 40-week SMA for the first time in 2 years, XLI is above the 200-day and KRE rose from the ashes the last four weeks. GLD may be parting ways with TLT and hooking up with SPY again. The breadth models remain bullish and there were two new signals in the short-term breadth models. The sector breadth model also remains firmly bullish with the newest signals coming

Timing Models – Small-caps Poised to Outperform, GLD Divorces TLT, Breadth Models Improve, Yield Spreads Continue to Narrow Read More »

ETF Trends, Patterns and Setups – Key ETFs Fail to Confirm New Highs, Trailing Stops with ATR, Banks Still Lagging

Some discrepancies are starting to build in the stock market. We witnessed a bullish breadth thrust last week because mid-caps and small-caps led from 24-Sept to 12-October. The Russell 2000 ETF exceeded its September high and produced a market leading gain during this time period.

ETF Trends, Patterns and Setups – Key ETFs Fail to Confirm New Highs, Trailing Stops with ATR, Banks Still Lagging Read More »

Weekend Video – Breadth Thrusts Show Broadening Participation, Falling Flag/Wedge Breakouts Extend, Banks and Finance are Still Lagging

Today’s video starts with a broad market overview by looking at the long-term trends in SPY and QQQ, as well as the recent resurgence in small-caps and mid-caps. We then turn to the bullish breadth models and point out the breadth thrusts seen this past week, as well as the expansion in new highs. Within the ETF chart book, the setups in SPY and QQQ started from a position of strength, but the market leading gains in IWM and MDY started from a position of weakness (ditto for KRE and KBE).

Weekend Video – Breadth Thrusts Show Broadening Participation, Falling Flag/Wedge Breakouts Extend, Banks and Finance are Still Lagging Read More »

Timing Models – Small-caps and Finance Sector Perk Up as Breadth Indicators Show Broadening Participation

Stocks surged the last two weeks with a new group of leaders. Mid-caps, small-caps, banks and utilities led the charge. Large-caps and tech stocks lagged, but they still gained and remain bullish overall. The period from late May and early June was the last time we saw small-caps and banks take the lead. After a 15% advance in SPY and 25% surge in IWM, stocks rested from June 8th to July 9th with consolidations.

Timing Models – Small-caps and Finance Sector Perk Up as Breadth Indicators Show Broadening Participation Read More »

ETF Trends, Patterns and Setups – A Two Week Shift, Healthcare ETFs Remain Strong, SOXX and Retail Follow Thru

There appears to be a shift in market dynamics over the last two weeks. Small-caps outperformed large-caps, the Regional Banks outperformed Software, High-Yield Bonds outperformed Treasury Bonds and Utilities divorced themselves from Treasury bonds with a big surge.

ETF Trends, Patterns and Setups – A Two Week Shift, Healthcare ETFs Remain Strong, SOXX and Retail Follow Thru Read More »

Q&A – Trend-Following notes, Broad Market Trend Filters and getting the Jump with the Short-term Breadth Model

Today’s post starts with trend-following and insights from a recent podcast featuring Nick Radge. I then analyze the benefits and drawbacks of using a market trend filter for a broad-based ETF strategy. And finally, I review the short-term breadth model, which was developed in response to the March-April surge.

Q&A – Trend-Following notes, Broad Market Trend Filters and getting the Jump with the Short-term Breadth Model Read More »

Weekend Video – Monitoring the Breakouts in SPY, QQQ and Tech-related ETFs, Retail and Housing Perk Up, as Bonds Break Down

Today’s video starts with a revisit to the ROC shock and the rationale behind the call for an extended corrective period, which would be quite normal. We will consider how long this correction might last, the path it might take and what would suggest that this is more than just a correction. The index and sector breadth models remain bullish overall, despite a few individual bearish signals. Utes and REITs

Weekend Video – Monitoring the Breakouts in SPY, QQQ and Tech-related ETFs, Retail and Housing Perk Up, as Bonds Break Down Read More »

Timing Models – ROC Shock Lingers, but Short-term Breakouts Hold

The long-term trend is up for the S&P 500 and Nasdaq 100, but questionable for the S&P SmallCap 600 and S&P MidCap 400. Small-caps and mid-caps are largely off my radar right now. Despite long-term uptrends and bullish evidence for large-caps, I remain in the correction camp for three reasons. First, SPY and QQQ became extremely extended in early September, as measured by

Timing Models – ROC Shock Lingers, but Short-term Breakouts Hold Read More »

ETF Trends, Patterns and Setup – Breakouts from September Corrections, Laggards still Lagging and Bonds Sag

After correcting most of September, many stock-related ETFs caught a bid the last few days and we are seeing short-term breakouts in several areas. The Solar Energy ETF (TAN) is far an away the leader and the only ETF in the core list to hit a new high. Nevertheless, a handful are knocking on the new high door with pennant breakouts in the making (ITB).

ETF Trends, Patterns and Setup – Breakouts from September Corrections, Laggards still Lagging and Bonds Sag Read More »

Weekend Video – Falling Wedges Take Shape, Select Tech and Housing Hold Up, Energy and Finance Remain in Doghouse

Today’s video starts with the broad market charts as SPY formed a weekly spinning top and QQQ formed a piercing pattern. Even though the ROC Shock reversal earlier this month remains the dominant chart feature, falling wedges are taking shape and breakouts from these corrective patterns would be short-term bullish. The Nasdaq 100 is holding up the best and its short-term breadth indicators are oversold. In addition, we are also seeing relative strength in several tech-related ETFs

Weekend Video – Falling Wedges Take Shape, Select Tech and Housing Hold Up, Energy and Finance Remain in Doghouse Read More »

Timing Models – The Only Game in Town, Double-Edged Swords and Some Bearish Breadth Signals

SPY and QQQ fell in September and are in short-term downtrends, which are considered corrections within a bigger uptrend. The S&P SmallCap 600 SPDR and S&P MidCap 400 SPDR also fell in September, but these declines do not look like mere corrections within a bigger uptrend. MDY, IJR and IWM fell well short of their January-February highs and broke their downward sloping 200-day SMAs. These three look like they are reversing the uptrends that began with the March blast off.

Timing Models – The Only Game in Town, Double-Edged Swords and Some Bearish Breadth Signals Read More »

ETF Trends, Patterns and Setups – Dollar and Bonds Shine, Gold Dulls, Tech ETFs Hold, SPY Continues Lower, Failed Flags

It has been a rough month for everything except the Dollar and Treasury bonds. The chart below shows month-to-date performance for nine ETFs. The Dollar Bullish ETF (UUP) and 20+ Yr Treasury Bond ETF (TLT) are the only gainers this month and both have been positive for the entire month. This is a big difference from August.

ETF Trends, Patterns and Setups – Dollar and Bonds Shine, Gold Dulls, Tech ETFs Hold, SPY Continues Lower, Failed Flags Read More »

Breadth Model Update: %Above 200-day SMA Sags for SPX and OEX and AD% Reflects Broad Downside Participation

This is a midweek update to address Monday’s price action and its effect on the breadth indicators and models. At this stage, there was only one new signal: %Above 200-day for $MID broke below 45%. Nine of the ten breadth models remain bullish, but we saw more deterioration in the breadth indicators on Monday. Selling pressure was the strongest un small-caps and mid-caps over the last five weeks (since August 15th).

Breadth Model Update: %Above 200-day SMA Sags for SPX and OEX and AD% Reflects Broad Downside Participation Read More »

ETF Update: Flag Breaks, Breakaway Gaps, A Few Hold Up, Failed Breakouts and Tepid Bounce in Bonds

This is a midweek update to address Monday’s price action in some of the ETFs in the core chart list. We saw a continuation lower in SPY and QQQ, but some of the tech-related ETFs held up relatively well. ETFs that held up relatively well during broad selling pressure are often the ones that lead on any bounce, even if it is just an oversold bounce. Elsewhere

ETF Update: Flag Breaks, Breakaway Gaps, A Few Hold Up, Failed Breakouts and Tepid Bounce in Bonds Read More »

The Setup to Anticipate the Breakout – XME Example

Chartists are often faced with a choice: wait for the breakout or anticipate using a mean-reversion setup. The Metals & Mining SPDR (XME) broke out of a bullish consolidation this week and the breakout signals a continuation of its long-term uptrend. Chartists keying off the mean-reversion setup could have anticipated the breakout and gotten the early jump. Let’s investigate.

The Setup to Anticipate the Breakout – XME Example Read More »

Weekend Video – Spinning Top Follow Thru, Correction or more?, Breadth Indicators Deteriorate, 4 Channel/Flag Breakouts, 2 to Watch

Today’s video starts with the S&P 500 and the reversal seen over the last few weeks. We look at the spinning top, the outside week, downside follow through and the ROC shock. With a reversal in play, I put forth a correction target for the S&P 500 SPDR and this serves as the base case for the broader stock market (a correction within a bigger uptrend).

Weekend Video – Spinning Top Follow Thru, Correction or more?, Breadth Indicators Deteriorate, 4 Channel/Flag Breakouts, 2 to Watch Read More »

Timing Models – ROC Shock Lingers, SPY Follows Thru on Outside Week, Breadth Models Remain Bullish

The medium-term indicators and breadth models are still bullish, but the ROC Shock in early September and some waning breadth indicators argue for at least a correction of the March-September advance. I covered the ROC Shock in detail last week and will review the findings. First, keep in mind that the character of the market (SPY) changed in January 2018 as the swings became bigger and 52-week lows were interspersed with 52-week highs. Big swings and volatility are the order of the day for now.

Timing Models – ROC Shock Lingers, SPY Follows Thru on Outside Week, Breadth Models Remain Bullish Read More »

Scroll to Top