Market and ETF Report – Falling 200-day SMAs in Play, Dollar Becomes Very Oversold, Perspective on Gold and Silver (Premium)

The perfect storm hit the stock market over the past month and gave way to a sizable counter-trend bounce from mid October to mid November. The positive forces included oversold conditions in late September and early October, positive seasonal patterns, divided government and a better-than-expected inflation report. The latter led to a 5.5% surge in SPY. The advances over the last few weeks are impressive, but still bear market rallies when put in context. Today’s report will put these bounces in context using the 200-day SMA as the windsock.

About the ETF Trends, Patterns and Setups Report

This report contains discretionary chart analysis based on my interpretation of the price charts. This is different from the fully systematic approach in the Trend Composite strategy series. In this ETF Trends, Patterns and Setups report, I am looking for leading uptrends and tradable setups within these uptrends. While I use indicators to help define the trend and identify oversold conditions within uptrends, the assessments are mostly based on price action and the price chart (higher highs, higher lows, patterns in play). Sometimes the chart assessment can be at odds with the indicators.

Thanksgiving Week Pause

Note that TrendInvestorPro will not publish reports during Thanksgiving week, which extends from November 21st to 26th. The stock market is closed on Thursday (25-Nov) and hours are reduced on Black Friday (26-Nov). I will update the ETF Trend Signal and Ranking Table on Tuesday, Thursday and Saturday.

TradingView Black Friday

If you ever wanted to try TradingView, Black Friday and Cyber Monday are great opportunities to get a deep discount. I subscribed a few years ago on Black Friday and I renew every year to capture these discounts. TradingView has a robust charting platform with a plethora of indicators, settings and datasets. Yep, it is a rabbit hole. Affiliate links are below.

The Problem with Current Breakouts and Trend Reversals

There were a lot of “breakouts” and bullish trend reversals over the past week or so. Making money on breakouts is tough in a bear market because emerging trends often fail to extend. First, here is the make-up of the ETF Master List (274 ETFs):

  • 168 US stock-based ETFs
  • 22 US Bond or Fixed Income ETFs
  • 17 Commodity ETFs
  • 9 Currency ETFs
  • 58 non-US ETFs (53 stock-based and 5 non-stock)

Of the 274 ETFs in the MasterList, the Trend Composite turned positive for 48 ETFs (17.5%) over the past six days and a total of 80 ETFs (30%) are in uptrends right now. Overall, there are 168 stock-based US ETFs and only 32 of these are in uptrends (19%). This means that 81% are still in downtrends and this shows more underlying weakness than strength. The image below comes from the ETF Trend Signal and Ranking Table. The major index ETFs are split with three in uptrends and four in downtrends. Notably, SPY, QQQ and IWM are still in downtrends.

The sector SPDRs are also split with five in uptrends and six in downtrends. Notably, XLK, XLY and XLC are in downtrends and these three sectors account for around 45% of the S&P 500. There are pockets of strength within US stock-based ETFs (energy, healthcare, metals and aerospace-defense). However, the rest of the uptrends are relatively isolated and this is not yet a bull market environment.

As noted in the Market Regime update on Wednesday, the market is split at best and still bearish at worst. At best, we moved from a bearish environment to a split market, which is not the same as a bull market. The advance off the October lows was strong for pockets of the market, but we have yet to see broad enough strength to call for a bull market right now.

The current breakouts and Trend Composite signals are occurring within a bear market environment. This is problematic because it means the breakouts still face a headwind. At the very least, many ETFs are short-term overbought after big moves the last two to five weeks and ripe for a pullback or consolidation. This is not the time to chase breakouts. Wait for your shot and let the market come to you.

Falling 200-day SMAs In Play

The 200-day is the most widely used long-term moving average and the S&P 500 is the most widely followed benchmark for US stocks. Perhaps the 200-day SMA works well with the S&P 500 because so many people use this combo, which makes it a self-fulfilling prophecy. In general, the 200-day SMA works better for large-cap stocks than small-cap stocks because small-caps are less “trendy” (more erratic). Performance is mixed when looking at sector, industry group, commodity, bond and currency ETFs.

As with many long-term trend-following indicators, the 200-day SMA provides us with a general idea for price direction: trending lower or trending higher. Carl Swenlin of DecisionPoint refers to technical analysis as a windsock, not a crystal ball. The 200-day SMA is also like a windsock. It tells us which way the wind is currently blowing, but this does not mean the wind will continue blowing in the same direction. The “wind” is blowing down when price is below the 200-day SMA and/or the 200-day SMA is falling.

A number of ETFs surged to their falling 200-day SMAs over the last two to five weeks. For example, the advance in the S&P 500 started in mid October (25 days ago) and the advance in the Gold SPDR (GLD) started on November 3rd (9 days ago). Let’s look at stock-based ETFs first and then turn to the metals ETFs. The chart below shows SPY hitting a new low in October and then advancing to towards the falling 200-day SMA. Several items confirm the long-term downtrend on this chart: below the 200-day, falling 200-day, negative Trend Composite and lower-low lower high sequence this year.

The windsock tells us that the long-term trend is down at this stage. As such, the advance since mid October is deemed a counter-trend bounce or bear market rally. SPY also hit a resistance-reversal zone in the 400-410 area. Counter-trend bounces retraced around 2/3 of the prior decline in April, August and now November. The prior bounces also failed near the 200-day SMA. Thus, SPY sits on a precarious perch because it was overbought last week, is near a resistance-reversal zone and the long-term trend is down. A break below 380 would reverse the short-term uptrend and signal continuation of the long-term downtrend.

In a separate, but related note, the next chart shows SPX $Above 20-day SMA hovering around the 80% area since October 25th. A move below 60% would be short-term bearish.

The next chart shows the S&P 500 EW ETF (RSP) closing above its falling 200-day SMA twice in the last four days. The Trend Composite also turned positive on Monday. RSP is stronger than SPY, but we are still in a bear market and I am taking the bullish signal in RSP with a pinch of salt (skepticism). The red lines show the impulse moves, which are in the direction of the primary trend (big trend). The yellow lines highlight the secondary trends, which are the counter-trend bounces within the bigger downtrend.

The Trend Composite aggregates signals in five trend indicators: Bollinger Bands (125,1), Keltner Channels (125,2), 5-day Rate-of-Change of 125-day SMA, StochClose (125,5) and CCI-Close (125). The Trend Composite and ten other indicators are part of the TIP Indicator Edge Plugin for StockCharts ACP

The next chart shows the Russell 2000 ETF (IWM) hitting the falling and retracing 2/3 of the prior decline. This is also a resistance-reversal zone. QQQ is not in this group because it is well below the falling 200-day and underperforming the broader market.

You can learn more about my chart strategy in this article covering the different timeframes, chart settings, StochClose, RSI and StochRSI.

Key Sector and Industry Group ETFs Hit Falling 200-day SMAs

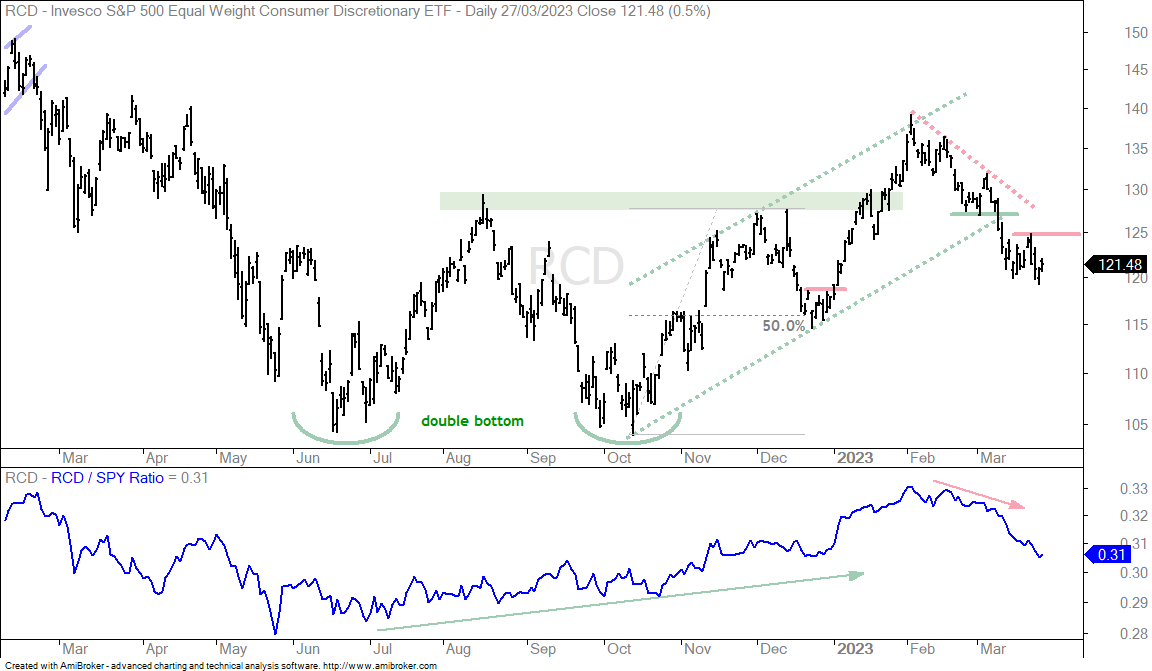
Several sector and industry group ETFs are trading near their falling 200-day SMAs as well. I am not going to cover all of them, but here is a list of the more important ETFs. The first two ETFs represent the average stock in the tech sector and the consumer discretionary sector. Tech represents the high-beta trade (risk on) and consumer discretionary represents the most economically sensitive group. Both ETFs bounced from 52-week lows and are trading near their falling 200-day SMAs. They are short-term overbought and in a long-term downtrend, which puts them at a precarious spot (resistance-reversal zone).

You can learn more about exit strategies in this post,
which includes a video and charting options for everyone.

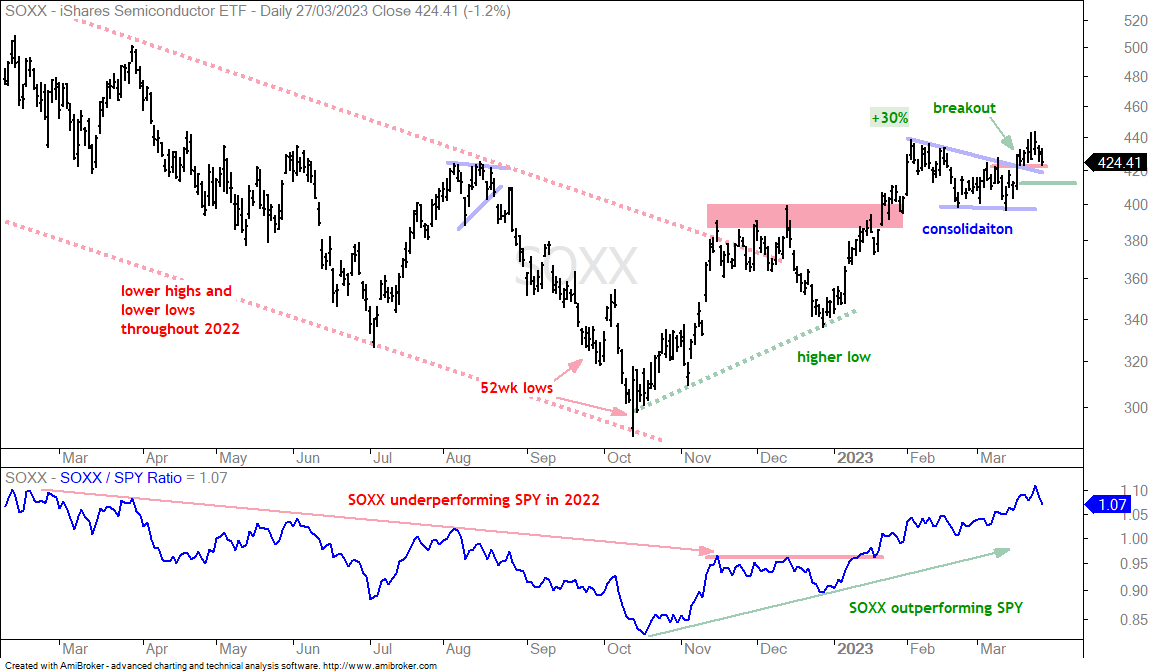
The Semiconductor ETF (SOXX) is one of a handful of tech-related ETFs that cleared their October highs. Note that SKYY, FDN, FINX and CIBR did not break above their October highs and IGV is already back below its October high. Tech ETFs are weaker than the broader market. Semis are leading the tech-based ETFs over the last five weeks, but SOXX hit a resistance-reversal zone this week and became short-term overbought. Also notice that SOXX is just below its falling 200-day SMA.

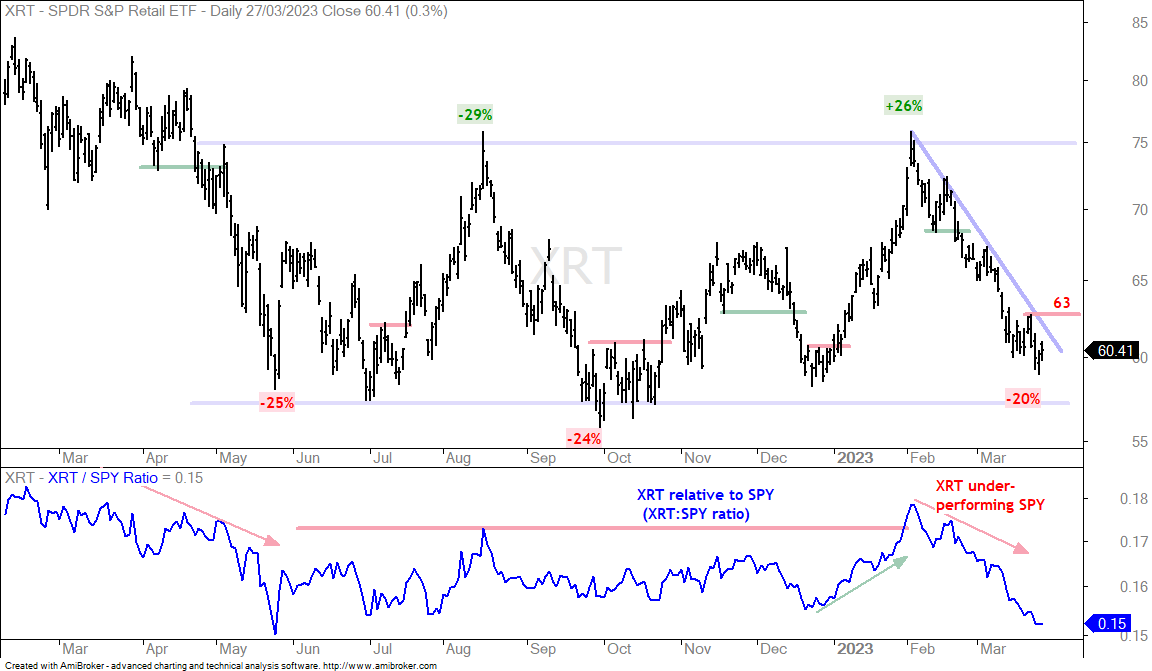
The Retail SPDR (XRT) also retraced around 2/3 of the prior decline and hit the falling 200-day SMA.

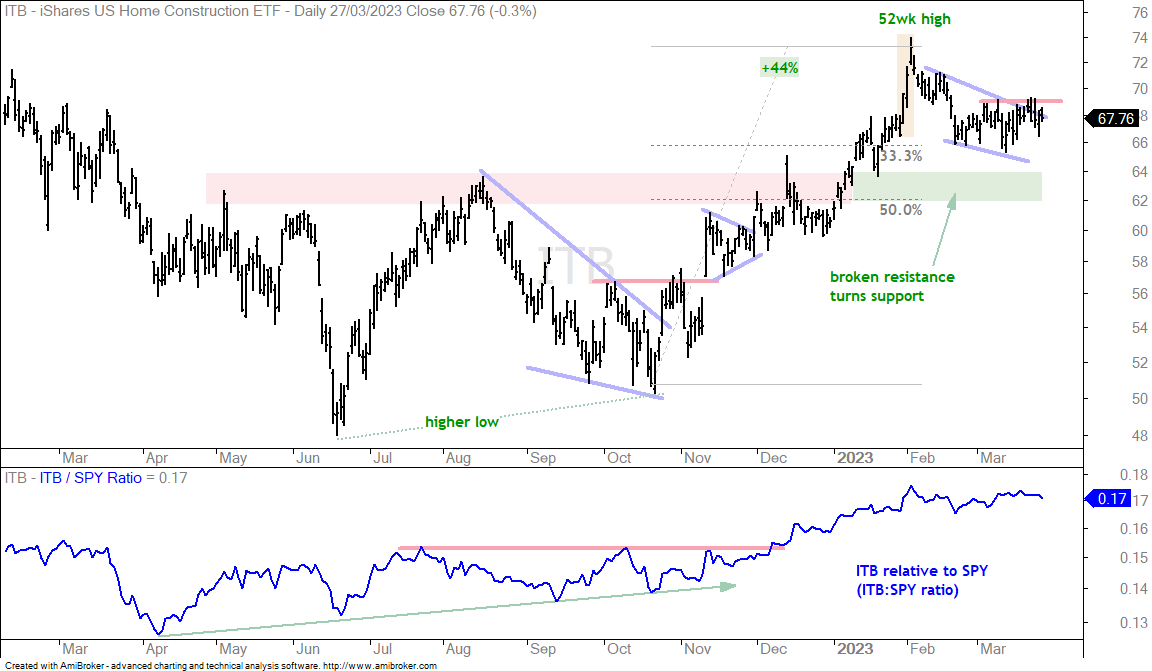
Some ETFs formed higher lows from July to September and showed relative strength when the S&P 500 SPDR was hitting new lows. Some of these ETFs broke out with surges last week. These breakouts are technically bullish, but keep in mind that we are still in a bear market and breakouts in bear markets are fragile. The first chart shows the Home Construction ETF (ITB) with a breakout surge that is still holding. ITB is battling the falling 200-day SMA and A break below 55 would negate the triangle breakout.

The next chart shows the Regional Bank ETF (KRE) with a breakout, but the ETF hit the falling 200-day SMA. A break below 61 would negate the triangle breakout.

Gold, Silver and Copper Surge to 200-day SMAs

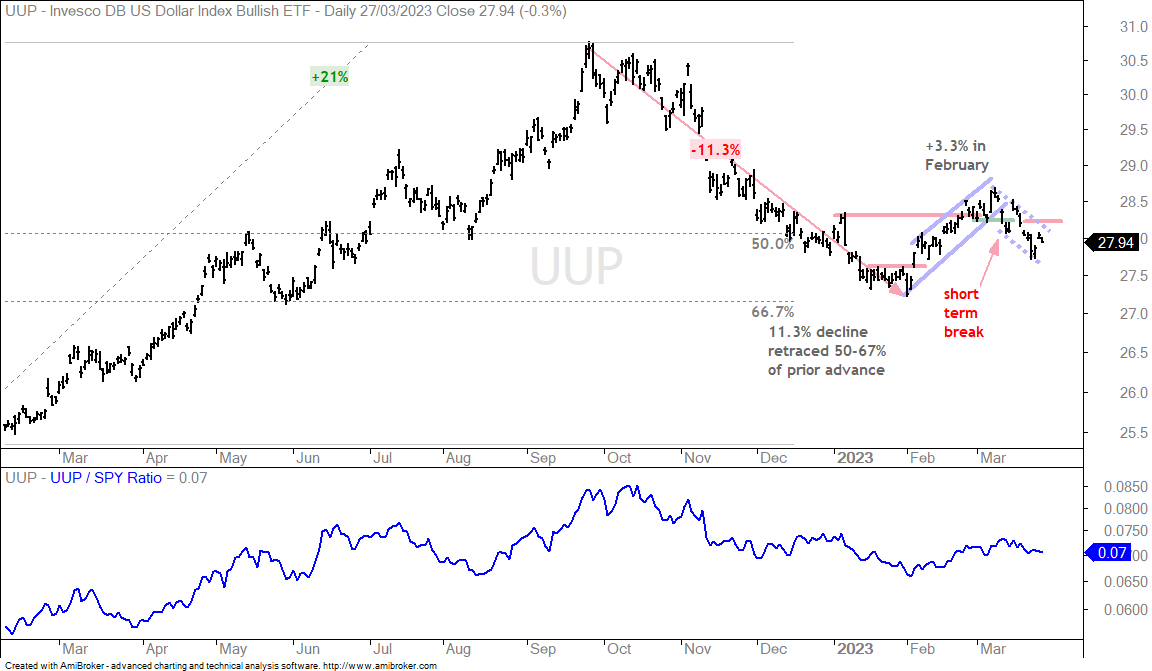
Metals let the market over the last two weeks with big moves on the heels of a sharp decline in the Dollar. Note that the Dollar Bullish ETF (UUP) is still in a long-term uptrend and nearing its rising 200-day SMA. It is also short-term oversold and ripe for a bounce, which could knock the wind out of metals.

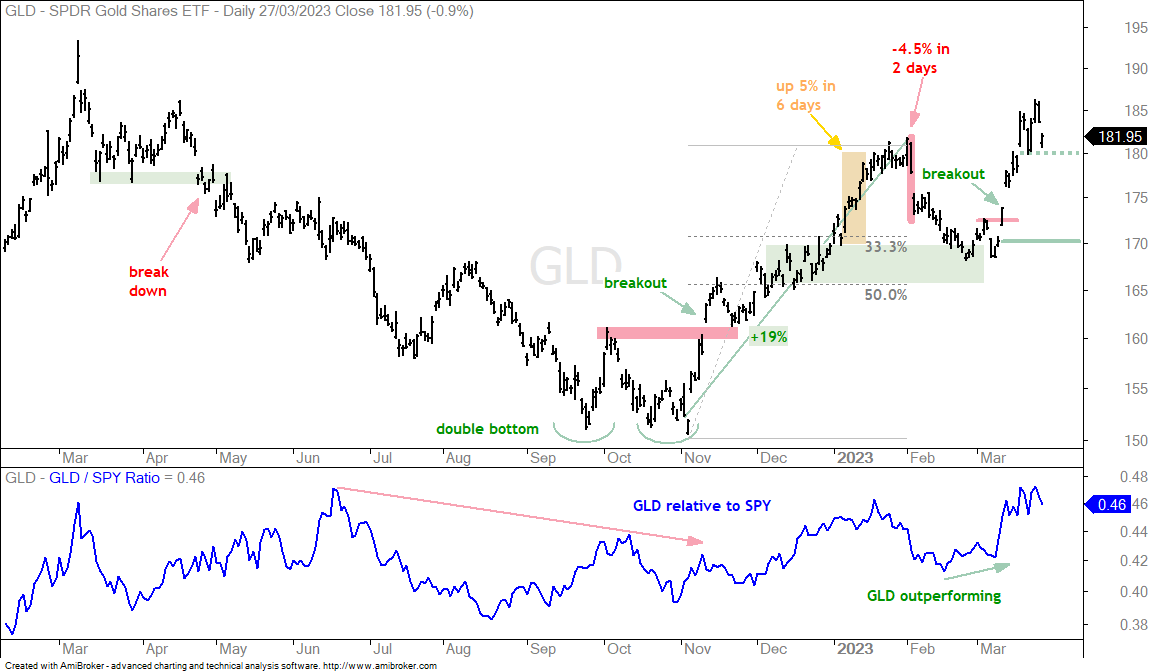
The next chart shows the Gold SPDR (GLD) with a 9% surge in eight days. This surge pushed GLD out of the falling channel and broke resistance from the October high. This is bullish price action, but GLD is short-term overbought after this surge and still below the falling 200-day SMA. At the very least, I would exercise some discretion and wait for a tradable pullback before considering a long position. A 50% retracement would extend to the 158-159 area.

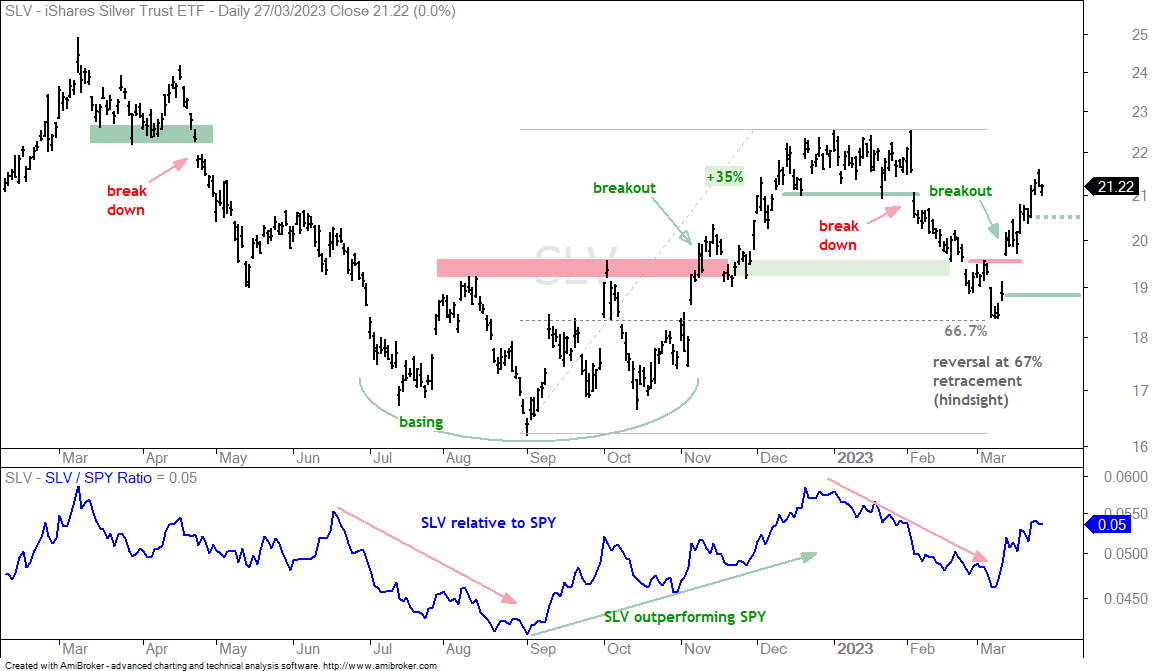
The Silver ETF (SLV) broke above a resistance zone from the August-October highs with a 20% advance in 21 days. The higher high is bullish, but SLV is short-term overbought and trading right at the falling 200-day SMA. A 50% retracement of the prior surge would extend to the 18.5 area.

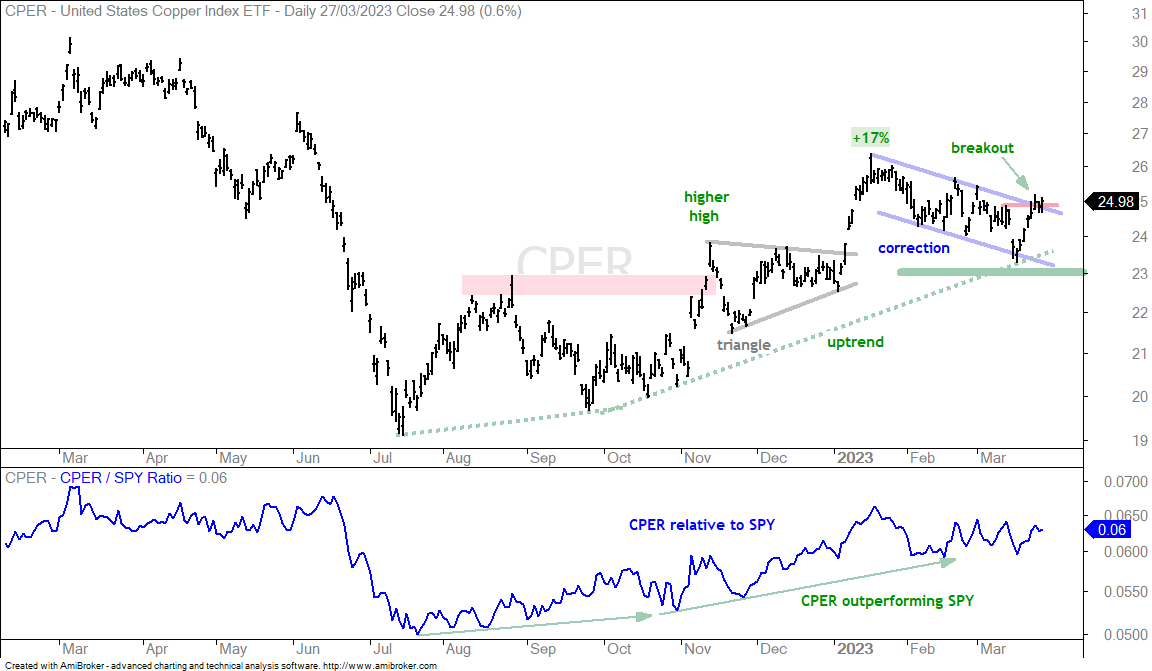
The Copper ETF (CPER) broke out of a triangle in early November with a 19% surge in 18 days. We do not need an oscillator to understand that CPER is short-term overbought. A big percentage gain in a short period of time translates into overbought conditions. CPER fell back the last three days and the blue shading marks first support in the 21.5-22 area.

US Oil Fund Fails to Bounce (USO)

The US Oil Fund (USO) is up slightly since mid October, but the ETF is down over the last two weeks and failed to bounce when the Dollar plunged. Oil is also not moving higher with the stock market and this is cause for concern. The chart shows USO hitting resistance from the August-September highs in November (red shading). A rising wedge since late September retraced around half of the prior decline. Both the wedge and the retracement amount are typical for counter-trend rallies. USO moved back below its rising 200-day this week and a break below 70 would be bearish.

A breakdown in oil and weakness in the broader market could weigh on energy-based ETFs, which are leading the market. The chart below shows the Energy SPDR (XLE) hitting a new high this week after a 35% advance off the September lows. At the very least, XLE is short-term extended and ripe for a pullback. The breakout zone and pennant mark first support in the 78-83 area (blue shading). XOP and FCG have similar chart characteristics.

Previous Reports and Video

Wednesday: Market and ETF Video (here)

  • Composite Breadth Model Remains Bearish
  • %Above 20-day SMA Stays Overbought
  • Fed in QT Mode
  • CCC and BBB Spreads are Elevated, but Narrowing
  • Election, Seasonality and Inflation Expectations
  • 200-day SMAs in Play after Big Bounces
  • SPY Extends Counter-trend Bounce
  • TLT Surges to Ignite Counter-trend Bounce (10yr < 4%)
  • Dollar Bullish ETF Becomes Oversold within Uptrend
  • Gold Breaks October High and Challenges 200-day
  • ETFs: 42 New Uptrends and 78 Uptrends (of 274)
  • Small and Mid Caps Leading as QQQ Lags
  • Housing, Semis and Banks Lead with New Signals* (*But)
  • Big Six Sectors are Split (XLK, XLY, XLC, XLI, XLF, XLV)
  • Cup Remains Half Full for Oil as Wedge Rises (USO, DBE)
  • Energy SPDR Hits New High as Others Extend Higher (XLE, XOP, FCG)
  • IoT and Semiconductor SPDR Lead Tech ETFs (SNSR, XSD)
  • Networking ETF Reverses after Sharp Pullback (IGN)
  • Water Resources ETF Extends on Breakout (PHO)
  • Relative Leaders Pull Back/Stall as Others Surge (PPA, KIE, XLV, IHF)
  • Large-cap Biotech ETF Leads Broad Biotech ETF (IBB, XBI)
  • Copper and Copper Miners ETFs Surge to 200-day SMAs (CPER, COPX)
  • Clean Energy ETFs Turn up with Market (TAN, ACES, QCLN)
  • Lithium Battery Tech ETF Breaks October Highs (LIT)
  • Palladium ETF Reverses Downswing with Surge (PALL)
  • Platinum and Silver Break Summer Highs (PLTM, SLV)
  • Soybean and LiveStock ETFs Hold Up (SOYB, COW)

Wednesday: Market Regime Update with Breadth Model and Yield Spreads (here)

Tuesday: Market and ETF Report (here)

  • Composite Breadth Model Remains Bearish
  • Thanksgiving Week Pause
  • SPX %Above 20-day SMA Holds Up
  • Mind the Gap in SPY
  • XLK, XLC and XLY Lag as XLI, XLF and XLV Lead
  • The Macro Movers (Euro, Dollar, Bonds, Metals, Oil)
  • IBB Challenges August High (IBB, XBI)
  • Water Resources ETF hits New Relative High (PHO)
  • Clean Energy ETFs Catch a Bid (TAN, ACES, QCLN)

You can learn more about my chart strategy in this article covering the different timeframes, chart settings, StochClose, RSI and StochRSI.

Thanks for tuning in and have a great day!

Market/ETF Video – 200-day SMAs Coming into Play, Big Sectors are Split, Oil Holds Support, Copper Challenges 200-day (Premium)

The Market Regime for stocks remains bearish with the Composite Breadth Model at -5, yields spreads at elevated levels and the Fed balance sheet contracting. Even though SPY surged the last five weeks, the big picture items remain the same and I have yet to see enough strength to change these

Market/ETF Video – 200-day SMAs Coming into Play, Big Sectors are Split, Oil Holds Support, Copper Challenges 200-day (Premium) Read More »

Market and ETF Report – Macro Moves Dominate, SPY Stays Overbought, Biotechs and Water Lead, Oil Lags (Premium)

There were some big moves over the last three days as the markets reacted to lower-than-expected inflation numbers. Stocks have been moving higher since mid October with many ETFs sporting double digit gains the last five weeks. Many of these big moves

Market and ETF Report – Macro Moves Dominate, SPY Stays Overbought, Biotechs and Water Lead, Oil Lags (Premium) Read More »

Market and ETF Report – Large-cap Techs Lead New Low List, ITB Forms Bearish Wedges, Metals Make some Big Moves (Premium)

The broad market environment remains bearish for stocks and not exactly bullish for stock alternatives. Most commodity, bond, currency and country ETFs are in downtrends. There are some isolated uptrends within these groups, but the vast majority of ETFs in the

Market and ETF Report – Large-cap Techs Lead New Low List, ITB Forms Bearish Wedges, Metals Make some Big Moves (Premium) Read More »

Market/ETF Video – Bear Market Bounce, Key Groups Leading Lower, Weak Dollar Spurs Rally in Metals (Premium)

The Market Regime for stocks remains bearish with the Composite Breadth Model at -5, yields spreads at elevated levels and the Fed balance sheet contracting. Stocks bounced off their October lows, but this bounce is deemed a counter-trend bounce within a bigger uptrend and there are signs

Market/ETF Video – Bear Market Bounce, Key Groups Leading Lower, Weak Dollar Spurs Rally in Metals (Premium) Read More »

Market and ETF Report – 90% Down Day, High Beta Sectors Lead Lower, Oil Bucks the Selling Pressure, Soybeans Pop (Premium)

Stocks answered the Fed policy statement with a big sell off on Wednesday afternoon. All eleven sectors were down with the Consumer Discretionary SPDR (XLY) and Technology SPDR (XLK) leading the way lower by falling more than 3.5%. XLK represents tech, while XLY represents consumer spending,

Market and ETF Report – 90% Down Day, High Beta Sectors Lead Lower, Oil Bucks the Selling Pressure, Soybeans Pop (Premium) Read More »

Market/ETF Video – Bounce within Bear Market, New Trend Composite in Several ETFs,  Trading Ranges equate to Relative Strength (Premium)

The S&P 500 is in the midst of a modest oversold bounce within a bigger downtrend. The Composite Breadth Model remains bearish, yield spreads are elevated and the overall environment for stocks is bearish. Counter-trend bounces are part of the process and I have yet to see enough strength to suggest that

Market/ETF Video – Bounce within Bear Market, New Trend Composite in Several ETFs,  Trading Ranges equate to Relative Strength (Premium) Read More »

Market and ETF Report – Bouncers vs Leaders, SPY Remains Overbought, More Trend Composite Signals, Measuring Relative Performance (Premium)

Almost everything is bouncing, but not everything is leading. Stocks forged a massive one day reversal on October 13th as SPY opened around 349 and closed near 366 for a 2.6% gain on the day. The move from open to close was +4.8%. Stocks followed through on this reversal day with further

Market and ETF Report – Bouncers vs Leaders, SPY Remains Overbought, More Trend Composite Signals, Measuring Relative Performance (Premium) Read More »

Market and ETF Report – Bear Market vs Seasonality and Up Swing, Getting Overbought, UUP Hits Support, Metals Bounce (Premium)

The S&P 500 SPDR (SPY) is up around 7% the last two weeks and we are starting to see short-term overbought indications. Overbought, keep in mind, is a double-edged sword. Overbought suggests that the advance is getting over extended and the bigger downtrend could take over soon

Market and ETF Report – Bear Market vs Seasonality and Up Swing, Getting Overbought, UUP Hits Support, Metals Bounce (Premium) Read More »

Market/ETF Video – Breadth Becomes Overbought in Downtrend, Healthcare, Energy and Defense Lead, Ag and Industrial Metals Stall Out (Premium)

The Composite Breadth Model remains bearish, yield spreads are elevated and the overall environment for stocks is bearish. SPY became quite oversold in late September and early October, and then turned choppy in October. The latest October swing is

Market/ETF Video – Breadth Becomes Overbought in Downtrend, Healthcare, Energy and Defense Lead, Ag and Industrial Metals Stall Out (Premium) Read More »

Market and ETF Report – Volatility within a Downtrend, Energy Leads, Healthcare Holds Up Better, Defense Pops, Metals Sink with China (Premium)

It’s a bit of a mess out there, both fundamentally and technically. Technically, we have new lows in Chinese stock indexes after sharp declines on Monday, and the major US and European indexes are in downtrends. The major index ETFs here in the US became oversold in late September

Market and ETF Report – Volatility within a Downtrend, Energy Leads, Healthcare Holds Up Better, Defense Pops, Metals Sink with China (Premium) Read More »

Market and ETF Report – Firming within Downtrend, Economically Sensitive Lead Lower, Energy ETFs Outperforming, Metals Sink (Premium)

Stocks are attempting to firm here in October, but any firmness would be a consolidation within a bigger downtrend and any bounce would be considered a counter-trend bounce within a bigger downtrend.

Market and ETF Report – Firming within Downtrend, Economically Sensitive Lead Lower, Energy ETFs Outperforming, Metals Sink (Premium) Read More »

Market/ETF Video – Volatile Price Action with Downtrend, TLT Hits New Low, Only A Handful of Uptrends in the ETF Universe (Premium)

The Composite Breadth Model remains bearish, yield spreads remain elevated and the overall environment for stocks remains bearish. Price action in the major index ETFs turned choppy and volatile the last few weeks, but this is considered noise within a larger downtrend. September and October

Market/ETF Video – Volatile Price Action with Downtrend, TLT Hits New Low, Only A Handful of Uptrends in the ETF Universe (Premium) Read More »

Market and ETF Report – Bounce within Bigger Downtrend, A Few ETFs Showing Relative Strength, Energy ETFs Hit Moment of truth (Premium)

The S&P 500 SPDR (SPY) is in a long-term downtrend, but in the midst of a oversold bounce, which started with the outside reversal day on Thursday. SPY started this bounce after a 52-week low so this is still considered a counter-trend bounce within a bigger downtrend. Stocks

Market and ETF Report – Bounce within Bigger Downtrend, A Few ETFs Showing Relative Strength, Energy ETFs Hit Moment of truth (Premium) Read More »

Market and ETF Report – ETFs Showing Medium and Short Term Relative Strength (Less Weakness), A Look at Gold Miners Breadth (Premium)

Today’s report is a motley mix of ETFs. Only two are in actual uptrends (biotech and the Dollar). The Trend Composites for the clean energy ETFs turned negative on Wednesday so these are clearly out of the picture now. While many ETFs broke their summer lows in September and broke their late September lows in October, some held above both of these lows

Market and ETF Report – ETFs Showing Medium and Short Term Relative Strength (Less Weakness), A Look at Gold Miners Breadth (Premium) Read More »

Market and ETF Report – Downtrend Overpowers 2-day Pop, Energy ETFs Hit Short-term Resistance, Wheat and Ag Hold Uptrends (Premium)

Stocks did the old pop and drop with the market surging Monday-Tuesday last week and then falling the next four days. Many ETFs moved to new lows, but some managed to hold above last week’s lows. Several tech and bond related ETFs hit fresh 52-week lows, which

Market and ETF Report – Downtrend Overpowers 2-day Pop, Energy ETFs Hit Short-term Resistance, Wheat and Ag Hold Uptrends (Premium) Read More »

Scroll to Top