Market and ETF Report – Small-caps Lagging, Watching Short-term Supports, Defensive Groups Leading (Premium)

The weight of the evidence is largely bullish for stocks, but it is clearly a tale of two markets. Large-caps and high-quality stocks are holding up better than small-caps and high-beta stocks. We are also seeing money move into defensive groups with leadership coming from healthcare, consumer staples and utilities. Tech-related ETFs were leading from mid March to early April, but they are lagging in April as the market becomes more risk averse. I am watching the upswings in SPY, QQQ and IWM for clues. The market is doing fine as long as they hold their upswings. Short-term reversals and support breaks in two of the three would be bearish and call for a broad market downswing.
About the ETF Trends, Patterns and Setups Report

This report contains discretionary chart analysis based on my interpretation of the price charts. This is different from the fully systematic approach in the Trend Composite strategy series. In this ETF Trends, Patterns and Setups report, I am looking for leading uptrends and tradable setups within these uptrends. While I use indicators to help define the trend and identify oversold conditions within uptrends, the assessments are mostly based on price action and the price chart (higher highs, higher lows, patterns in play). Sometimes the chart assessment can be at odds with the indicators.

Report Schedule

  • Tuesday – 25-Apr: Market/ETF Report
  • Wednesday – 26-Apr: Announcement on Future Plans
  • Wednesday – 26-Apr: Market/ETF Video
  • Thursday – 27-Apr: S&P 500 Stock Strategy

Market Regime is Bullish for Stocks

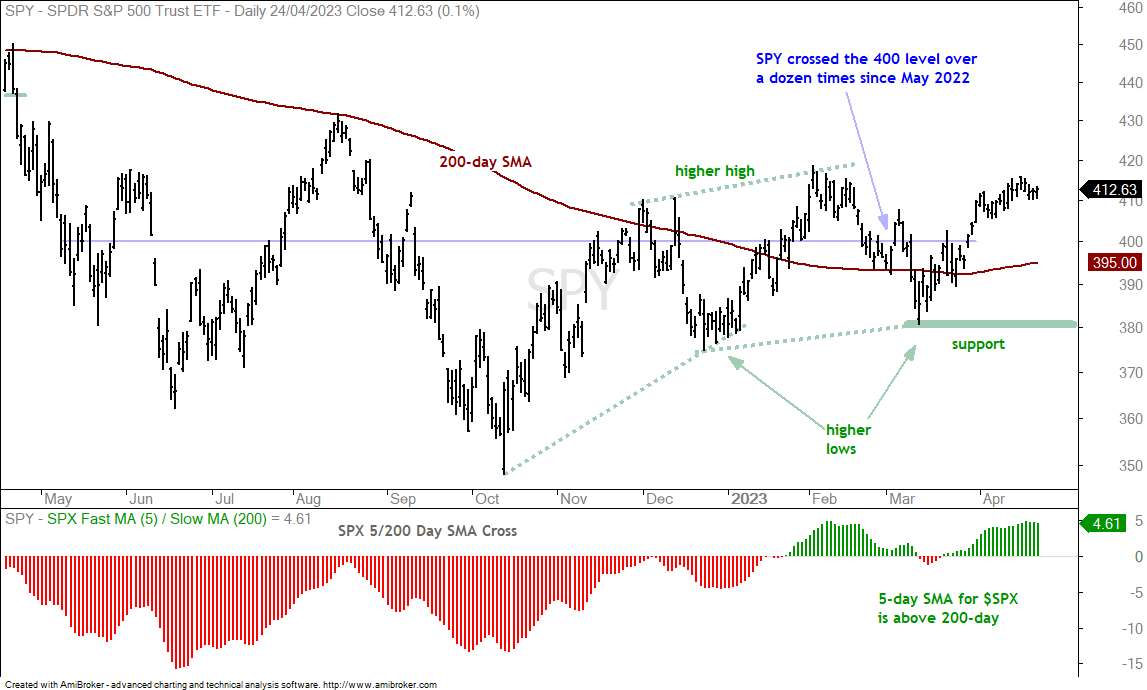
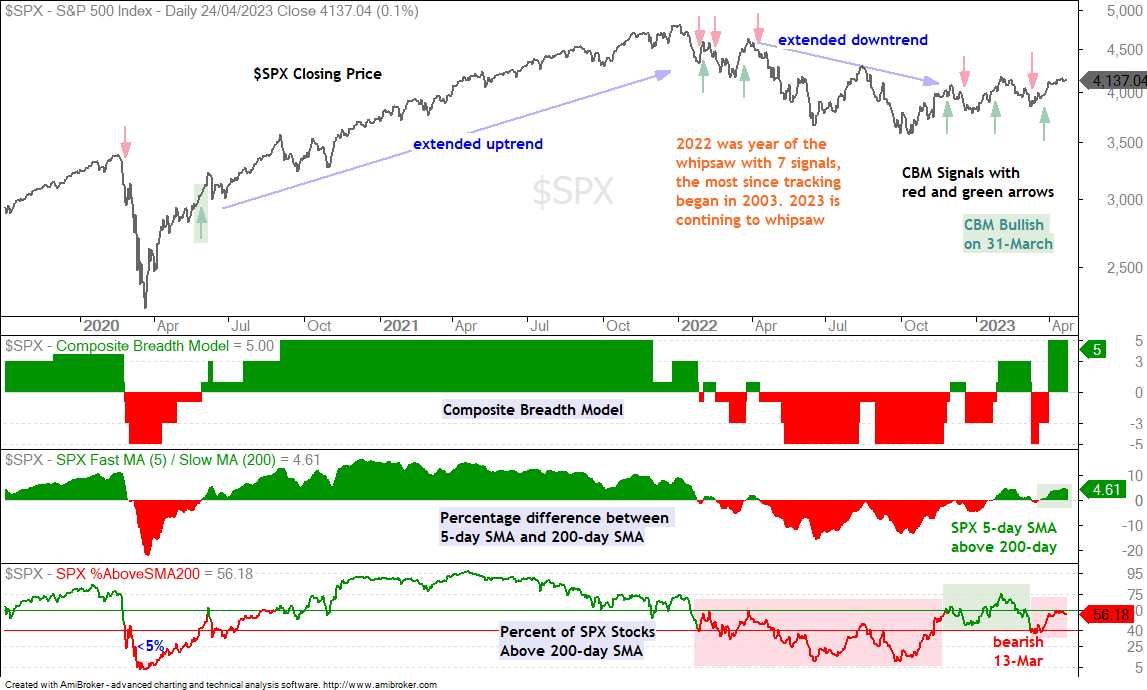
The Composite Breadth Model remains at +5 and net bullish, but fewer stocks are participating in the current advance (mid March to mid April). The bottom window shows the percentage of S&P 500 stocks above their 200-day SMA. This indicator reached 63% in early December and hit 76% in early February. It did not exceed 60% on the most recent advance and peaked at 59%. Fewer stocks are above their 200-day SMA right now.

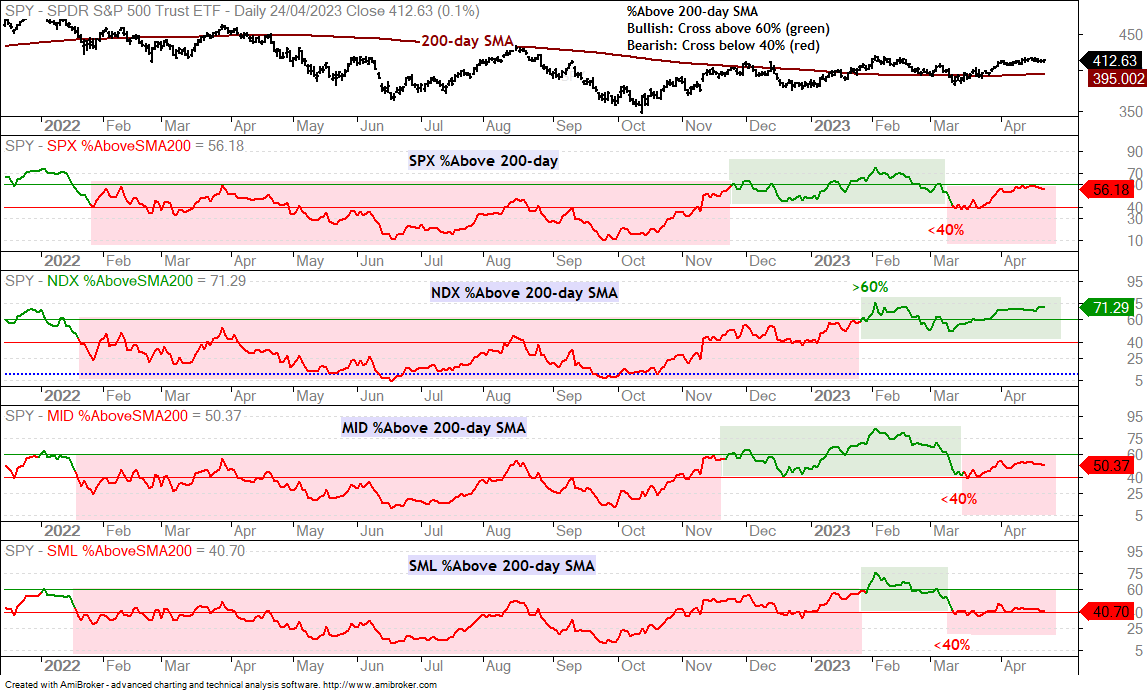
The next chart shows the percentage of stocks above the 200-day SMA for the S&P 500, Nasdaq 100, S&P MidCap 400 and S&P SmallCap 600. Only 40.7% of small-caps are above their 200-day SMAs and this group is seriously lagging. Also notice that three of the four are on bearish signals (red shading). This means they moved below 40% in mid March and have yet to get back above 60%, which is the bullish threshold.

SPY Remains in Long-term Uptrend

There is no change in the long-term trend. SPY hit a new low in October and then moved higher the last six months. Even though the trend is up with a higher high and higher low (green dashed lines), SPY has gone nowhere for a year. SPY closed at 428.51 on 25-April-2022 and is currently at 412.63. There is an uptrend, but it is choppy.

SPY Stays Overbought

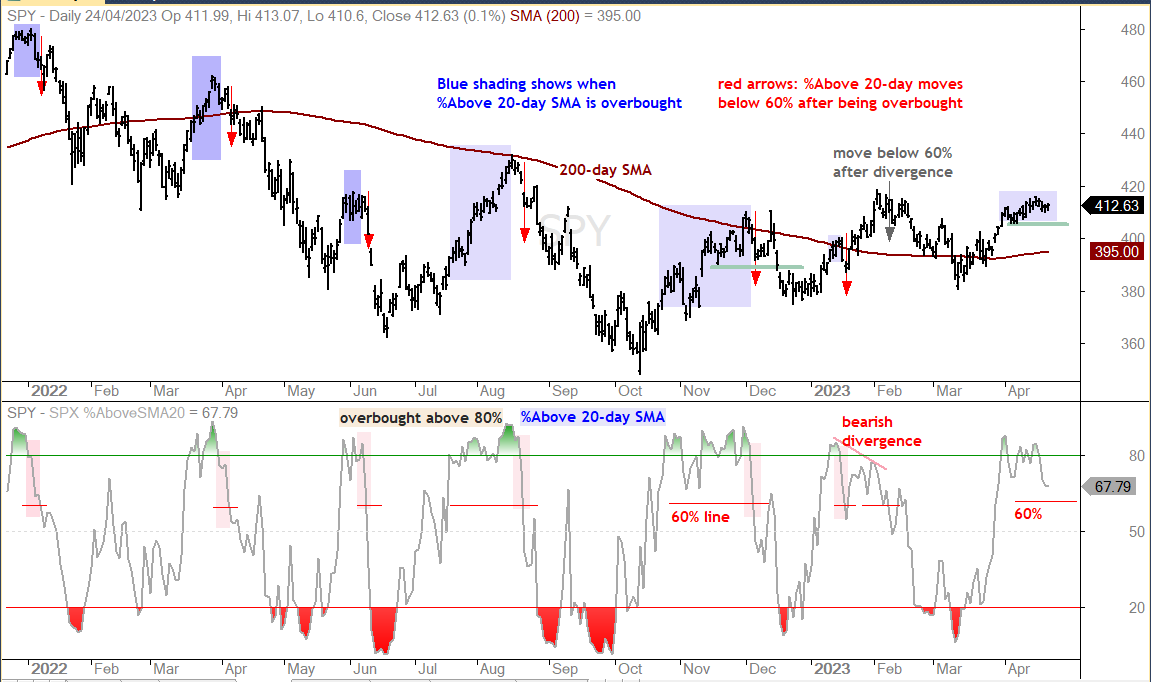
The next chart shows SPY with SPX %Above 20-day SMA in the indicator window. This indicator becomes overbought when above 80% and triggers a bearish signal with a subsequent move below 60%. The blue shading shows when SPY is overbought and the red arrows show when a bearish signal triggers. This setup-signal worked well from January to August. The December and January signals did not work though. %Above 20-day SMA is currently at 67.79% and a break below 60% would be short-term bearish. On the price chart, a support break at 405 would reverse the upswing.

QQQ Consolidates after Big Advance

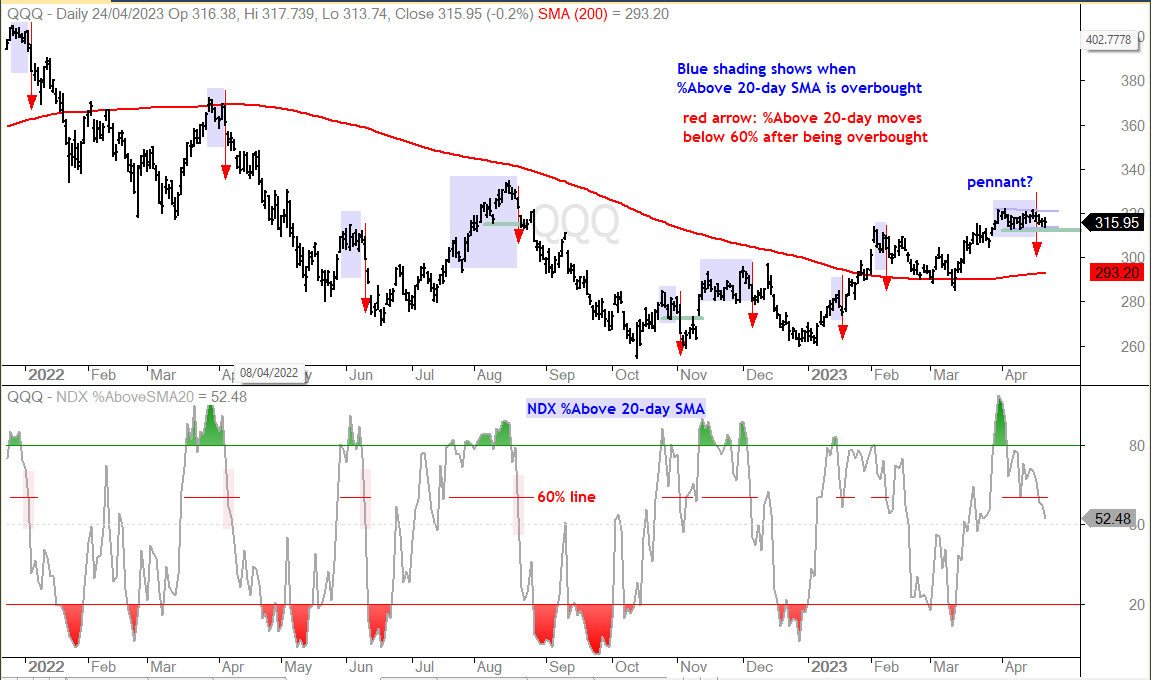
Nasdaq 100 stocks are not as strong as S&P 500 stocks here in April. Notice that only 52.5% of Nasdaq 100 stocks are above their 20-day SMAs, compared to 67.8% of S&P 500 stocks. The chart below shows NDX %Above 20-day SMA becoming overbought on March 30th with a surge above 80% and moving below 60% last week (April 20th). This is a bearish breadth signal. On the price chart, QQQ stalled the last few weeks and this could be a short-term bullish continuation pattern. A break above 323 would be bullish. Given the breakdown in NDX %Above 20-day SMA, an upside breakout looks less likely. Watch for a support break at 312 to signal a downturn.

Small-caps Continue to Underperform

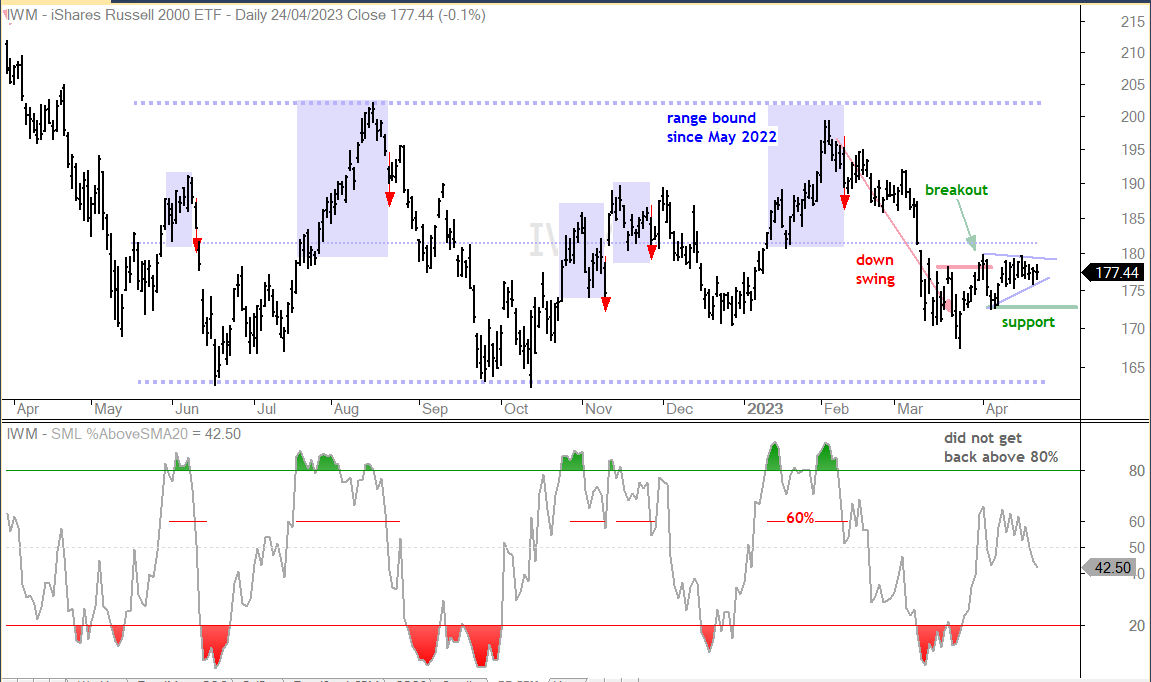
The next chart shows the Russell 2000 ETF (IWM) with $SML %Above 20-day SMA in the indicator window. Overall, IWM has been range bound since May 2022 (one year). The swing within this range was down from early February to mid March. IWM reversed this downswing with a break above the mid March high and surge into early April (breakout). There was a sharp drop on April 4th and 5th and then a rebound back above 175. As with QQQ and SPY, the April low marks support and it is at 173 for IWM. A break here would be short-term bearish. The blue lines show a potential consolidation and a break above 180 would be bullish.

SPY, QQQ and IWM are still in short-term uptrends and all three are basically stalling here in April. The April highs mark consolidation resistance and breakouts would be bullish. The April lows mark short-term support and breaks here would be short-term bearish for the broader market. Small-caps are the weakest of the three because only 42.5% of S&P SmallCap 600 stocks are above their 20-day SMAs. Also notice that SML %Above 20-day SMA did not come near the 80% level in April (relative weakness). NDX %Above 20-day SMA already triggered bearish. Given underlying weakness, I think short-term support breaks are more likely and this could set the stage for the next downswing.

Aero-Defense, Medical Devices and Housing Lead (PPA, ITB, IHI)

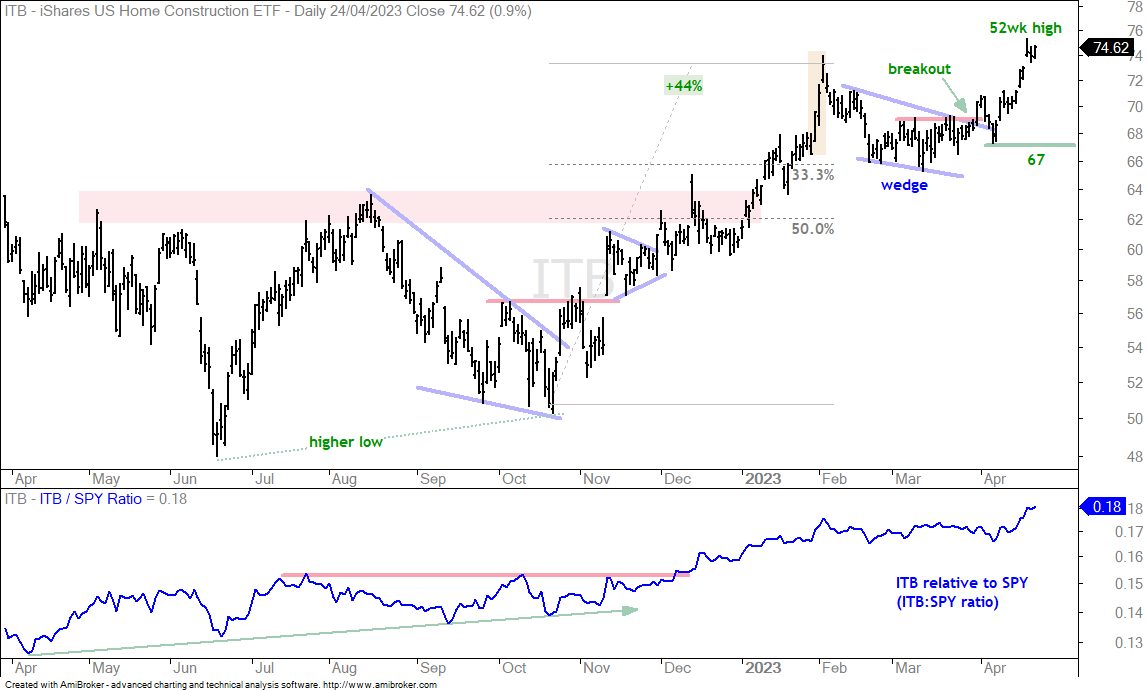
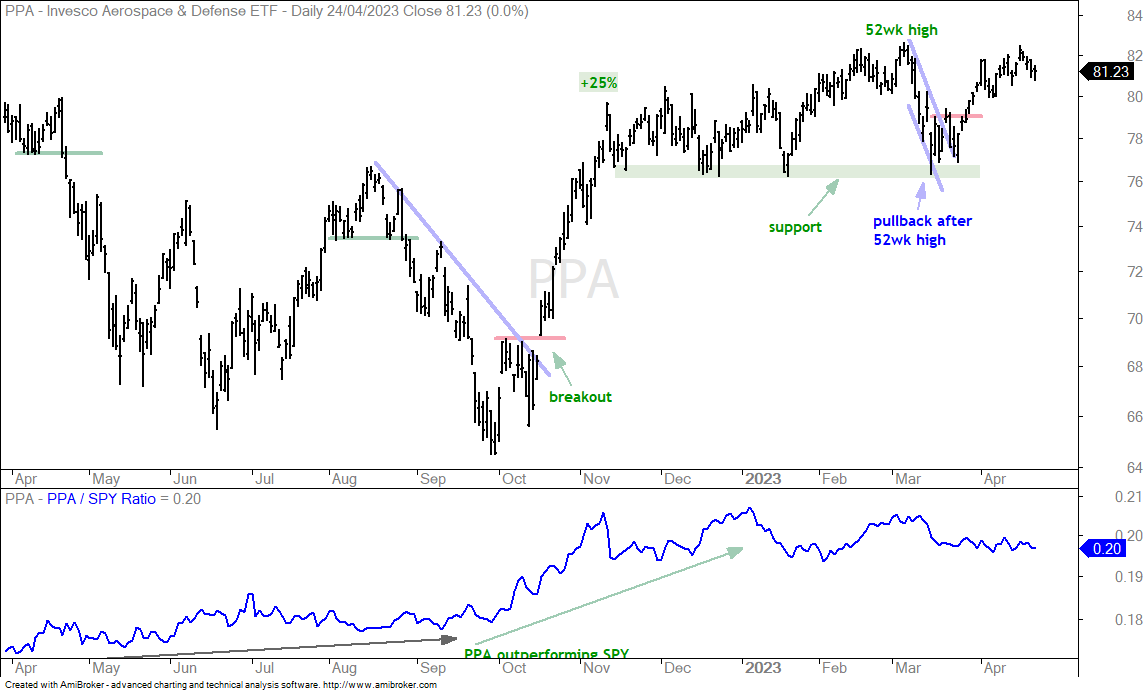
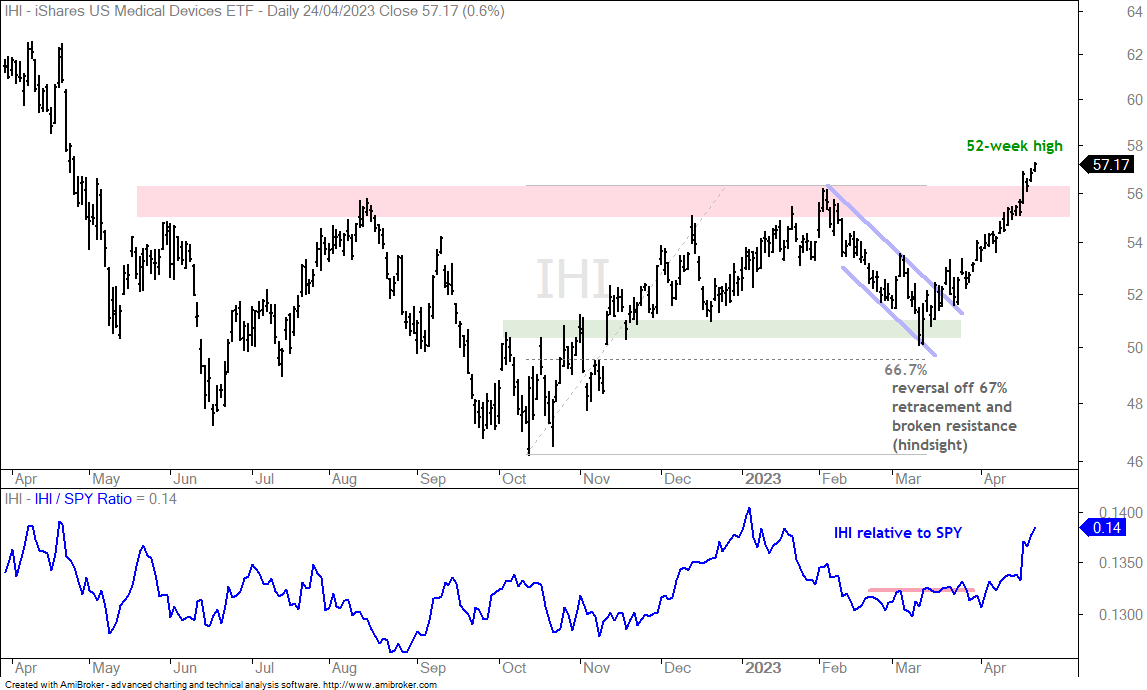
ETFs close to 52-week highs are in uptrends and leading the market. The Home Construction ETF (ITB) and Medical Devices ETF (IHI) hit 52-week highs the last few days and the Aerospace & Defense ETF (PPA) is within 2% of a 52-week high. The first chart shows ITB with a breakout in late March, a throwback to 67 in early April and a surge above 74. ITB is short-term overbought after a 10% advance the last eleven days.

The next chart shows PPA with a 52-week high in early March, a pullback to support in mid March and a surge above 80 in April. There is no setup on this chart. Just a leading uptrend as the world re-arms.

The next chart shows IHI with a reversal off the 67% retracement and broken resistance zone. The ETF also forged a channel breakout and the price-relative (IHI:SPY ratio) turned up in April. I missed this setup, but it is one to keep in mind for the future.

Defensive Groups Leading the Market (SPLV, XLV, XLP, XLU)

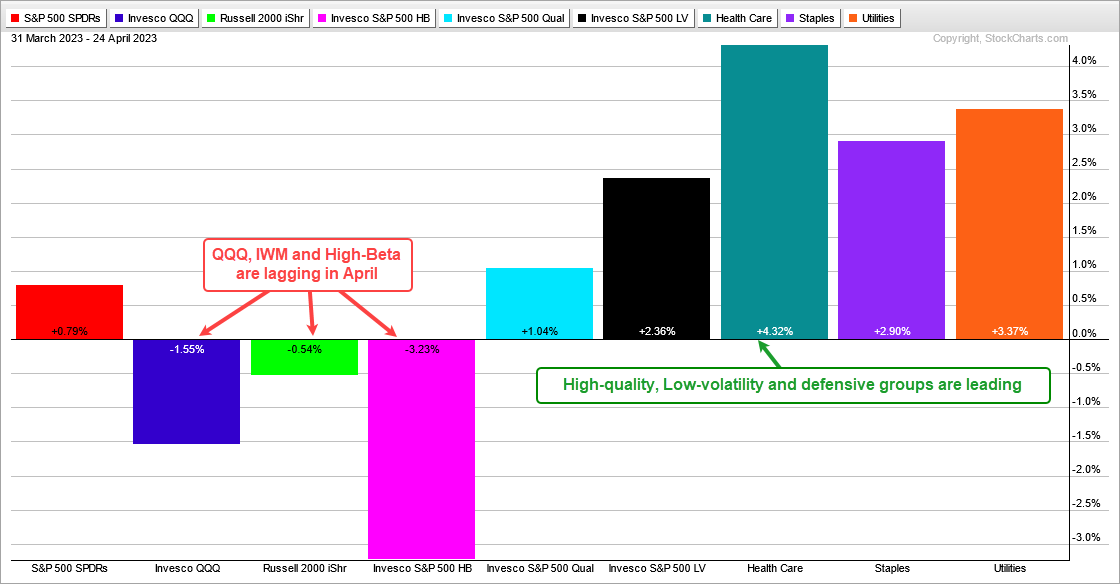
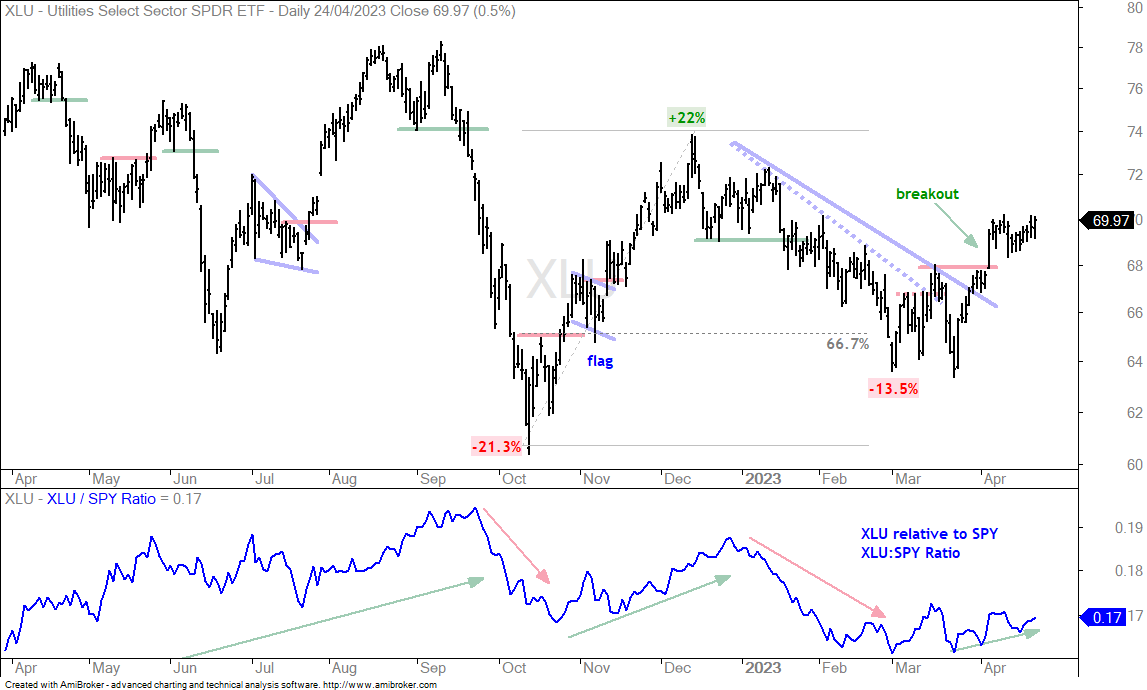
The S&P 500 SPDR (SPY) is up .79% here in April, QQQ is down 1.55% this month and IWM is down .54%. The S&P 500 Low Volatility ETF (SPLV) and most of the defensive groups are up more than SPY in April (leading). These include SPLV (+2.36%), the Healthcare SPDR (+4.32%), the Consumer Staples SPDR (+2.9%) and the Utilities SPDR (+3.37%). The PerfChart below captures this dynamic. The market prefers defense over offense here in April and this shows risk-aversion.

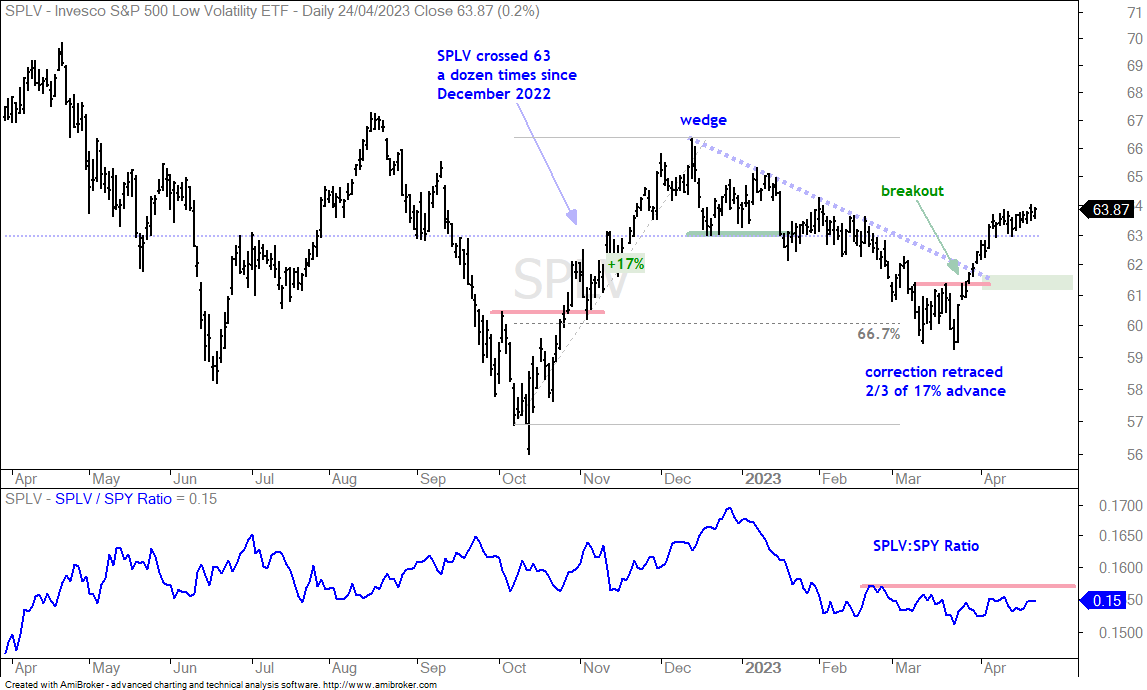
These defensive ETFs were swinging back and forth within trading ranges that extended back over a year. Trend-following indicators do not work in trading ranges so we must focus on the swings within the ranges. The swings were down from December to mid March as the defensive groups underperformed. These groups reversed their downswings with breakouts in late March and led the market in April. Note that TrendInvestorPro highlighted these ETFs as they set up in late March (report here). The first chart shows SPLV with a breakout near 61.

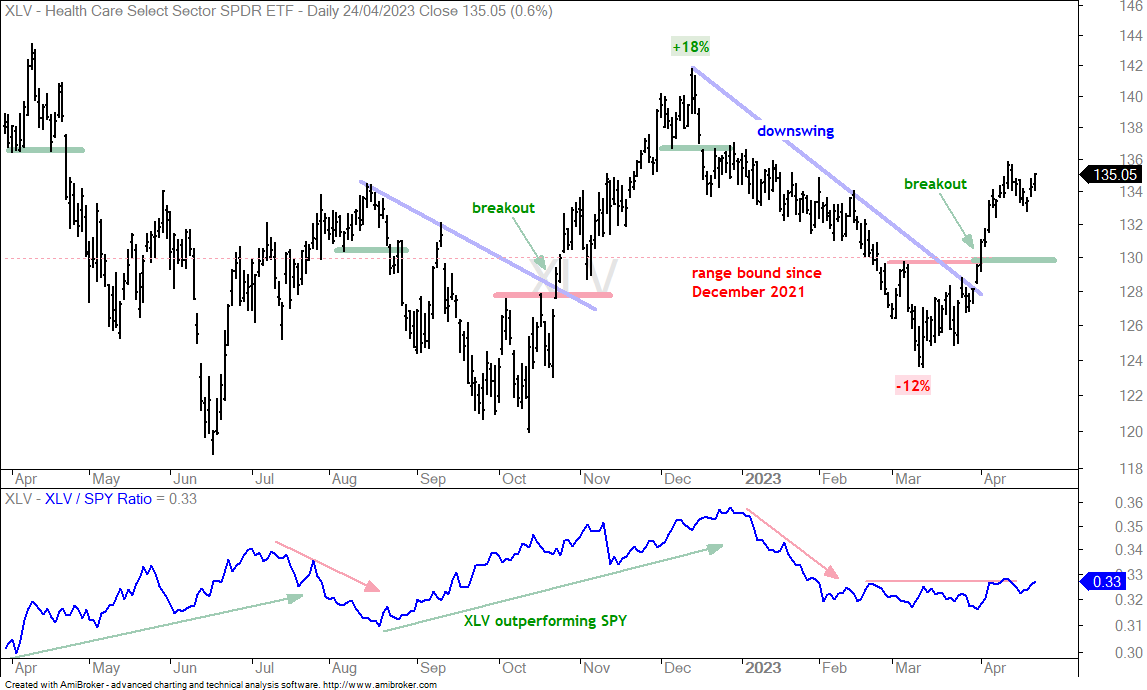
The next chart shows the Healthcare SPDR (XLV) with a breakout and strong extension above 135. The breakout zone around 130 turns first support, but we might not see a throwback to this area.

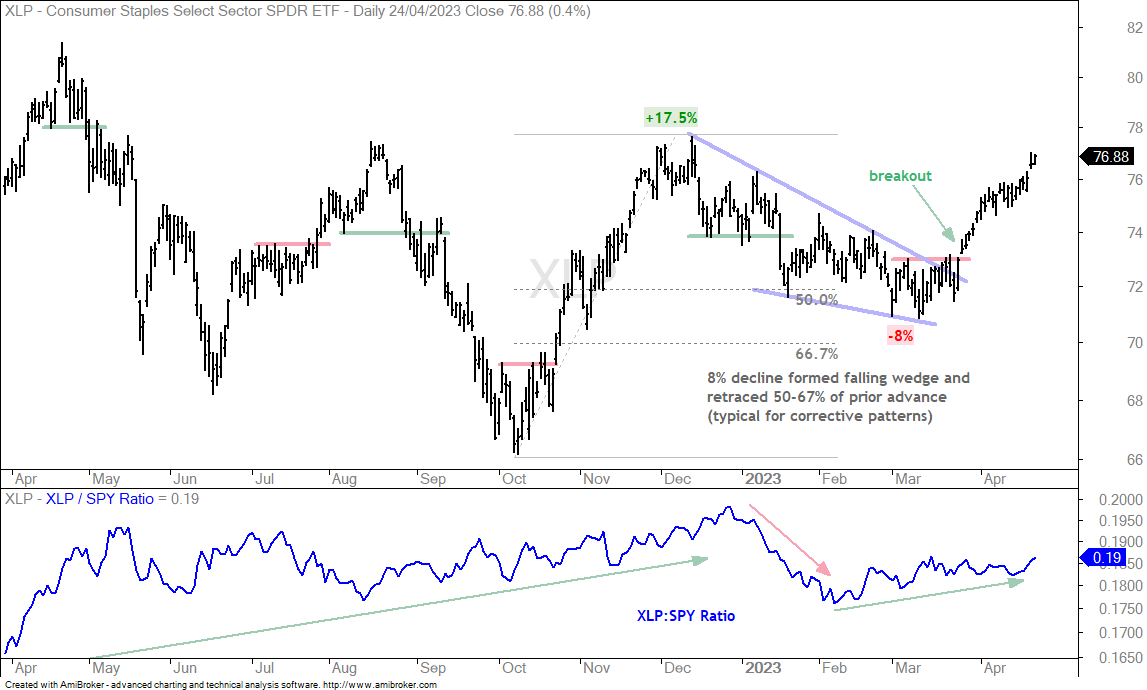
The next chart shows the Consumer Staples SPDR (XLP) with a breakout and strong extension.

The next chart shows the Utilities SPDR (XLU) with a breakout in early April.

Food&Bev Breaks Out as HC Providers Gets Throwback (PBJ,IHF)

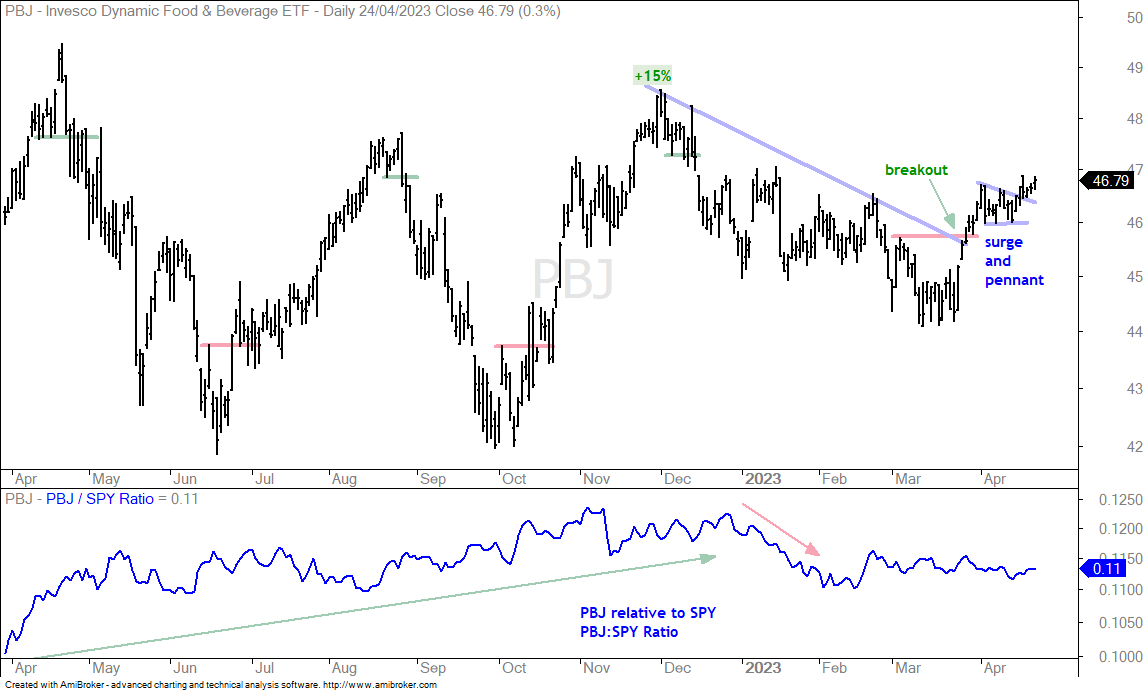
The Food & Beverage ETF (PBJ) is part of the Consumer Staples sector and its chart mimics XLP. PBJ broke out in late March, consolidated with a pennant into mid April and broke out of the pennant last week.

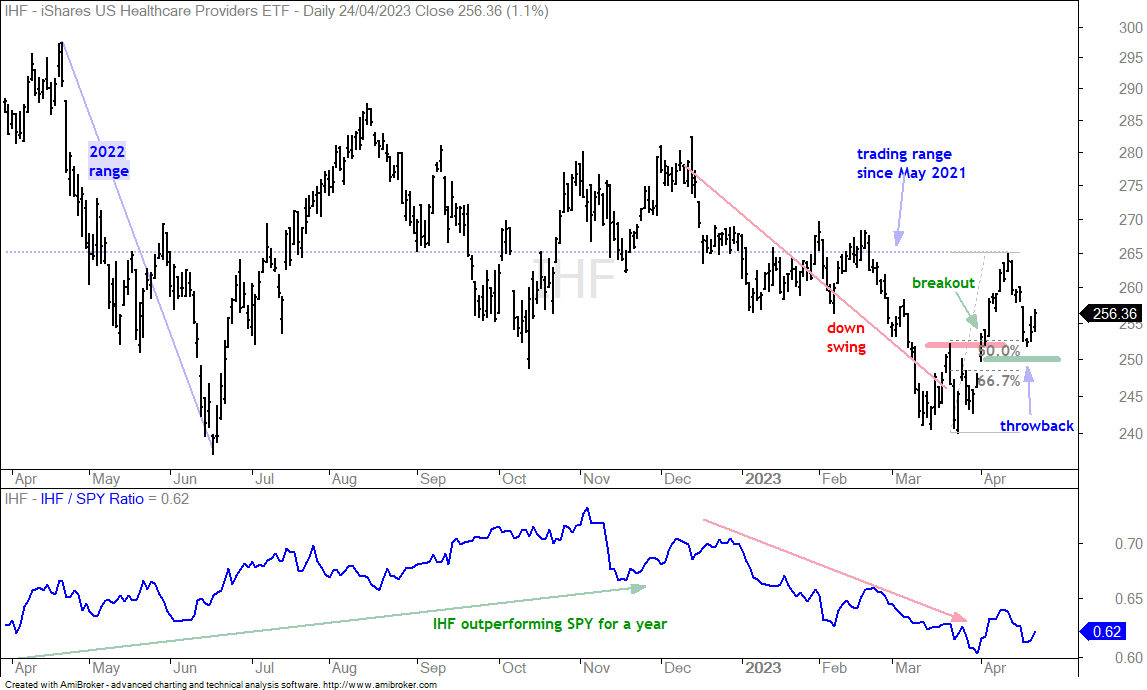
The next chart shows the Healthcare Providers ETF (IHF) with a hard throwback to the breakout zone. Broken resistance turns into the first support level and a decline back to the breakout zone is a throwback. This throwback offers traders a second chance to partake in the breakout. Also notice that this throwback retraced 50 to 67 percent of the prior surge. This amount is also normal for pullbacks within bigger uptrends.

Biotechs Stall after Breakout Extensions (IBB, XBI)

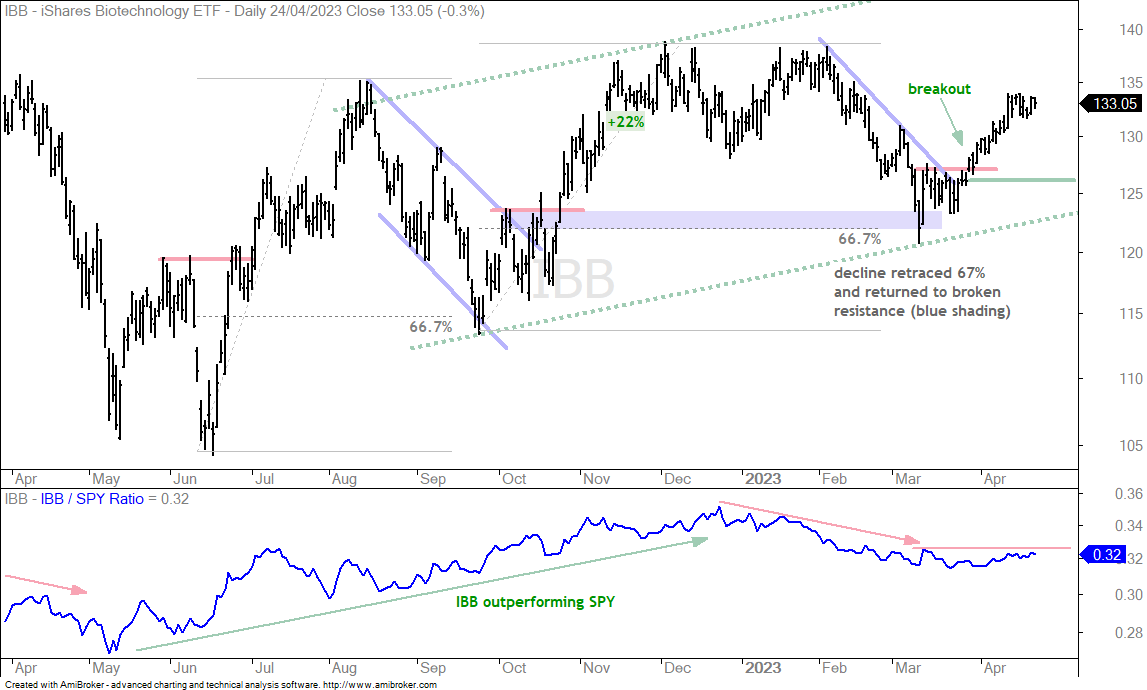
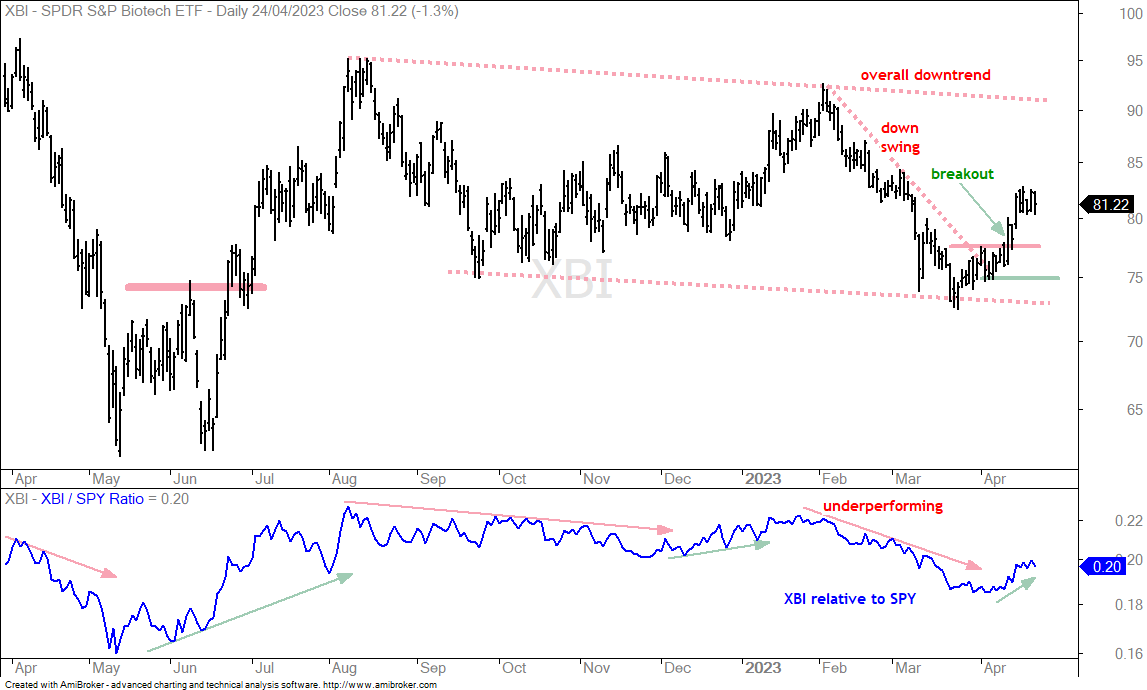
There is no setup in the biotech ETFs as the Biotech iShares (IBB) broke out in late March and the Biotech SPDR (XBI) broke out in mid April. IBB is stronger than XBI overall because it exceeded the August high in February and never broke the September low. The green dashed lines show a choppy uptrend. XBI still sports a downtrend with a lower high in February and lower low in March (red dashed lines). Despite differing long-term pictures, both are in short-term uptrends and showing some leadership in April. I do not see any setups right now.

High-Beta ETFs Continue to Lag (SPHB, ARKK)

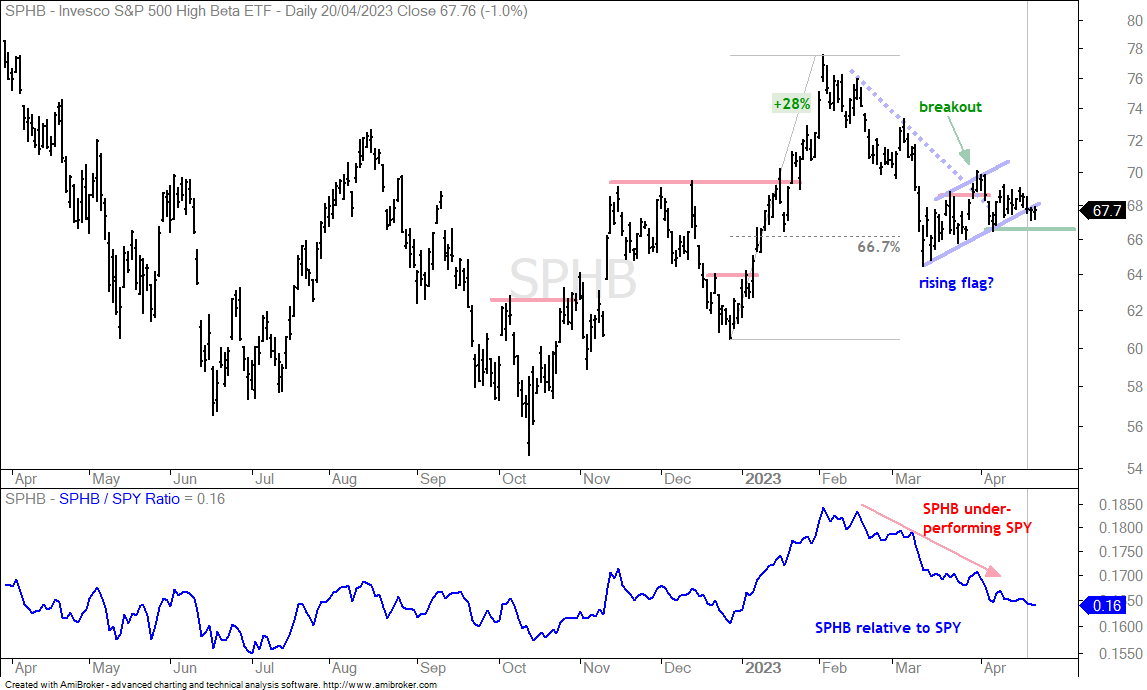
The S&P 500 High Beta ETF (SPHB) and the ARK Innovation ETF (ARKK) are lagging since February and continue to struggle here in April. These two ETFs represent the risk-on trade or the appetite for risk in the stock market. They led from late January to early February when the risk appetite was strong. They are lagging now and this means the appetite for risk is weak, which is not exactly positive for the broader market. The first chart shows SPHB with a rising flag and support marked at 67. The ETF edged below the lower trendline and a support break at 67 would complete the short-term reversal. This would signal a continuation lower.

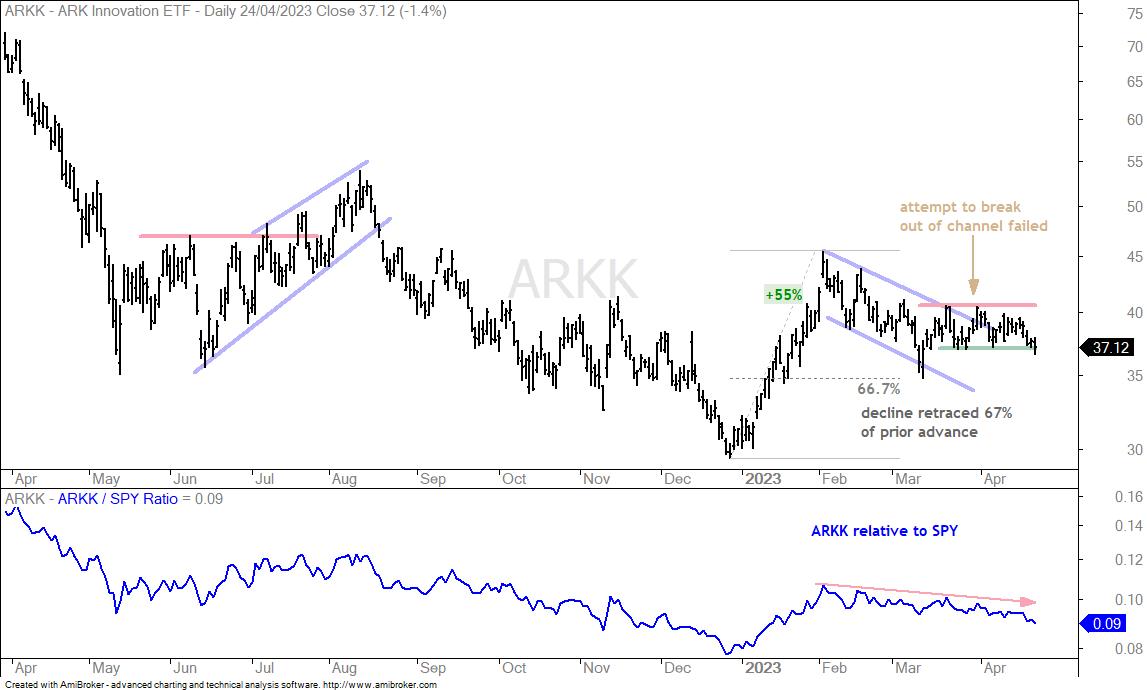
The next chart shows the ARK Innovation ETF (ARKK)  falling since early February. The ETF attempted a channel breakout in early April, but this breakout never gained traction as the ETF fell back into its range. ARKK is on the verge of breaking range support and continuing lower.

Tech Related ETFs Stumble (SOXX, IGV, SKYY, FDN, FINX)

Tech-relative ETFs are part of the high-beta trade because they also represent the appetite for risk. High-beta and tech-relative ETFs have a strong positive correlation, just as low-volatility and defensive ETFs. We are seeing strength in the low-volatility and defensive ETFs, and weakness in high-beta and tech-related ETFs.  There were breakouts in several tech-related ETFs in March and these ETFs then stalled in April.

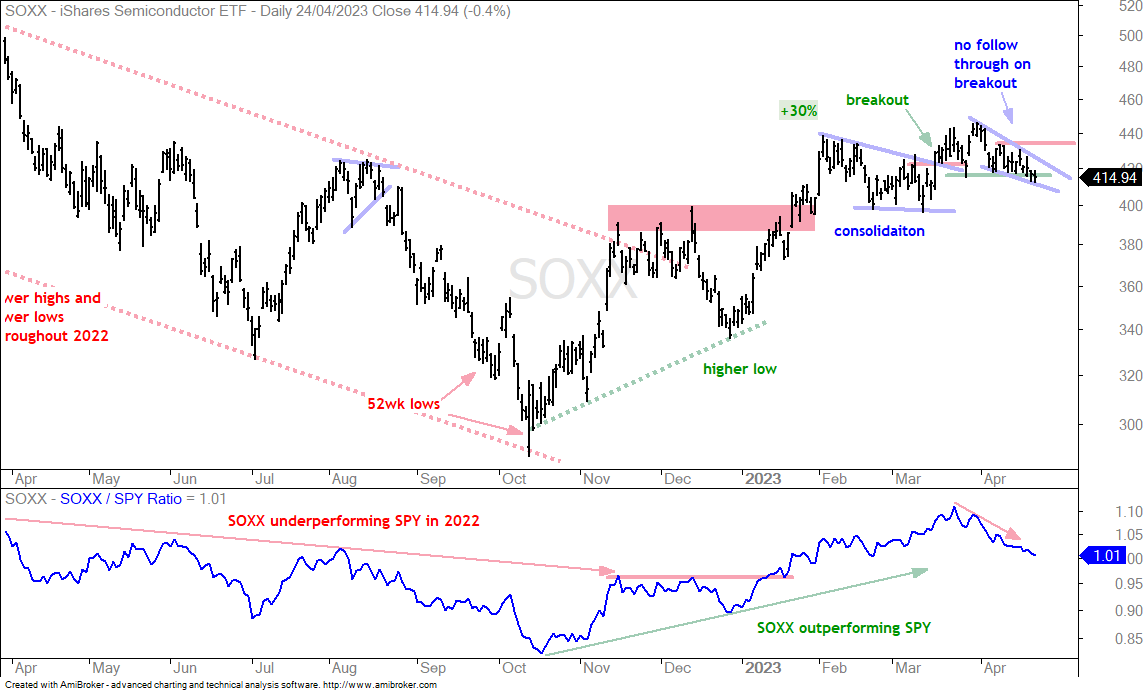
The first chart shows the Semiconductor ETF (SOXX) with a breakout in mid March and no follow through higher. Instead, SOXX broke below the late March low (415) and started underperforming in April. A falling wedge could be forming and the immediate trend is down as long as the wedge falls. A breakout at 434 is needed for a reversal here.

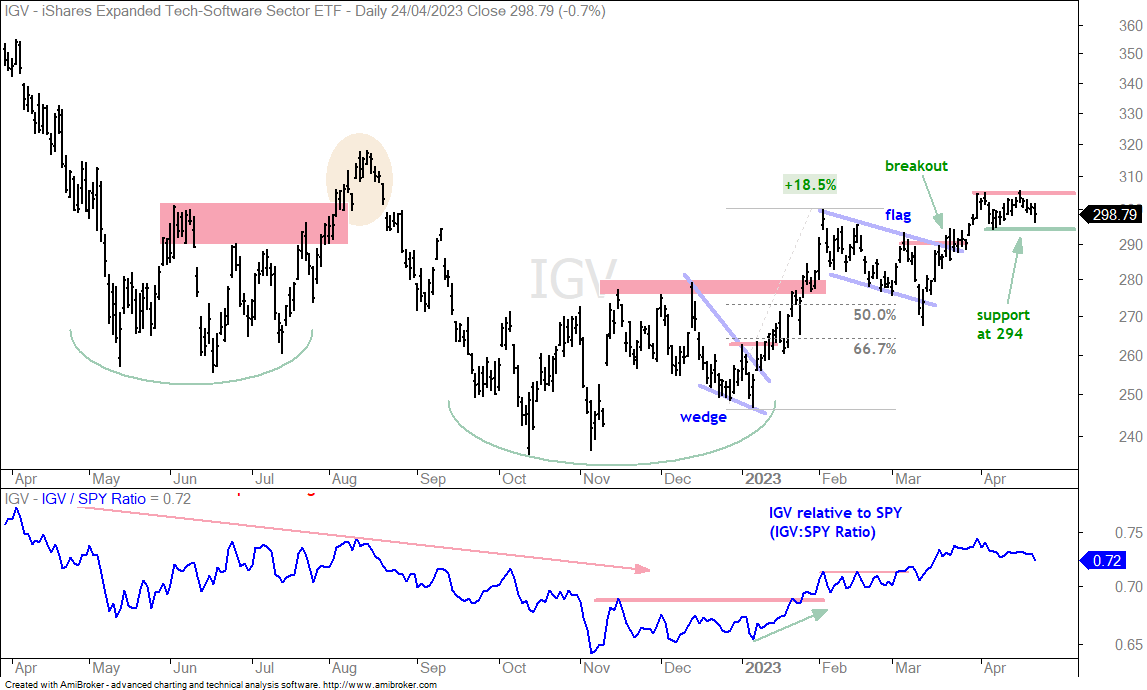
The next chart shows the Software ETF (IGV) with a flag breakout, extension above 300 and consolidation in April. A consolidation after a sharp advance is usually a bullish continuation pattern. A breakout at 305 would be bullish. The early April low marks first support and a break here would reverse the short-term uptrend.

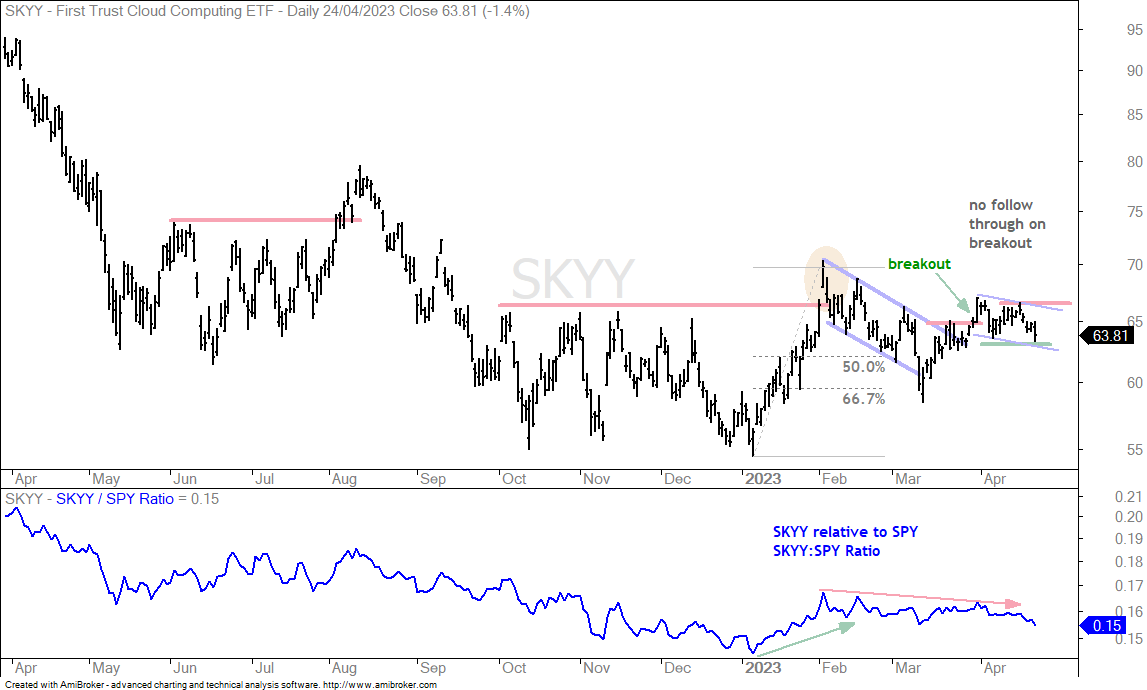
The Cloud Computing ETF (SKYY) broke out of a falling channel in the latter part of March and then fell back in April. The decline could be a falling flag and a breakout at 66.5 would be bullish. Support is set at 63 and a break here would negate the late March breakout.

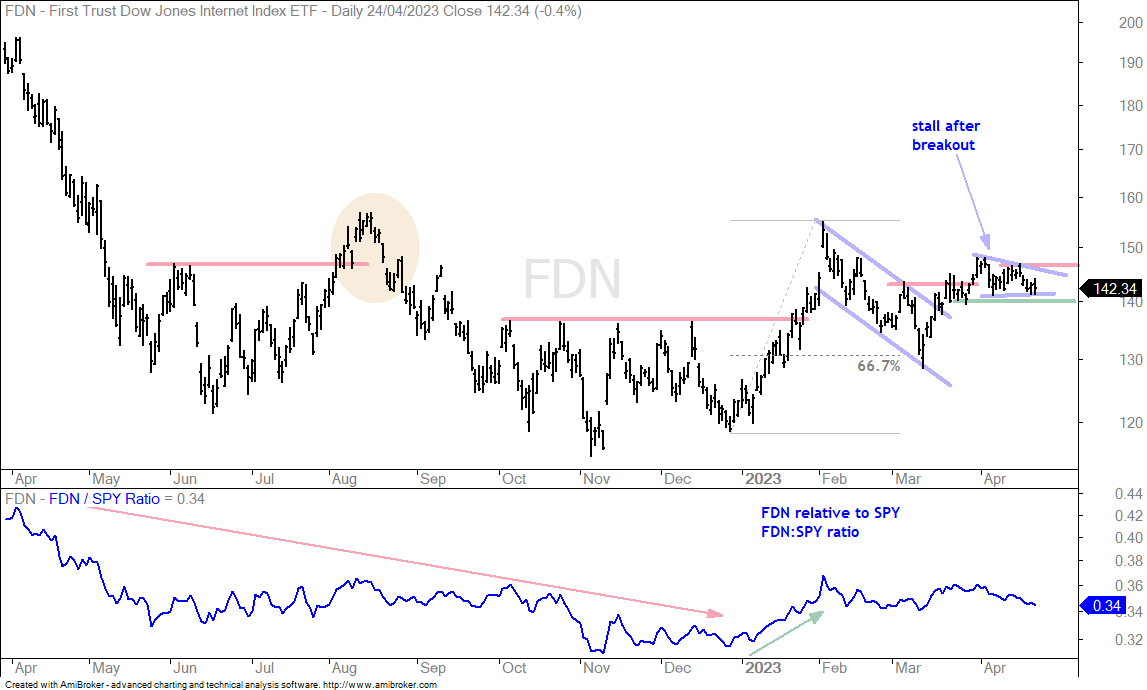
The Internet ETF (FDN) also broke out with a sharp advance from mid March to early April and stalled. A pennant could be forming with resistance at 146.5, a break of which would be bullish. Support is set at 140 and a break here would negate the March breakout.

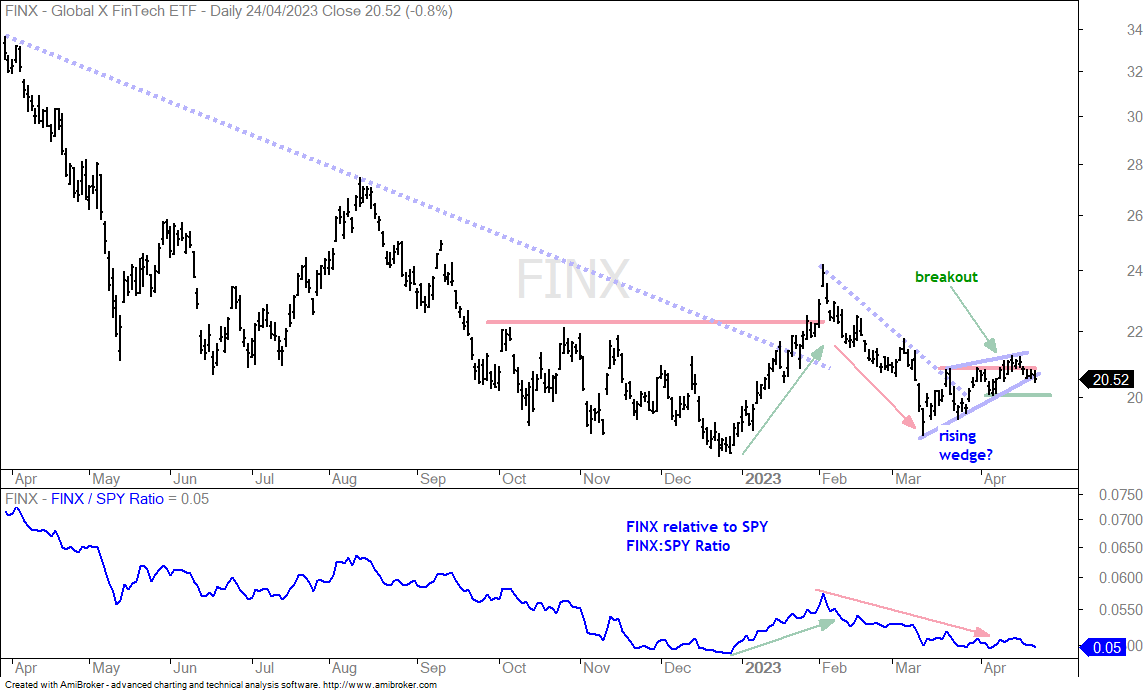
The FinTech ETF (FINX) broke out in mid April, but is struggling to hold this breakout as a rising wedge forms. A break below 20 would reverse the rising wedge and signal a resumption of the February-March decline.

Thanks for tuning in and have a great day!
Scroll to Top