About the ETF Trends, Patterns and Setups Report
This report contains discretionary chart analysis based on my interpretation of the price charts. This is different from the fully systematic approach in the Trend Composite strategy series. In this ETF Trends, Patterns and Setups report, I am looking for leading uptrends and tradable setups within these uptrends. While I use indicators to help define the trend and identify oversold conditions within uptrends, the assessments are mostly based on price action and the price chart (higher highs, higher lows, patterns in play). Sometimes the chart assessment can be at odds with the indicators.
Report Schedule
- Tuesday – 11-Apr: Market/ETF Report
- Wednesday –12-Apr: Market/ETF Video
- Thursday – 13-Apr: Strategy Update or Article
Systematic Strategies and Tables
Here are the three active strategies and their respective tables.
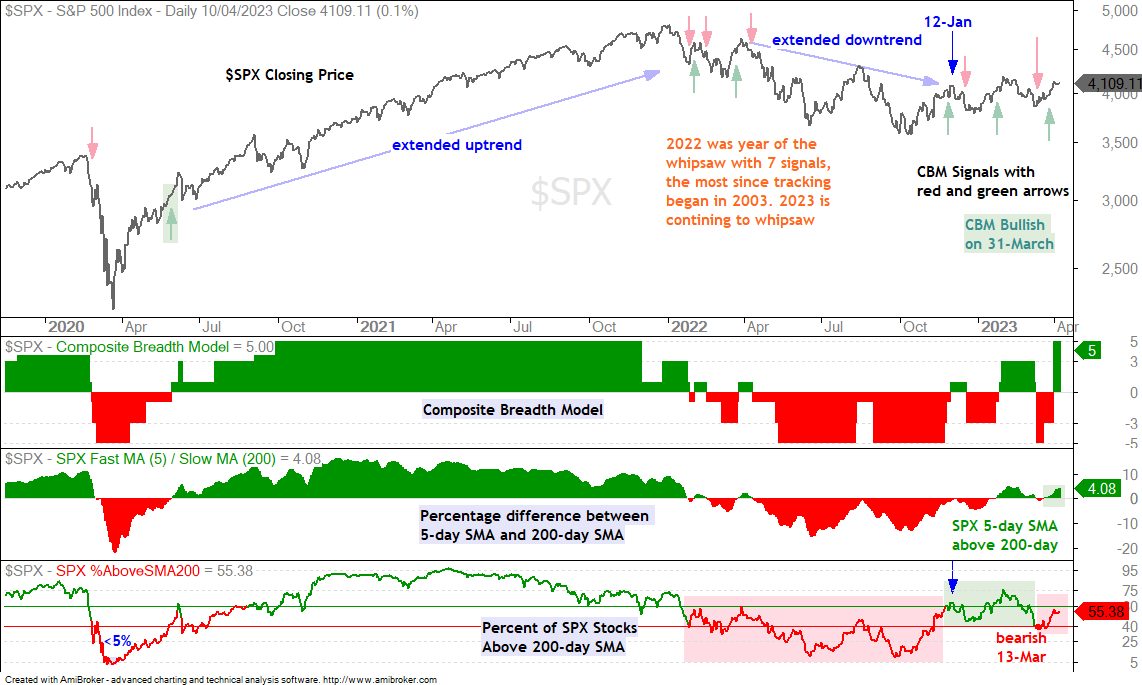
Market Regime is Bullish for Stocks
The Composite Breadth Model remains at +5 and net bullish. The 5-day SMA for the S&P 500 is above the 200-day SMA and some 55% of S&P 500 stocks are above their 200-day SMAs. Even though the CBM is at +5, which is its max, this is not a broad bull market that is lifting all boats. Small-caps continue to lag with just 43% of S&P SmallCap 600 stocks above their 200-day SMAs.
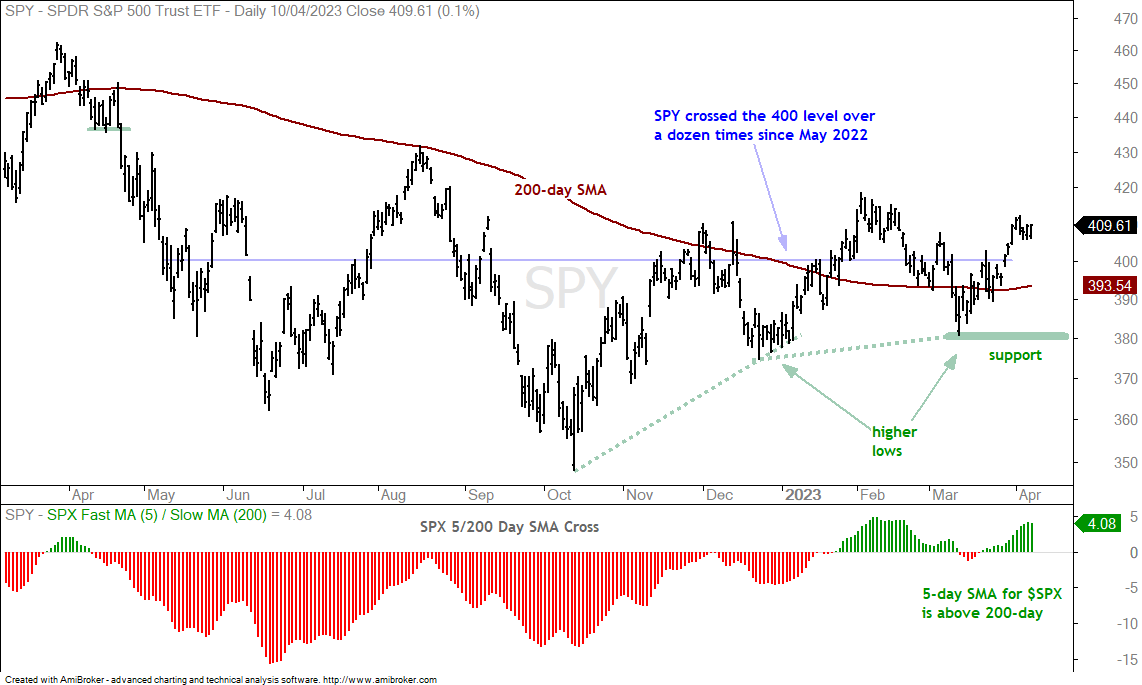
SPY is in a Choppy Uptrend
The next chart shows SPY in an uptrend the last few months with a higher low in December and a higher high in early February. Despite an uptrend overall, price action remains very choppy since May as SPY oscillates above/below the 400 level (blue line). The March low is the most recent reaction low (trough) and this low marks key support. A break here would reverse the overall uptrend.
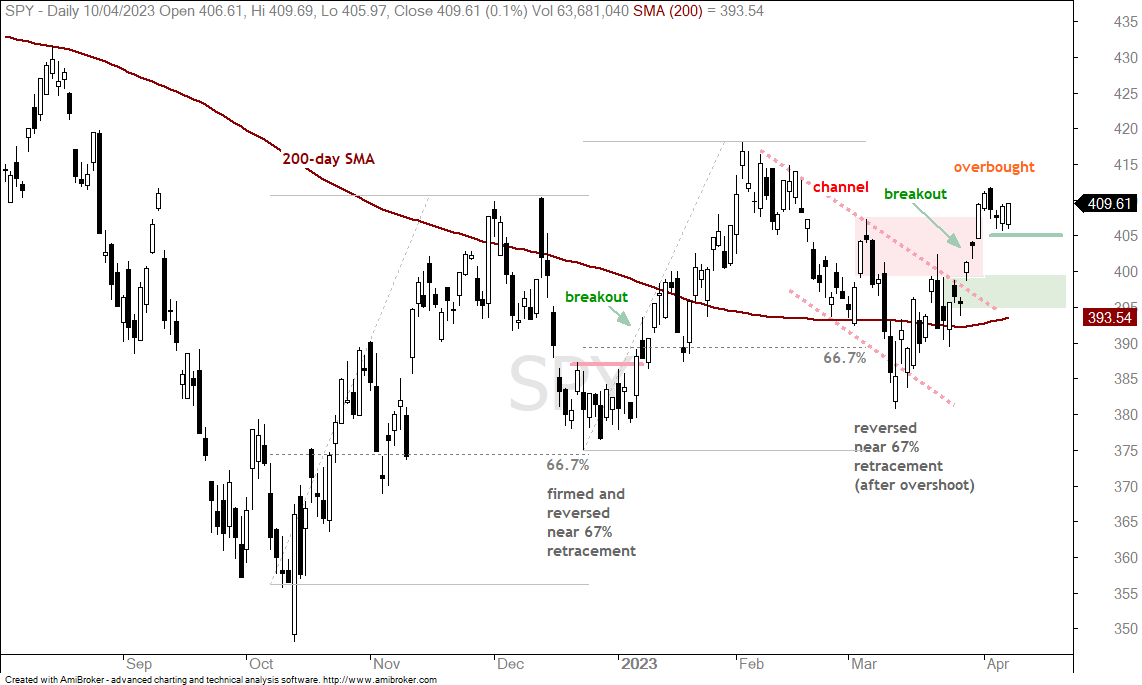
Short-term Overbought Conditions Warrant Caution (SPY)
The next chart shows candlesticks for SPY and a breakout surge from 14-March to 3-April. SPY became overbought in the 410 area and stalled the last four days. There is no setup here because the ETF is short-term overbought. Keep in mind that SPY is in a choppy uptrend at best and this means risk of a pullback is above average when short-term overbought. I am marking short-term support at 405 and a break here would reverse the short-term upswing. The green shading marks the next support zone in the 395-400 area. This is the breakout zone and broken resistance turns first support. The 200-day SMA is also turning up and should be in this zone in a few days.
High-quality versus High-beta ETF (SPHQ, SPHB)
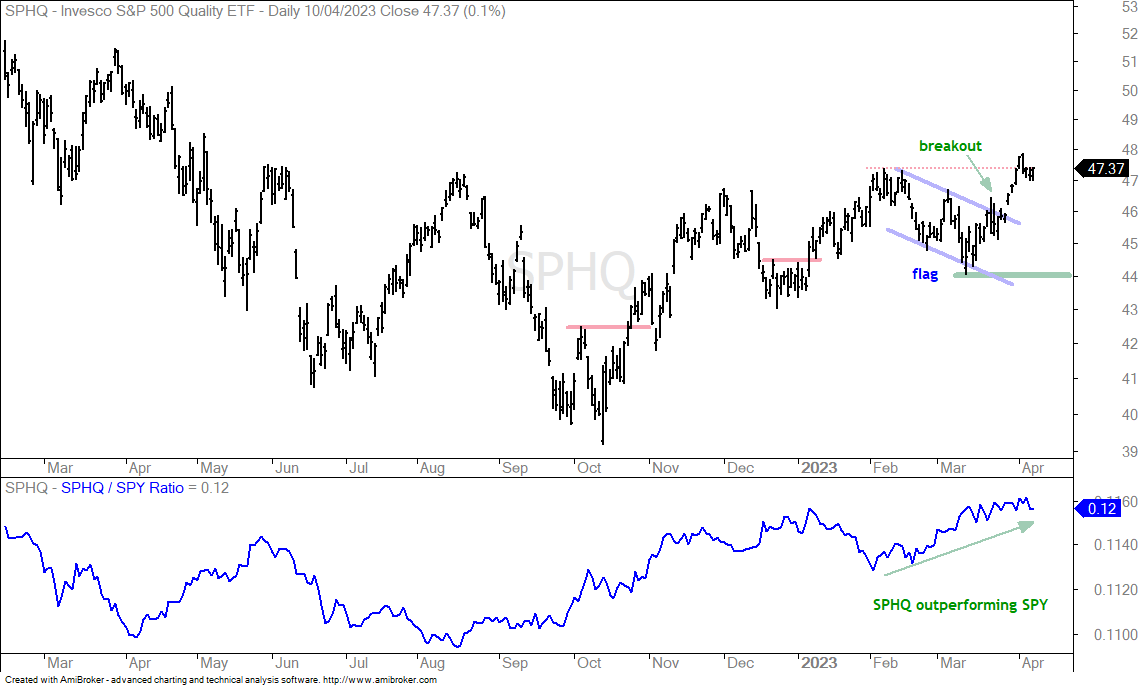
The S&P 500 High-Quality ETF (SPHQ) shows that the highest quality stocks are leading the market right now. Notice that SPHQ exceeded its early February high last Monday (red dotted line). SPY, in contrast, has yet to exceed this high. According to Invesco.com, “The (high-quality) index tracks the performance of stocks in the S&P 500 that have the highest quality score, which is calculated based on three fundamental measures, return on equity, accruals ratio and financial leverage ratio”. Relative strength in SPHQ suggests that the best of the best are leading this advance.
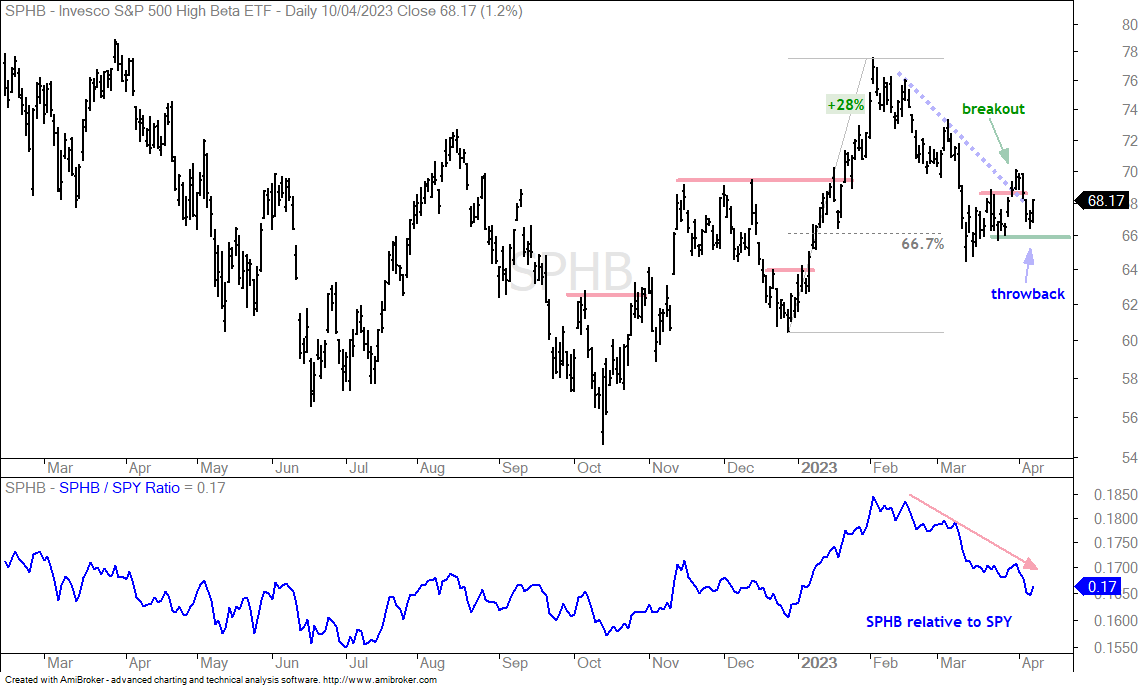
The next chart shows the S&P 500 High-beta ETF (SPHB) with a much different chart, but a bullish setup in the making. According to Invesco.com, SPHB “consists of the 100 stocks from the S&P 500 with the highest sensitivity to market movements, or beta, over the past 12 months”. These are the stocks we want to own during a bull market that lifts all boats. Even though the current bull market is selective, the chart shows SPHB with a bullish setup and breakout. The ETF surged 28% and exceeded the December-August highs. It retraced around 2/3 with a decline into mid March. SPHB then broke short-term resistance on March 31st and there was a sharp throwback last week. The ETF bounced on Monday and I am marking support at 66. A close below 66 would negate the breakout and be bearish.
Watching ARKK for Clues on High-beta Trade (ARKK)
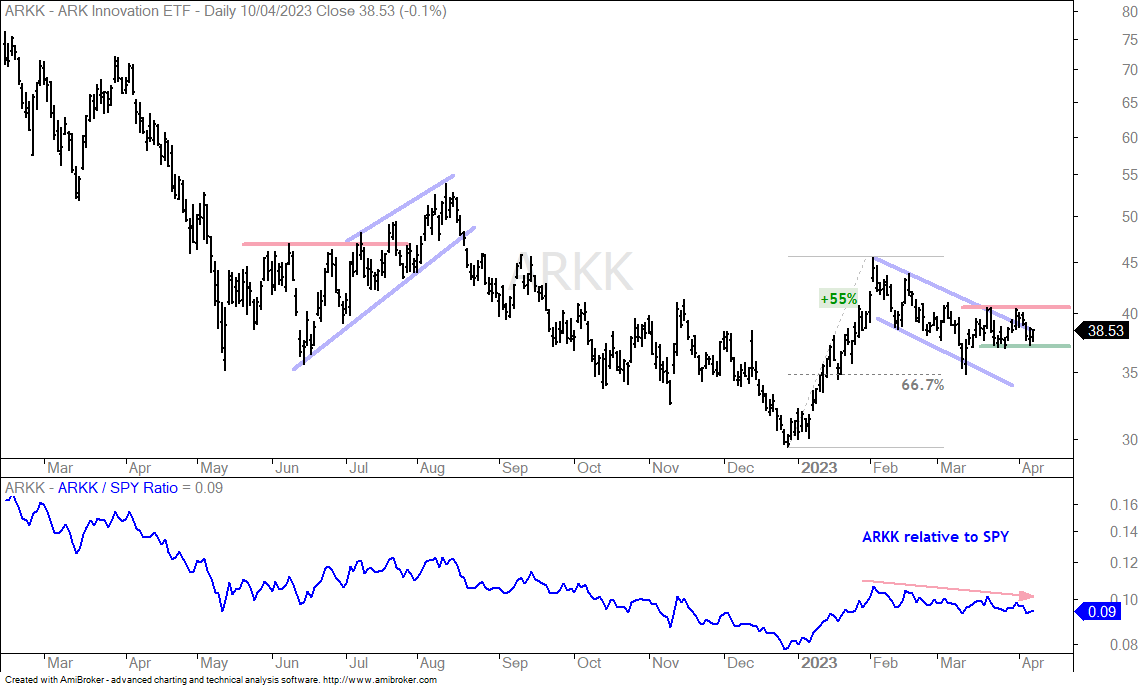
The ARK Innovation ETF (ARKK) is an ETF that comes to mind when we think high-beta. This ETF was the darling of the stock market from mid March 2020 until mid February 2021 with a 365% advance. The ETF then fell into December 2022 and broke the March 2020 low (a complete round trip). Short-term, ARKK surged 55% into February and then retraced 2/3 of this advance with a decline to around 35. A falling flag/channel formed and the ETF is attempting a breakout. ARKK stalled the last few weeks and I am watching these boundaries for the next directional blue. An upside breakout at 41 would be bullish and show an increase in risk appetite, while a downside break at 37 would be bearish and show risk aversion.
XLK and QQQ Lead, but Are Short-term Overbought
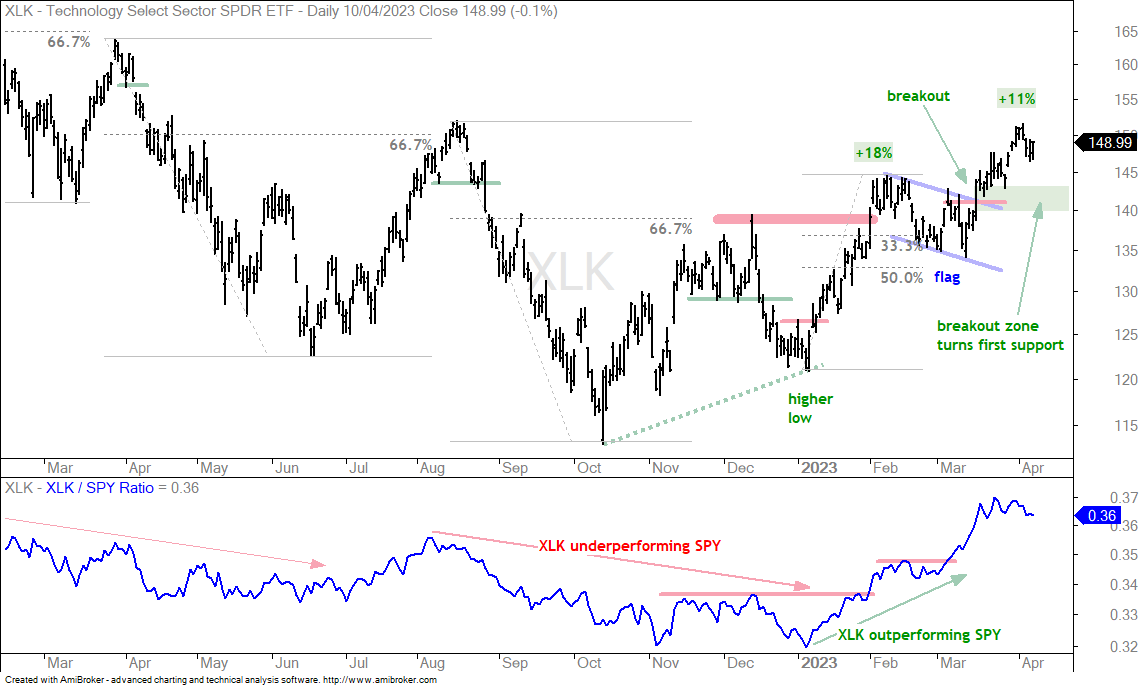
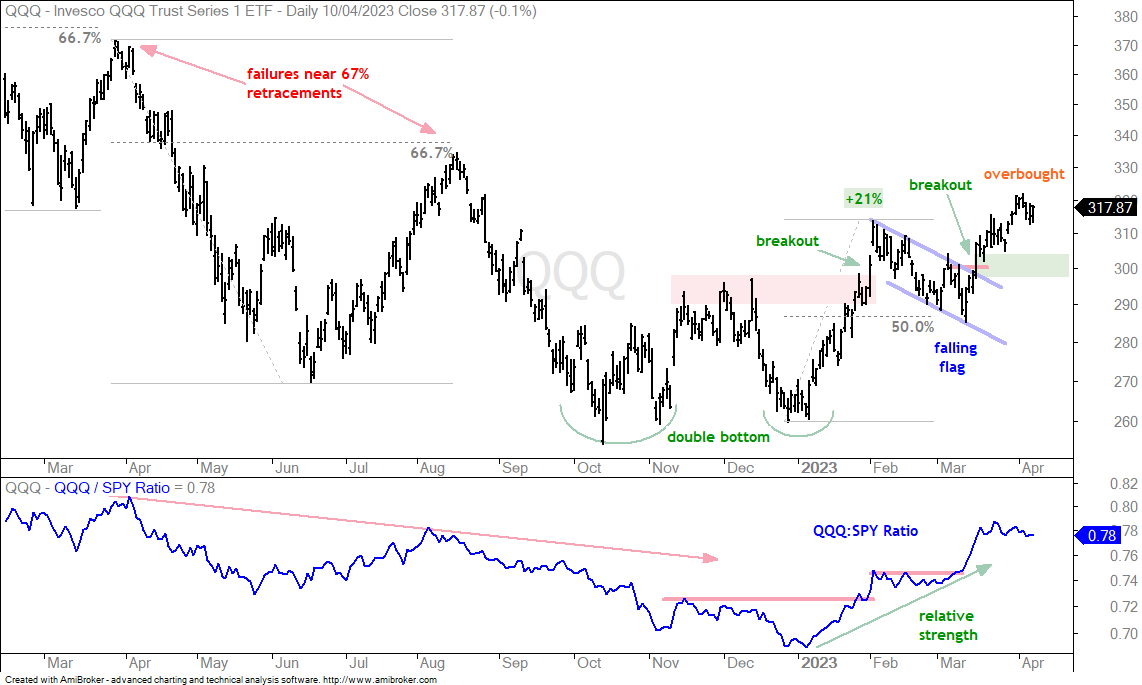
The Technology SPDR (XLK) and the Nasdaq 100 ETF (QQQ) also represent the high-beta trade. Large-caps dominate these two because they are weighted by market cap. I would also suggest that XLK and QQQ represent the high-quality end of the high-beta trade. ARKK and SPHB, in contrast, represent the more speculative end of the high-beta trade. The charts show XLK and QQQ surging from mid March to early April and becoming short-term overbought last week. The mid March breakouts are bullish, but there are no setups on these charts because they are short-term overbought. The green shading marks the first support zone to watch should we see a pullback. This is classic technical analysis in that broken resistance turns first support. A move to the green zones would also retrace around 50% of the prior advance (mid March to early April).
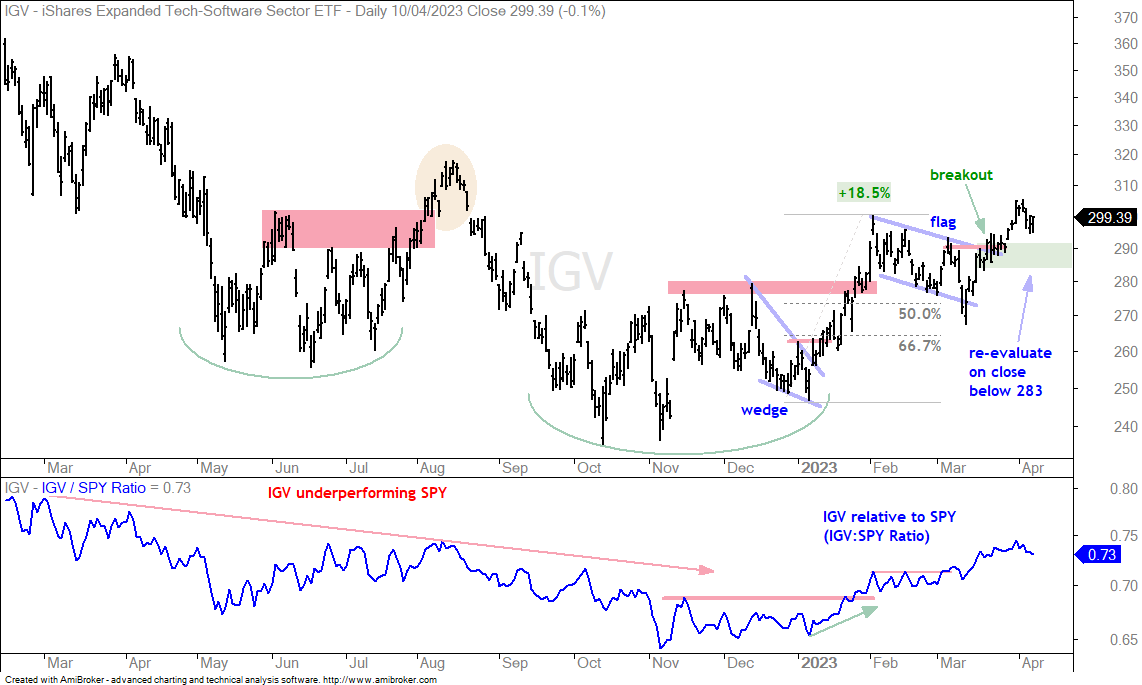
Semis Stall as Software Extends (SOXX, IGV)
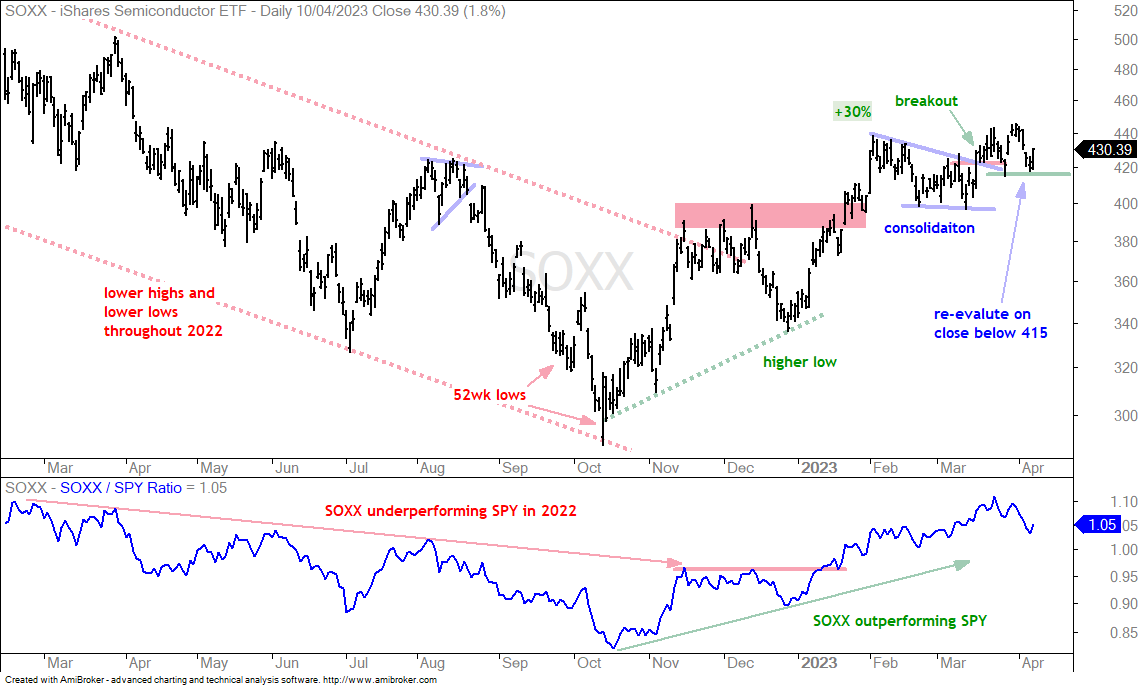
The next chart shows the Semiconductor ETF (SOXX) battling to hold its breakout. The ETF surged 30%, consolidated and broke out in mid March. In contrast to XLK and QQQ, SOXX did not follow through on this breakout and continues to test the 420 area with throwbacks. The cup is half full because the breakout is holding for the most part. A close below 415 would negate the breakout and argue for a re-evaluation.
Breakout and Hard Throwback for Housing and Retail (ITB, XRT)
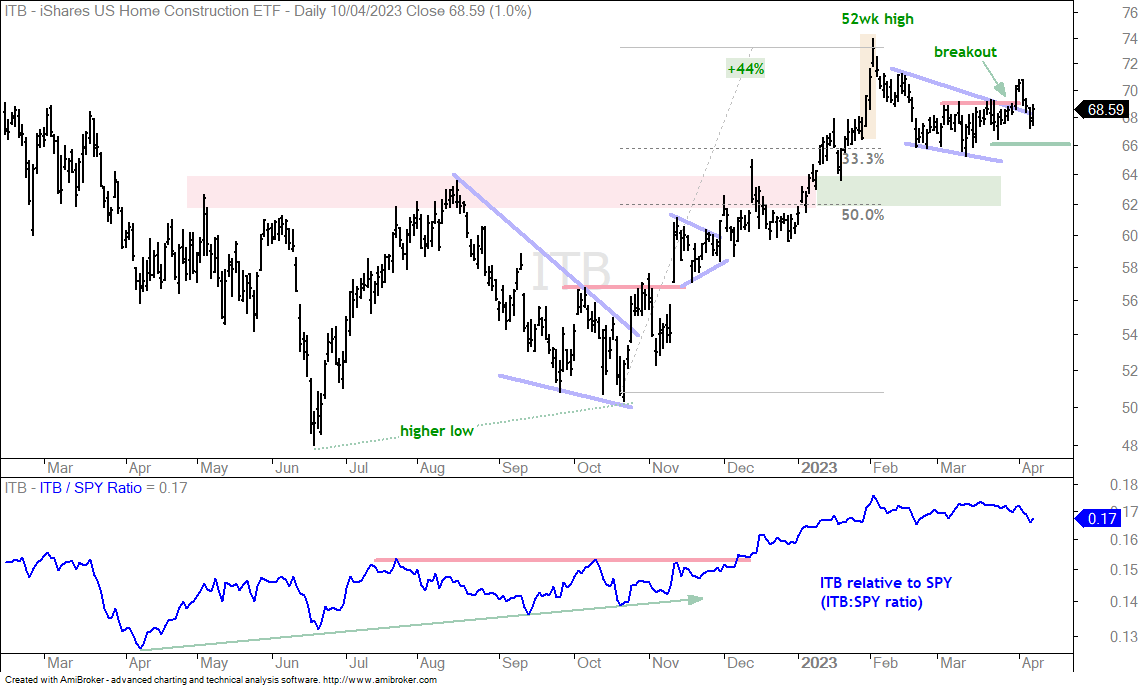
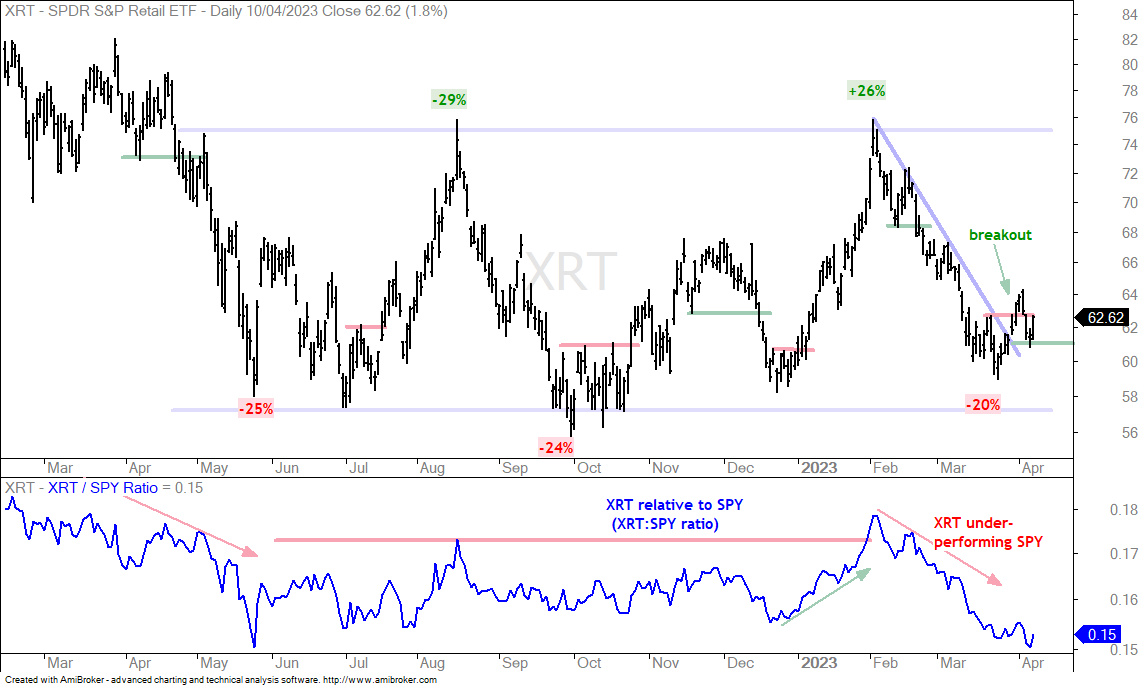
The charts for the Home Construction ETF (ITB) and the Retail SPDR (XRT) are very different long-term, but show short-term breakouts with hard throwbacks last week. First, ITB is a leader and in a long-term uptrend. The ETF hit a 52-week high in early February and corrected with a pullback/consolidation into March. ITB broke out on March 31st and then fell back sharply last week. The ETF bounced on Monday with a 2.8% gain. It is important to allow a little wiggle room on a breakout to account for short-term volatility. I identified a dip to the 66 area in late March and marked short-term support here. I will consider the breakout valid as long as this level holds.
The Retail SPDR (XRT) has been range bound since May with support in the 56-60 area and resistance in the 75 area. XRT fell to the support zone in March with a sharp decline and reversed this downswing with a breakout surge into early April. The ETF fell back pretty hard last week and then bounced with a 2.6% gain on Monday. Again, I am allowing a little wiggle room on the breakout and will accept a three day throwback after a seven day surge. With Monday’s bounce, I am raising my re-evaluation level to 61. A close below this level would erase Monday’s bounce and show weakness.
Water Resources ETF with Hard Throwback (PHO, CGW)
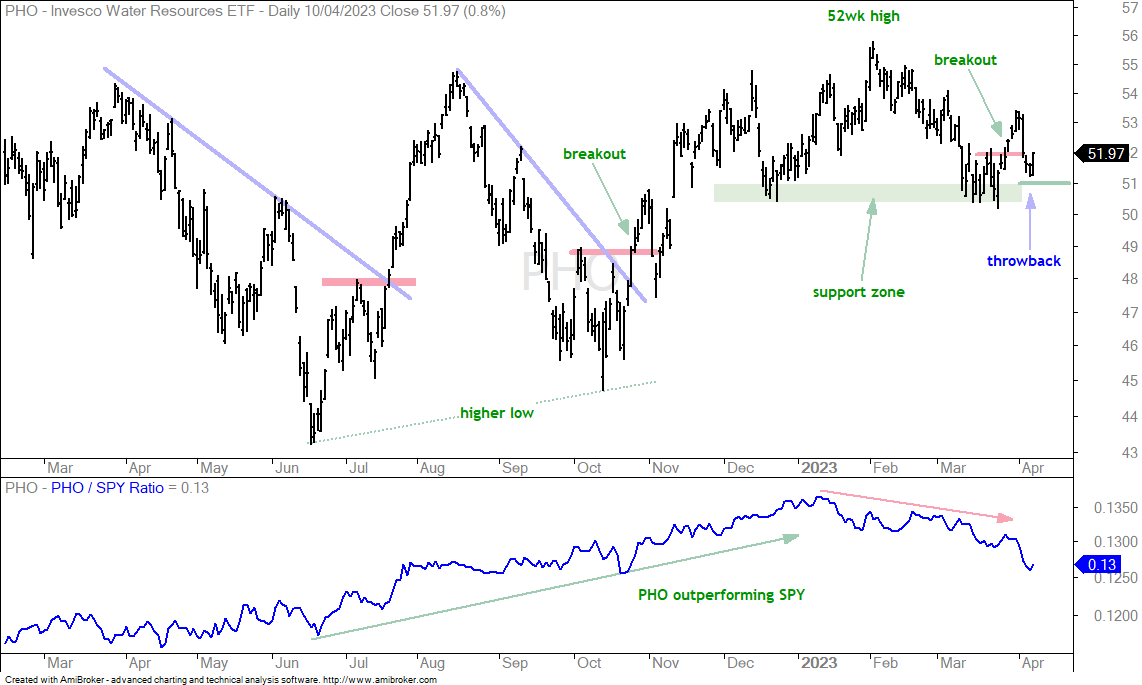
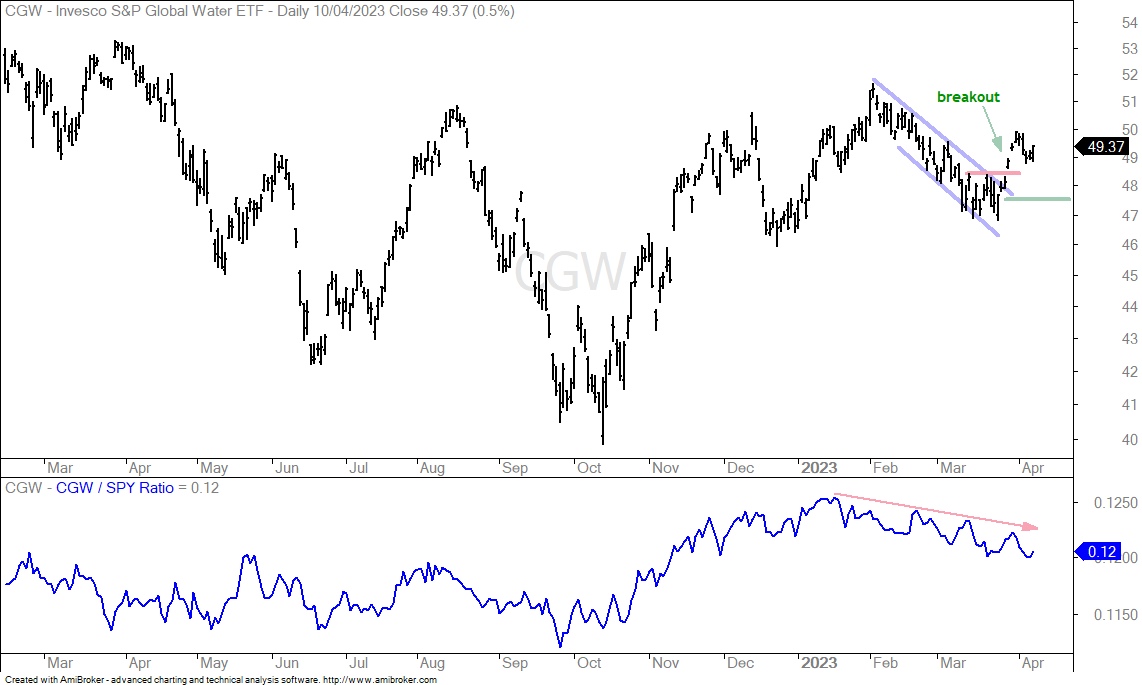
The Water Resources ETF (PHO) is one of the stronger ETFs over the last nine to twelve months, but a laggard in 2023. The chart shows PHO hitting a new high in early February and then falling to the 50-51 area in mid March. PHO firmed for two weeks and broke out, but then fell back below 52 with a hard throwback last week. PHO found its footing again on Monday with a bounce and this affirms the re-evaluation level at 51. A close below this level would negate the breakout and call for a re-evaluation.
Breakouts in Defensive ETFs (SPLV, XLV, IHF, XLP, PBJ, XLU)
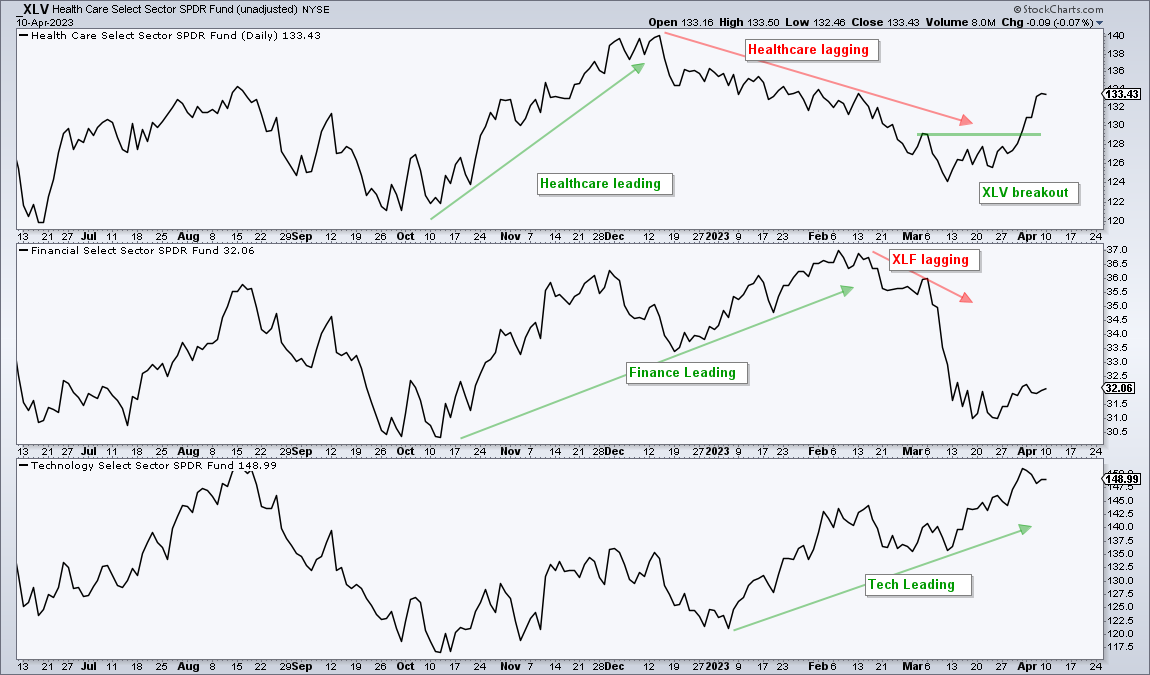
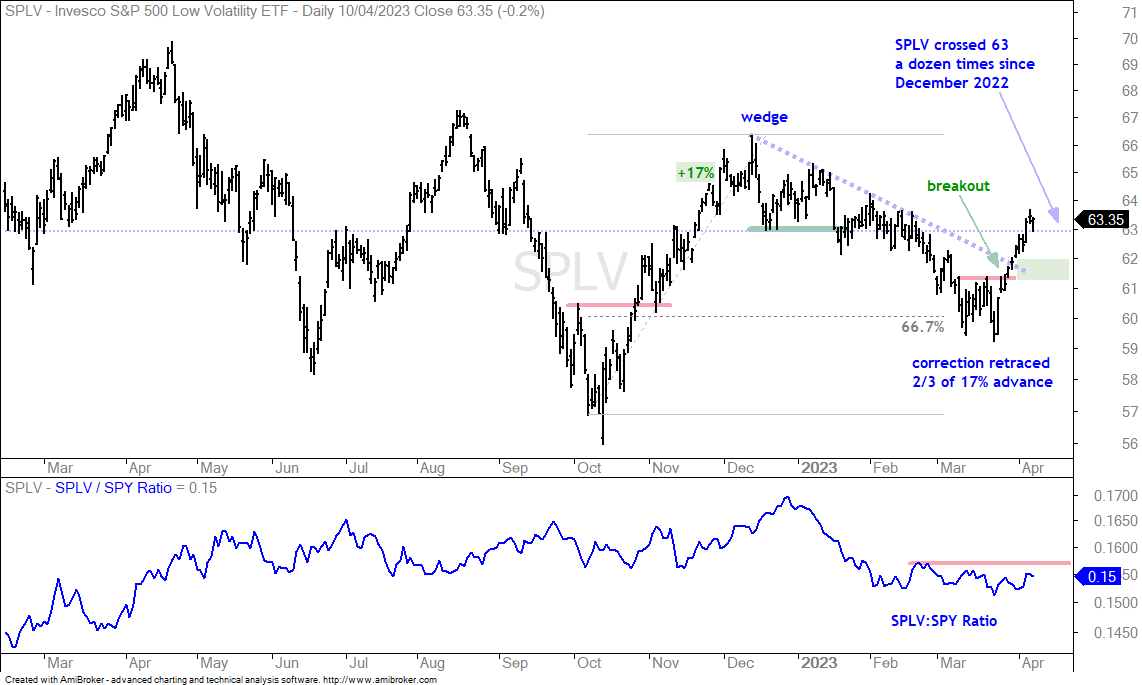
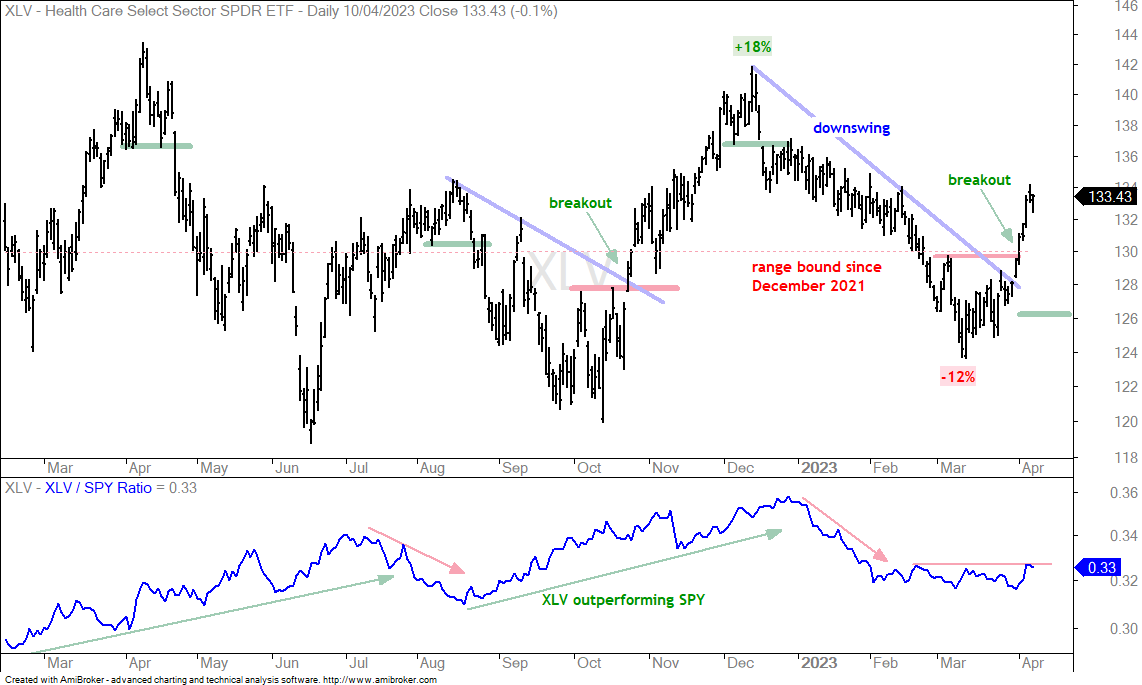
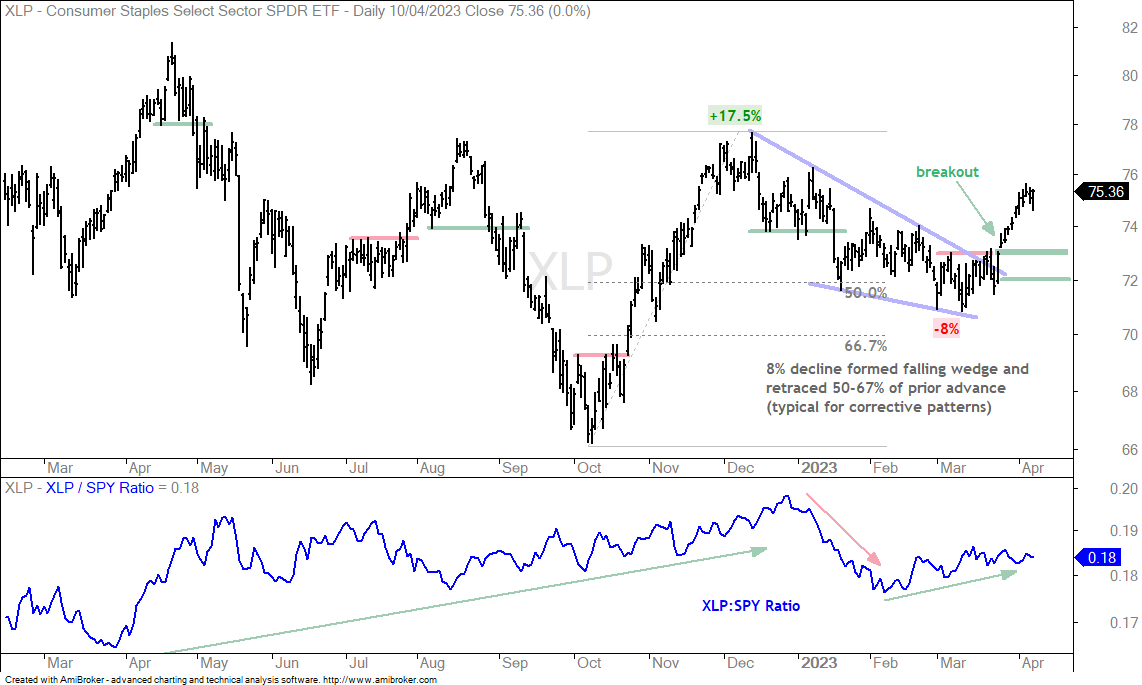
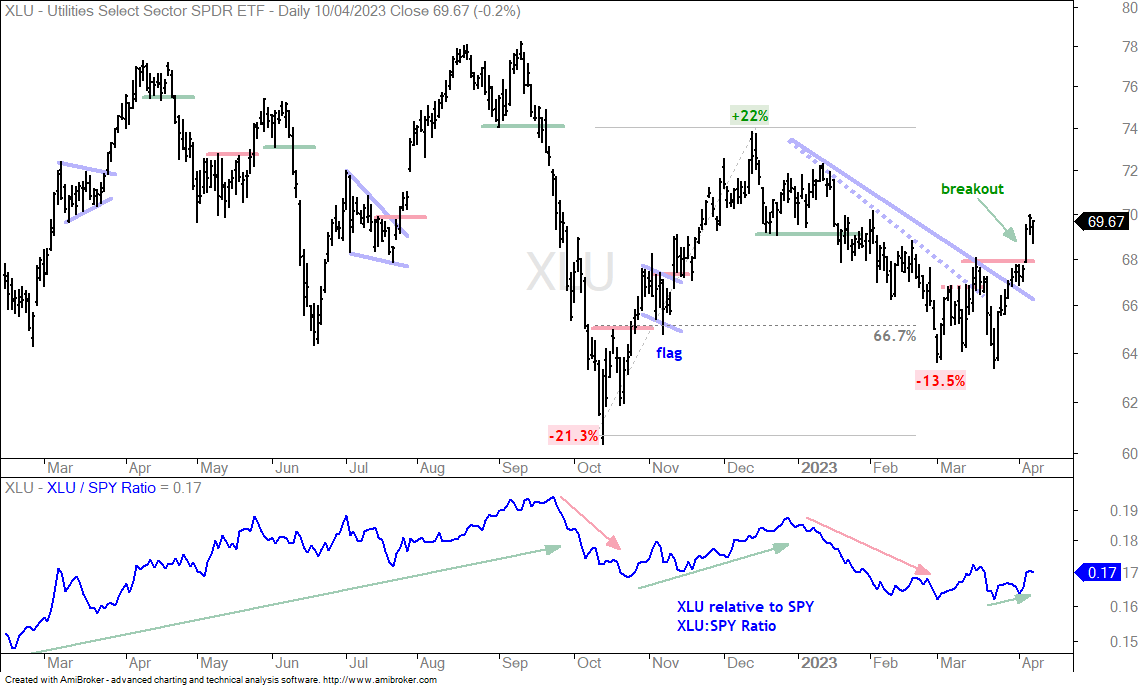
The defensive ETFs have a strong positive correlation, which means they tend to move in the same direction. These include the S&P 500 Low-volatility ETF (SPLV), Healthcare SPDR (XLV), Healthcare Providers ETF (IHF), Consumer Staples SPDR (XLP), Food & Beverage ETF (PBJ) and Utilities SPDR (XLU). All six ETFs are in long-term trading ranges or slight downtrends the last 15+ months. They led the market higher from mid October to mid December and then lagged the market from mid December to March. They were in downtrends during this period and broke out with surges the last few weeks. They are not outperforming SPY, but these breakouts are bullish and I am seeing money return to the defensive areas of the market. SPLV represents a good cross-section of the defensive groups because it is dominated by Utilities (23.84%), Consumer Staples (22.51%), Healthcare (19.74%) and Financials (14.67%). The chart below shows SPLV with a breakout in late March and follow through in early April. It is short-term overbought right now and the breakout zone turns first support to watch should we see a throwback.
Biotech iShares Extends on Breakout (IBB)
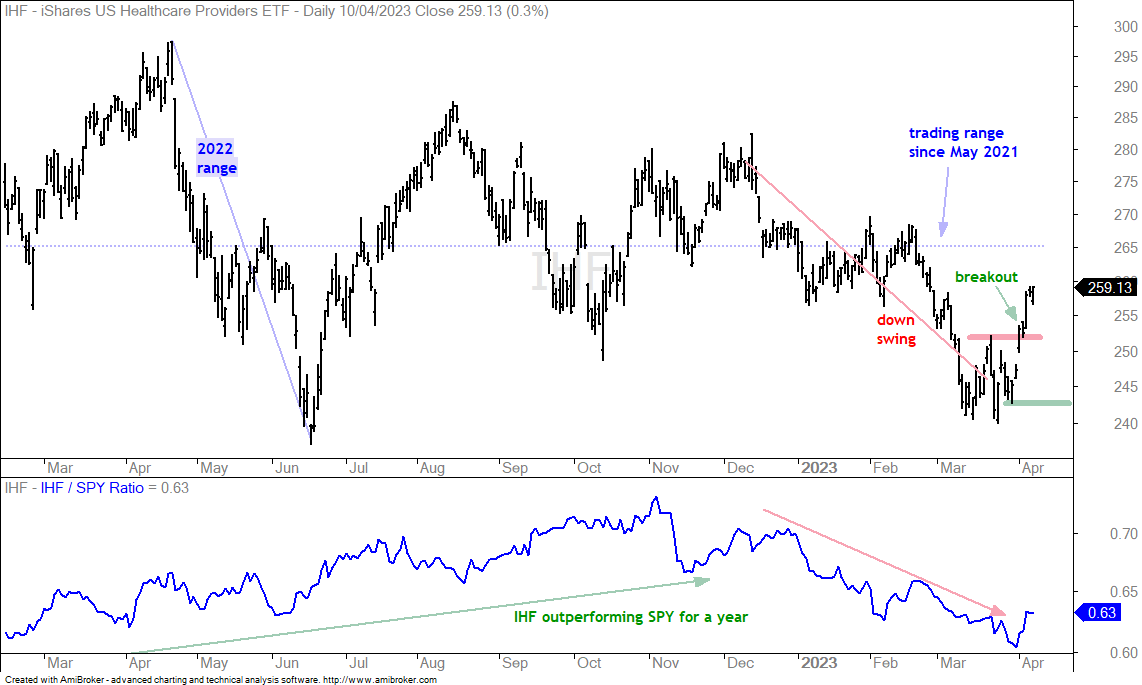
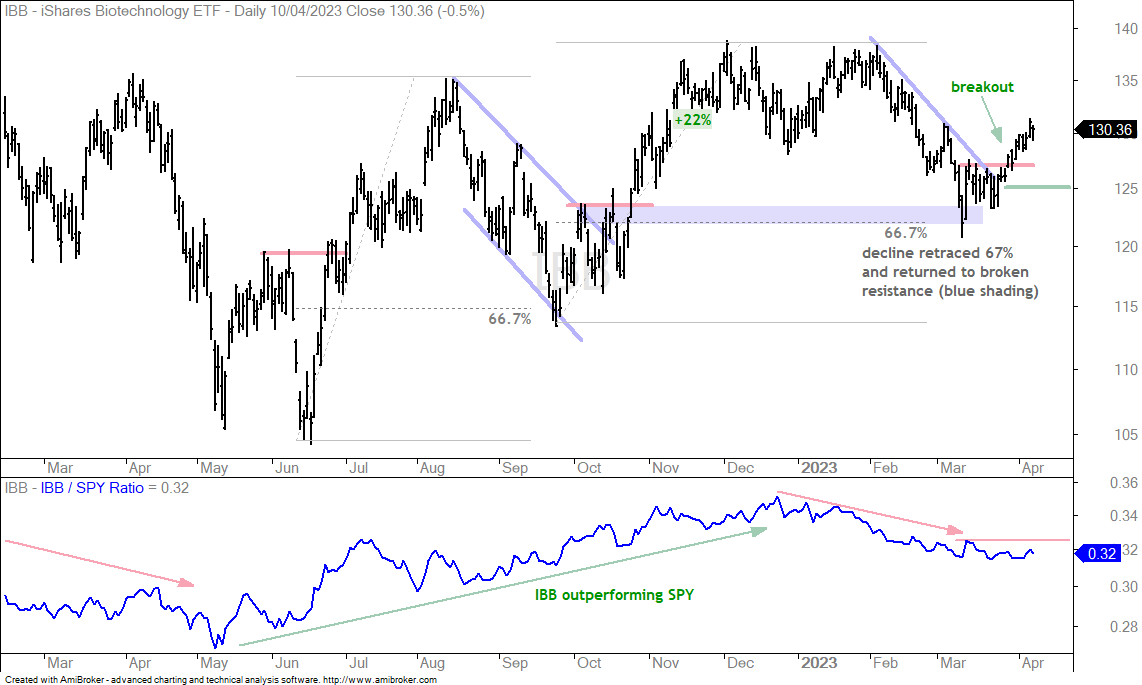
The Biotech ETF (IBB) and Healthcare Providers ETF (IHF) are helping the Healthcare SPDR (XLV) with breakouts of their own. The first chart shows IBB retracing 67% of the 22% advance with a return to broken resistance (blue shading). The ETF firmed in the 125 area in mid March and broke out with a surge in late March. IBB extended after this breakout and remains bullish. A close below 125 would argue for a re-evaluation.
Dollar Remains in Downswing
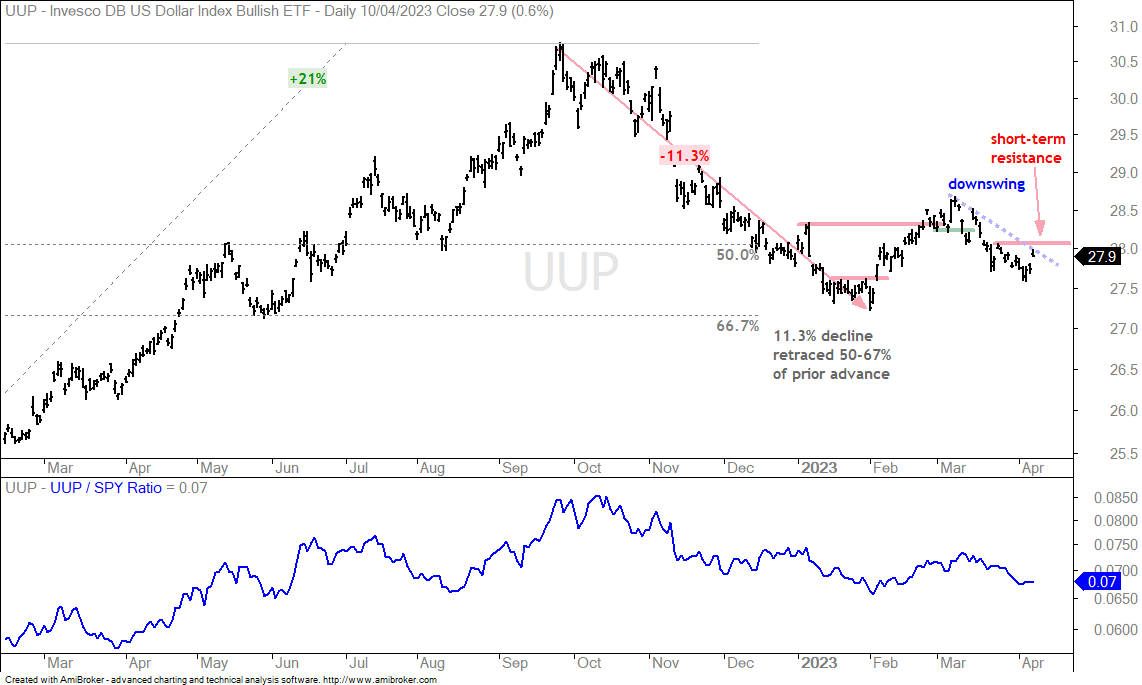
The Dollar Bullish ETF (UUP) remains in a downswing since the short-term support break on March 13th and this is positive for gold. UUP bounced the last three days, but remains short of a breakout. Resistance is set at 28.10 and a close above this level would trigger a breakout, which could weigh on gold.
20+ Yr Treasury Bond ETF Remains Short of Breakout (TLT)
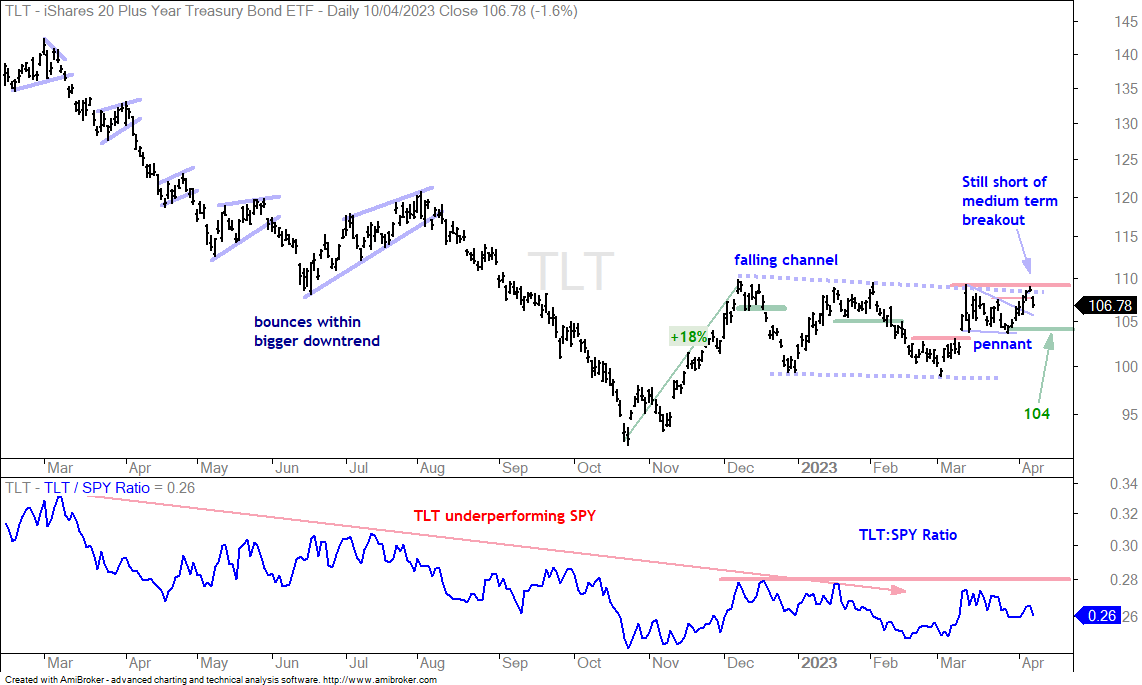
The 20+ Yr Treasury Bond ETF (TLT) remains within a falling channel medium-term (dashed blue trendlines). Short-term, the ETF surged in early March, consolidated into late March and broke out with a surge in early April. TLT, however, did not follow through on this short-term breakout and did not break resistance at 110. This is the next level to watch. A breakout at 110 would be bullish for TLT and signal a downturn in Treasury yields.
Gold and Silver Remain Overbought (GLD, SLV, GDX, SIL, PLTM)
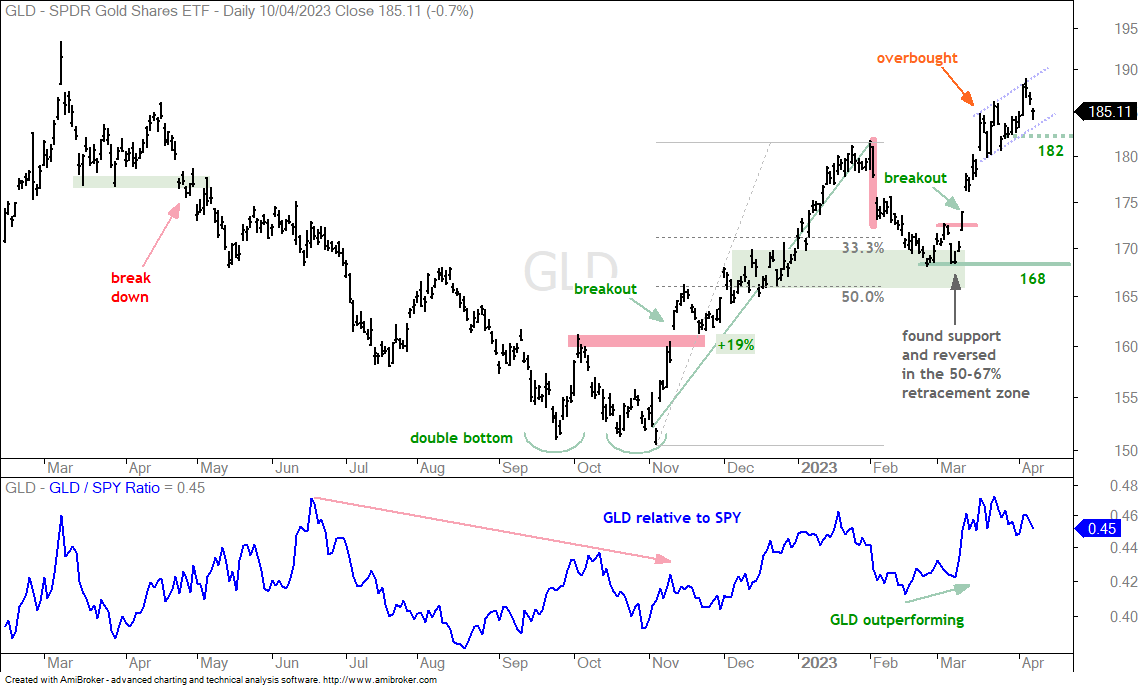
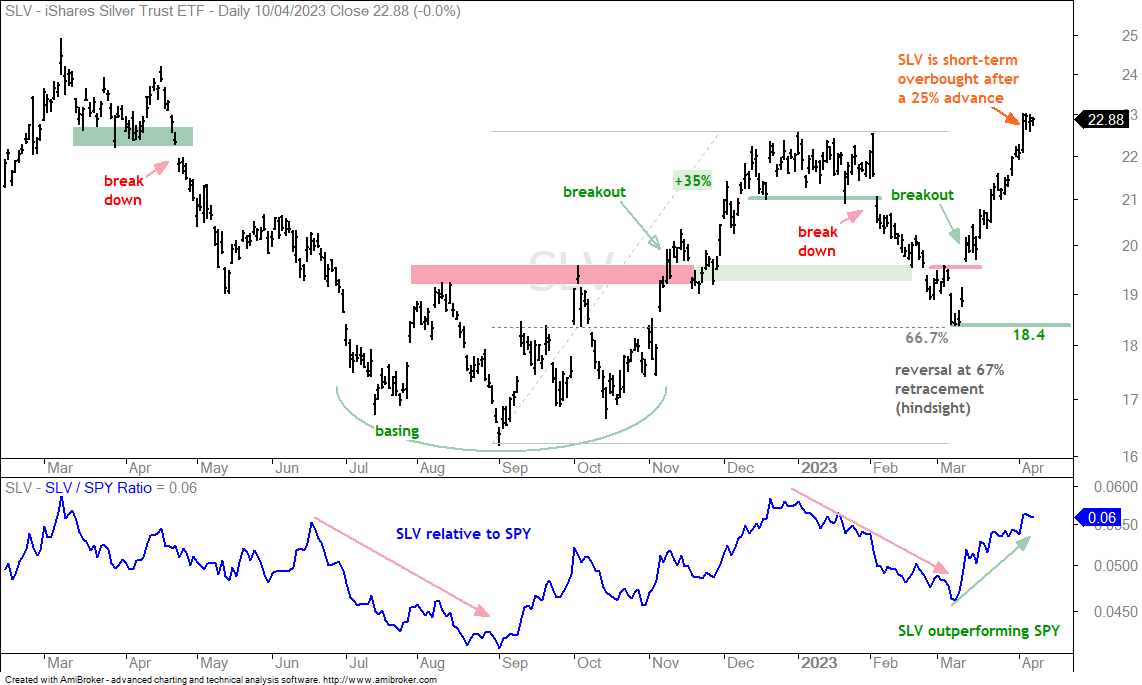
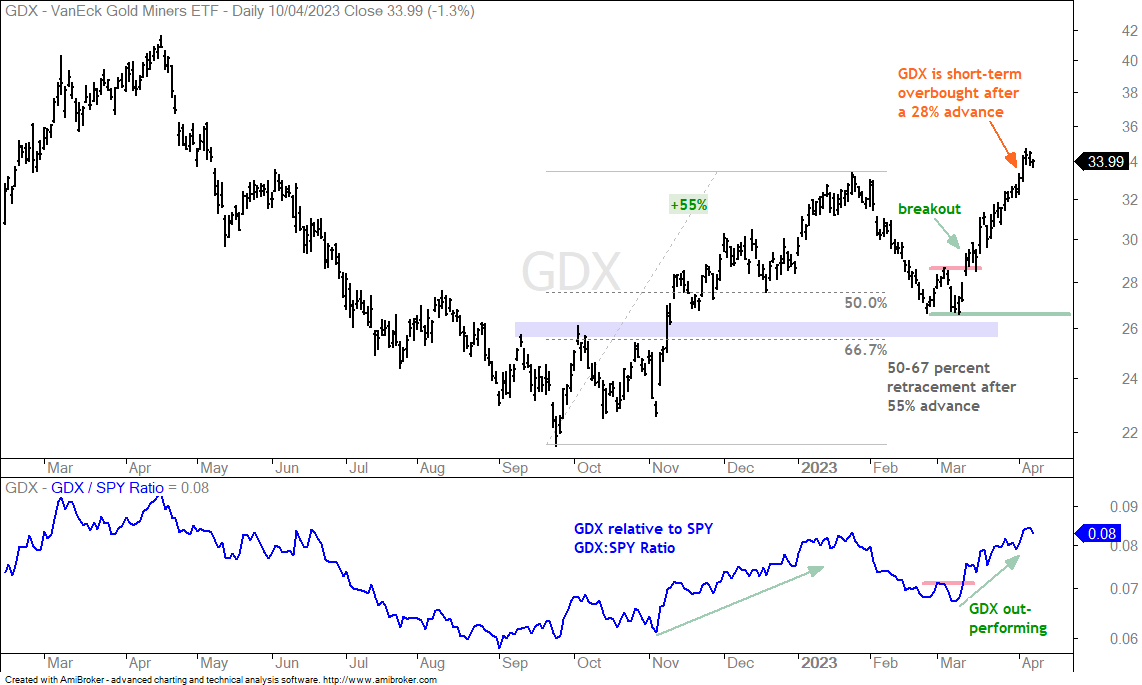
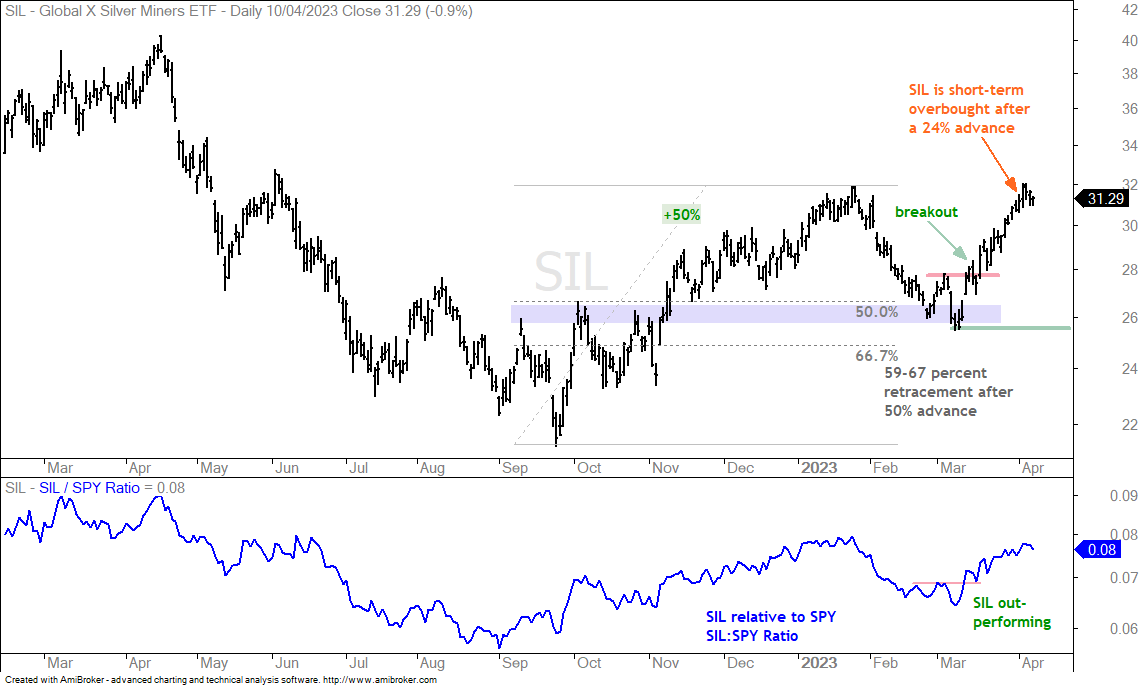
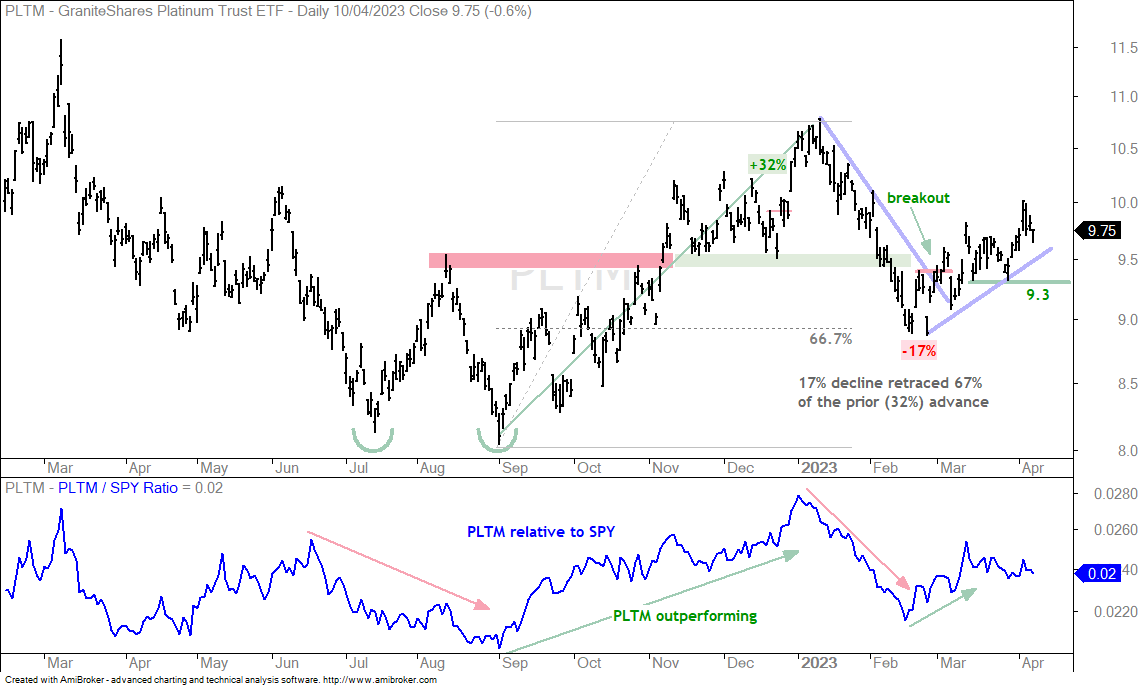
There is no change with the precious metals and miners ETFs. They all surged from mid March to early April and became overbought. GLD pulled back the last three days, but remains overbought and I do not see a short-term setup on the chart. I also think that the Silver ETF (SLV), Gold Miners ETF (GDX) and Silver Miners ETF (SIL) will follow gold. The chart shows GLD surging above 180 on March 17th and then working its way higher the last three weeks (blue dotted lines). GLD is in an uptrend overall, but still overbought and there is no setup on the chart. A setup would be a pullback after the surge, such as a falling flag or wedge. First support is set at 182 and a break here would reverse the short-term upswing. I will leave key support at 168.