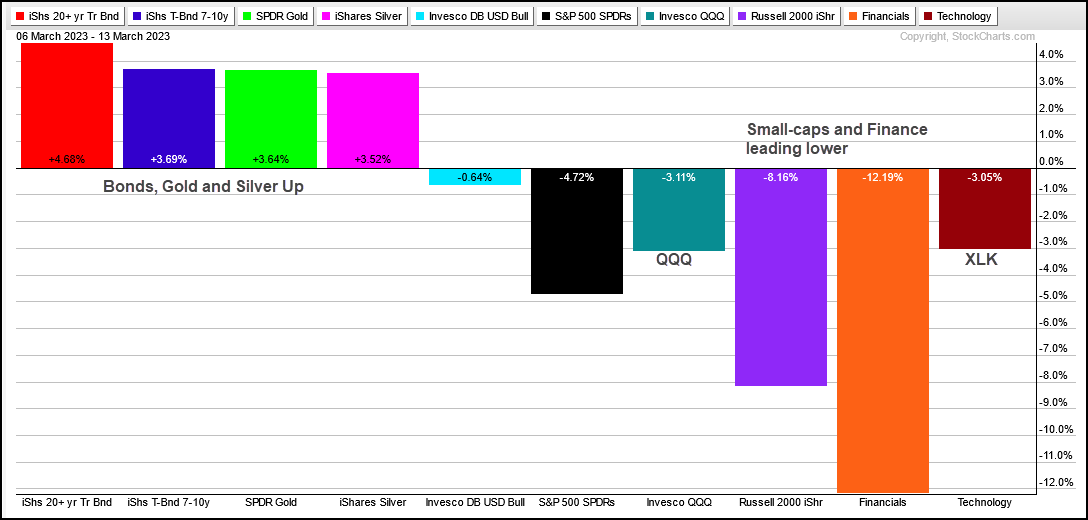
Recent events in the banking world jolted stocks. This jolt was enough to push the Composite Breadth Model into negative territory and widen yield spreads. The Regional Bank ETF (KRE) fell some 26% the last six days, all sectors were down and money moved into alternatives, such as precious metals and bonds. In short, the market decline was not limited to banks and the finance sector. It was broad enough to turn the Market Regime bearish and we are back to risk-off mode. Risk is above average for stock-based ETFs. Also note that the change in the Composite Breadth Model affect the ETF Trend and ROC-Momentum Rank Strategy.
There are some dislocations with the stock market because I am seeing relative strength in QQQ, XLK and some tech-based ETFs. We will look at these charts and also cover the intermarket arena, which could remain chaotic because the CPI report is today. Jim Bianco of Bianco research noted that the markets had zero percent interest rates for 14 years and are getting adjusted to the new normal with the 13-week t-bill yielding 4.6%.
About the ETF Trends, Patterns and Setups Report
This report contains discretionary chart analysis based on my interpretation of the price charts. This is different from the fully systematic approach in the Trend Composite strategy series. In this ETF Trends, Patterns and Setups report, I am looking for leading uptrends and tradable setups within these uptrends. While I use indicators to help define the trend and identify oversold conditions within uptrends, the assessments are mostly based on price action and the price chart (higher highs, higher lows, patterns in play). Sometimes the chart assessment can be at odds with the indicators.
Report Schedule
Tuesday – 14-Mar: Market/ETF Report
Wednesday – 15 Mar: Market/ETF Video
Thursday – 16 Mar: Strategy Updates
Systematic Strategies and Tables
Here are the three active strategies and their respective tables.
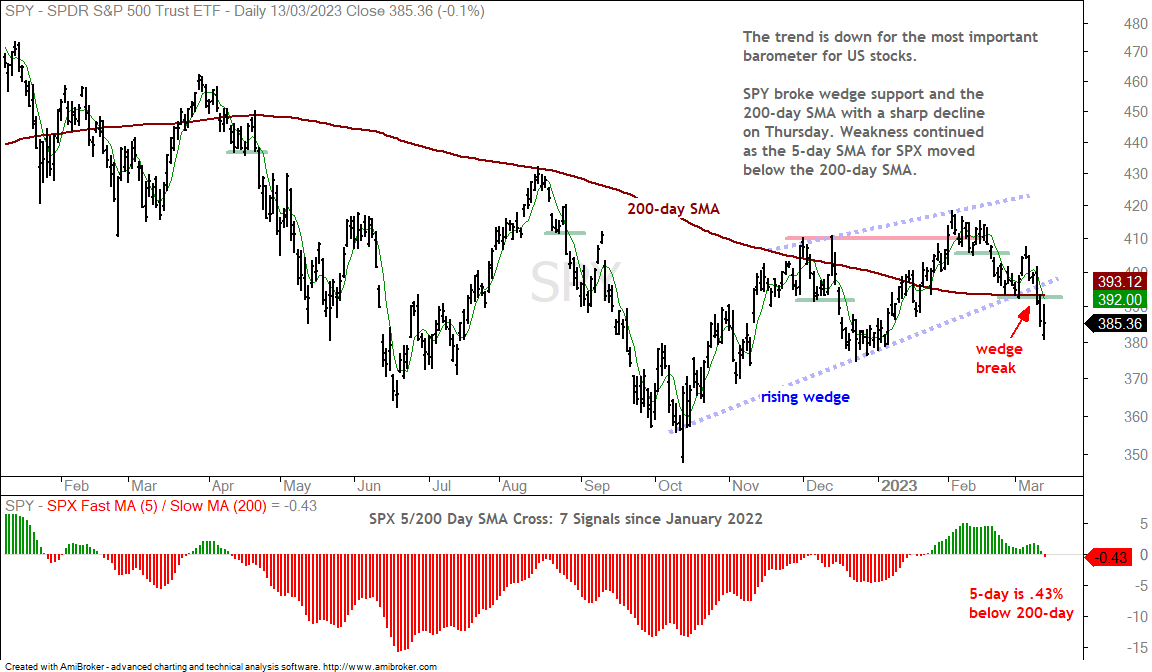
Note that I updated the Market Regime page today because the Composite Breadth Model turned bearish and yield spreads widened sharply the last few days. I also update the wedge break in SPY on this page.
TLT Reverses Downswing and Challenges Resistance
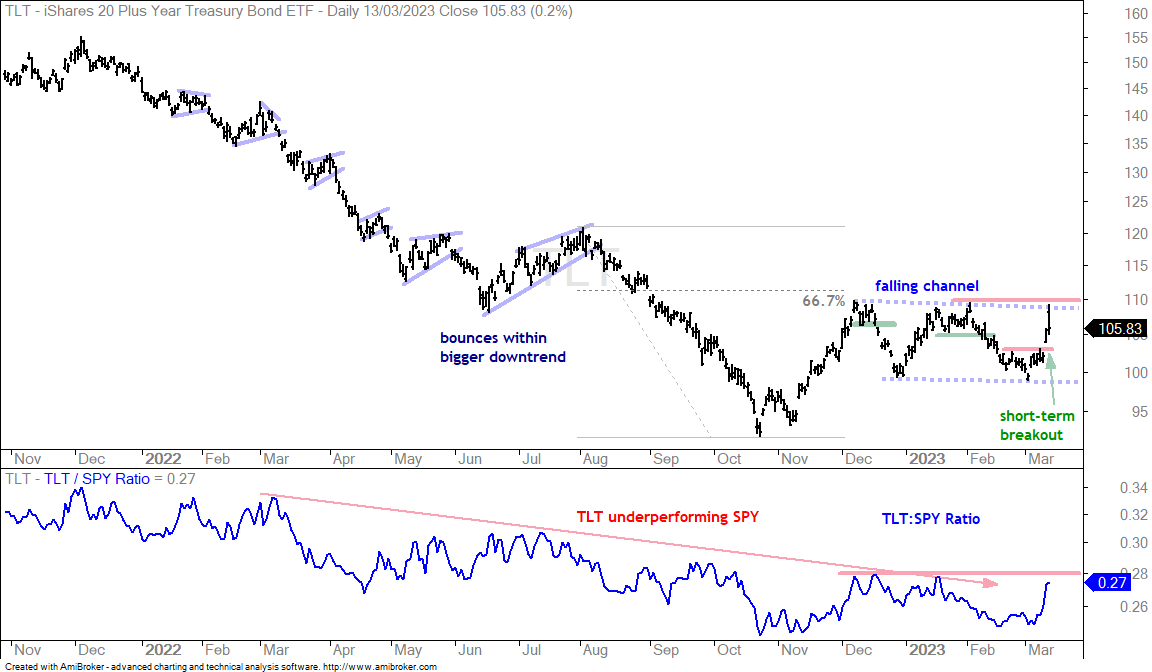
Treasury bonds surged and yields fell sharply the last two days. Treasury bonds are a safe-haven, at least relative to stocks, and Wall Street thinks the current crisis will turn the Fed more dovish. Thinking is dangerous! Short-term, the 20+ Yr Treasury Bond ETF (TLT) broke resistance and reversed the downswing within the falling channel. TLT opened strong on Monday, but fell back and remains within the falling channel. The next signal to watch for is a breakout at 110. The falling channel looks like a correction after the October-December surge and a breakout would argue for a move to the low 120s. This would imply a decline in the 10-yr Treasury Yield and could be positive for high-beta and tech stocks.
Dollar Reverses Short-term Upswing
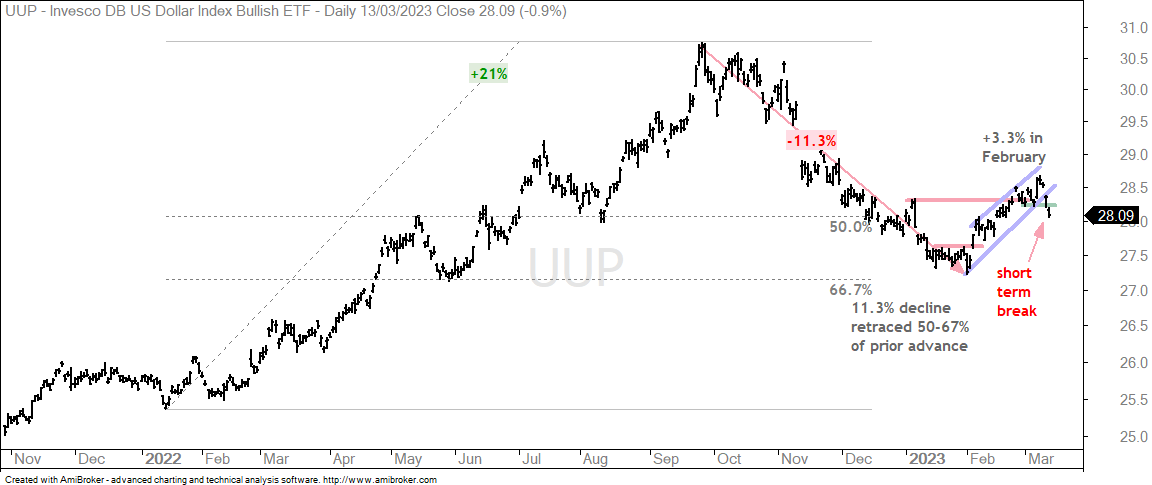
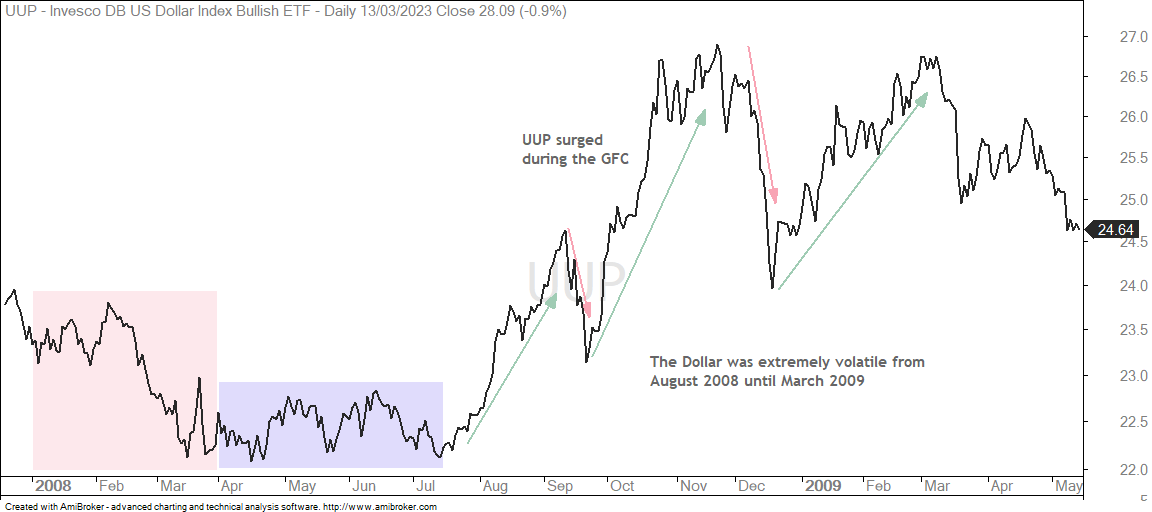
The Dollar Bullish ETF (UUP) broke out of a flag with a 1.2% surge last Tuesday and gave it all back with a sharp decline the last two days. UUP broke short-term support to reverse the short-term uptrend. The Dollar is part of the inter-market chaos.
The US Dollar is often the safe haven currency that benefits in times of turmoil. Note that the Dollar fell in the first quarter of 2008, firmed into the summer and surged from mid July to late October, which was the height of the Global Financial Crisis. I am NOT predicting another GFC, but I consider the Dollar a safe haven currency.
QQQ Bounces off Breakout Zone
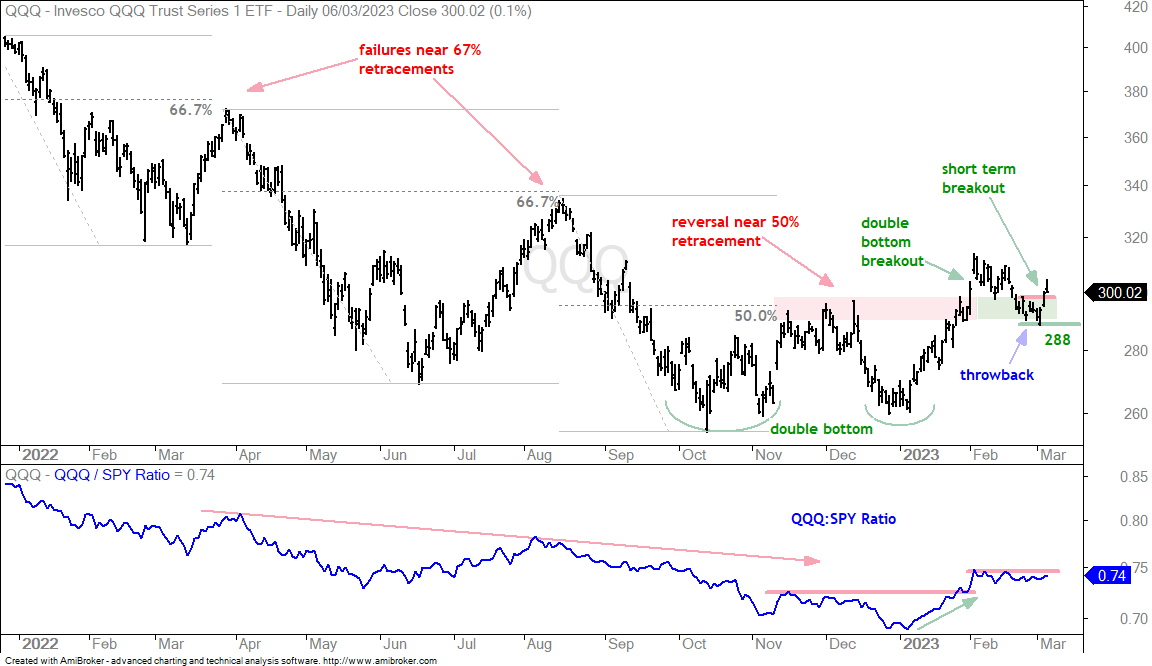
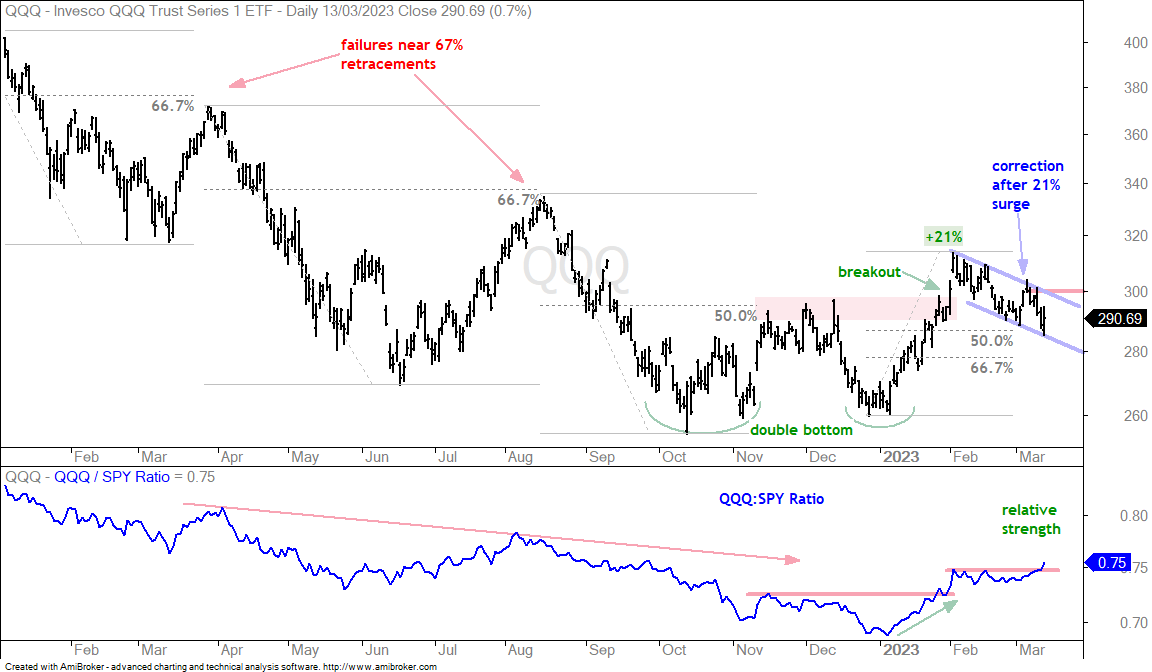
QQQ broke double bottom resistance with a surge into early February and then fell back to the breakout zone by the end of the month. The breakout zone (resistance) turns into the first support zone (red/green shading). QQQ held this zone with a surge the last three days. The February decline is a throwback after the breakout and this pullback is normal after at 20% surge from late December to early February. QQQ firmed in the 289-299 area as buying pressure increased and then broke short-term resistance. This buying pressure marks a demand zone that becomes key support (288). A close below 288 would signal a resurgence of selling pressure (supply) and call for a re-evaluation.
Precious Metals Surge in Flight to Alternatives (GLD, SLV, PLTM)
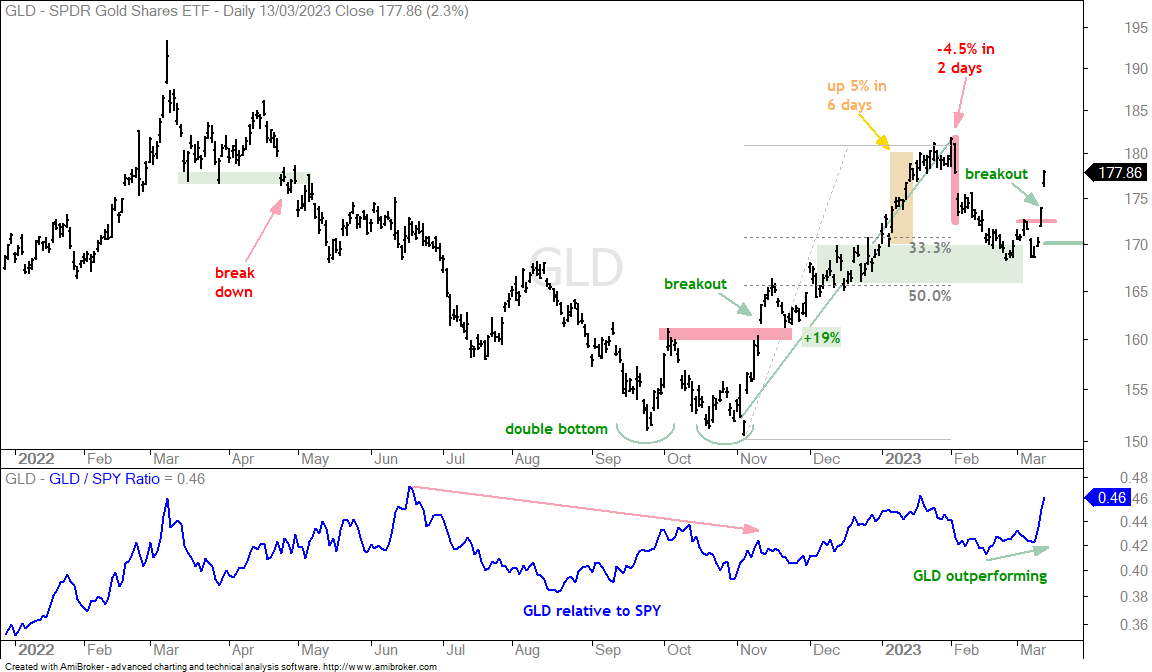
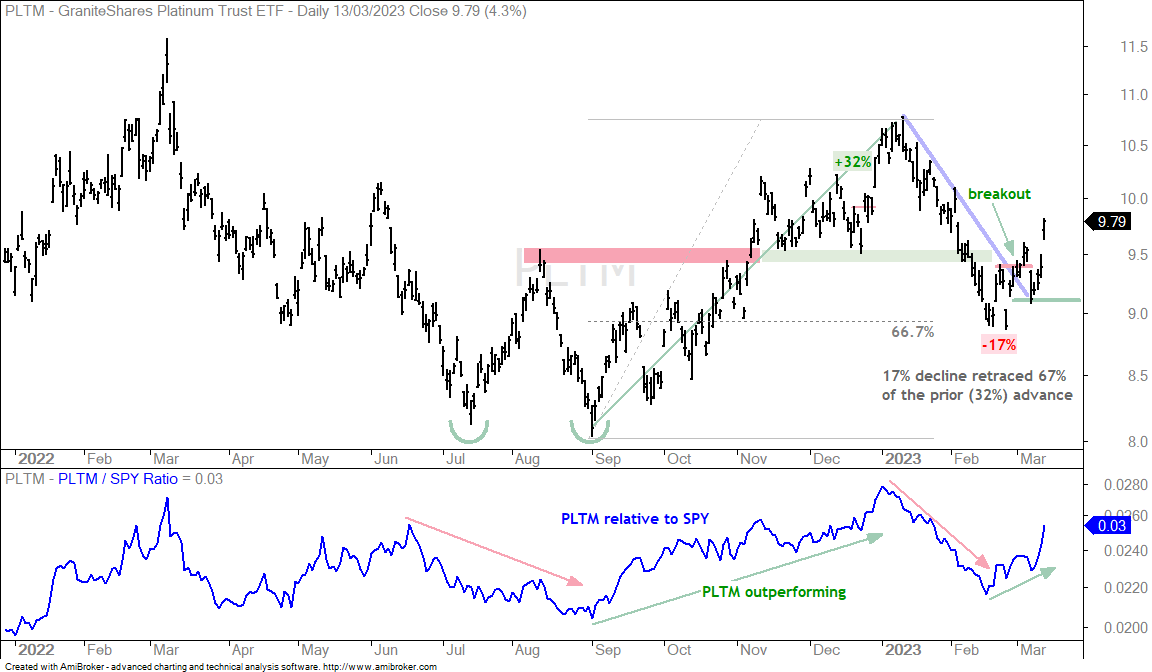
The Gold SPDR (GLD), Silver ETF (SLV) and Platinum ETF (PLTM) surged over the last few days. The combination of crisis and a weak Dollar helped. The first chart shows the Gold SPDR (GLD) firming in the top of its support zone and breaking short-term resistance with a surge the last two days. GLD is up 5.5% the last three days and already quite extended. Nevertheless, the breakout is bullish and I would set a re-evaluation level at 170.
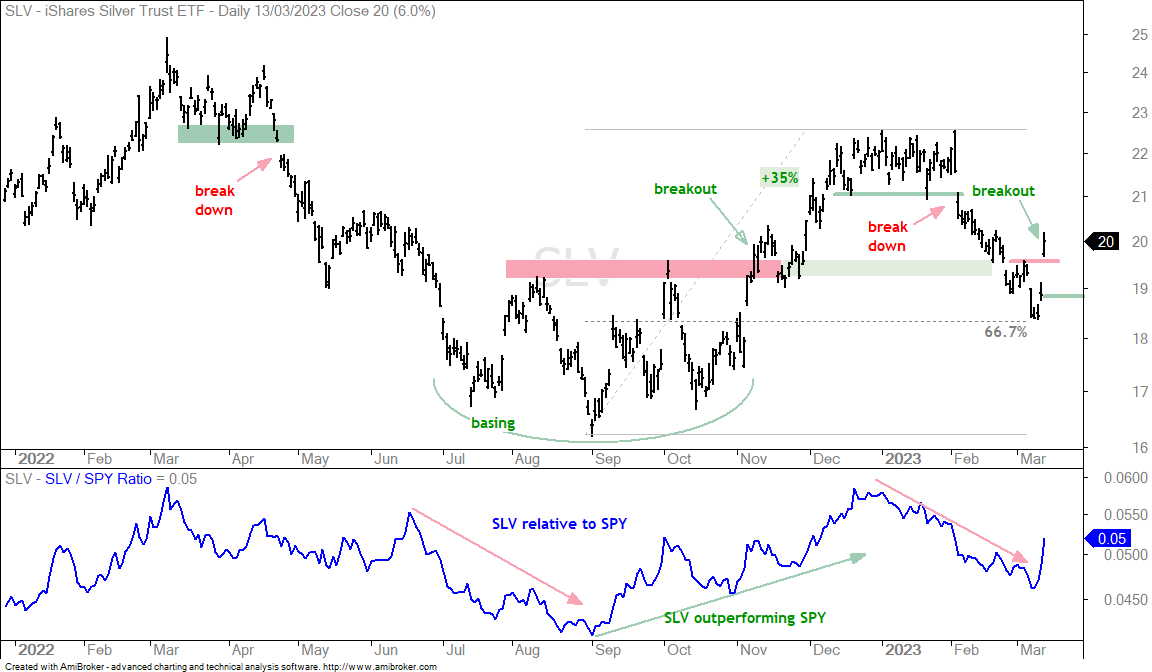
Silver is just gold on steroids as the Silver ETF (SLV) surged 8.7% the last three days. Hindsight analysis shows SLV reversing at the 66.7% retracement line. SLV then broke short-term resistance with a surge above the early March high.
The next chart shows the Platinum ETF (PLTM) with a breakout in early March and a hard throwback last week. GLD exceeded my re-evaluation on this throwback, but PLTM held the 9.10 re-evaluation level on a closing basis. The 66.7% retracement line was not hindsight analysis in this case. Overall, PLTM extended on its breakout with a 6.5% the last three days. I will keep the re-evaluation at 9.10.
Gold Miners ETF Gets Breakout and Outperforms (GDX, SIL)
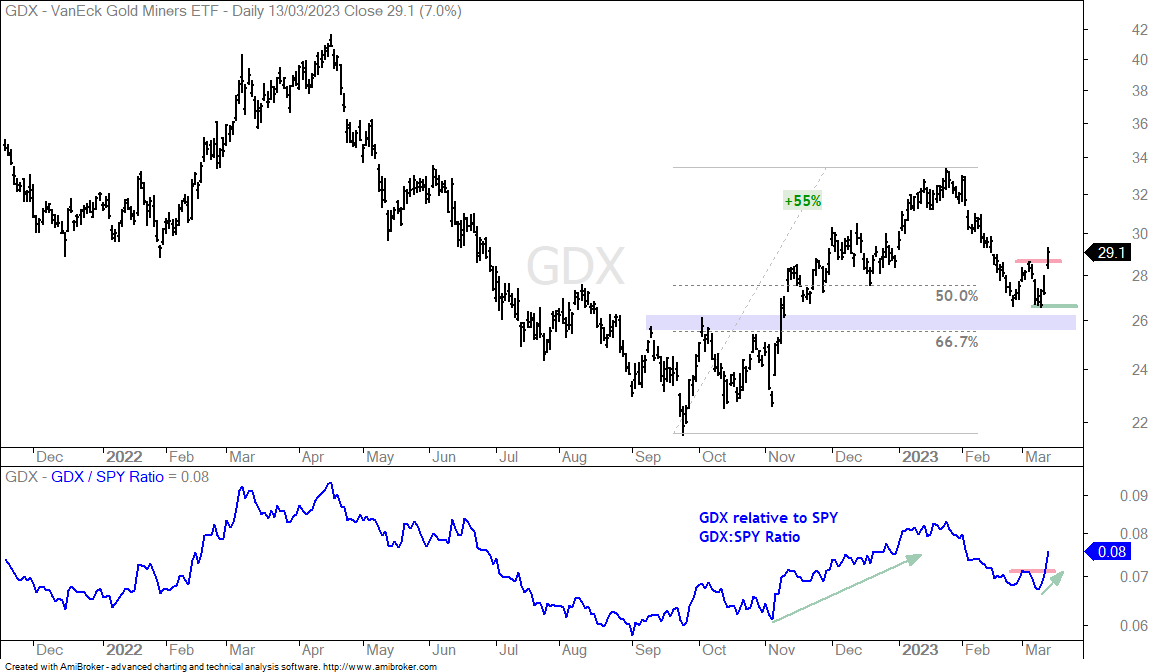
The Gold Miners ETF (GDX) and Silver Miners ETF (SIL) are channeling strength in precious metals. The chart below shows GDX with a 55% surge from mid September to late January and a 20% decline into late February. This decline retraced 50-67 percent of the prior advance and GDX firmed just above the prior breakout (blue shading). Thus, it looks like a normal pullback within a bigger uptrend. GDX reversed the short-term downtrend with a breakout on Monday. Note that GDX was up 9% the last two days and has above average volatility. Buckle up!
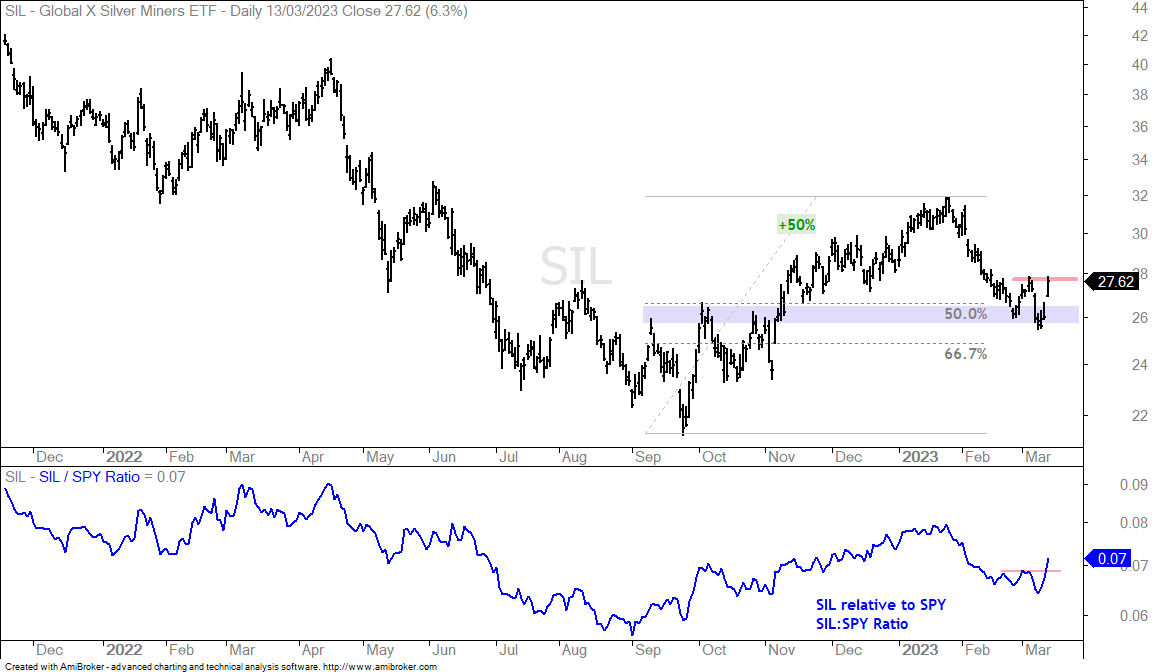
The next chart shows SIL with similar characteristics. Note that SIL is just shy of a breakout.
QQQ and XLK Show Relative Strength
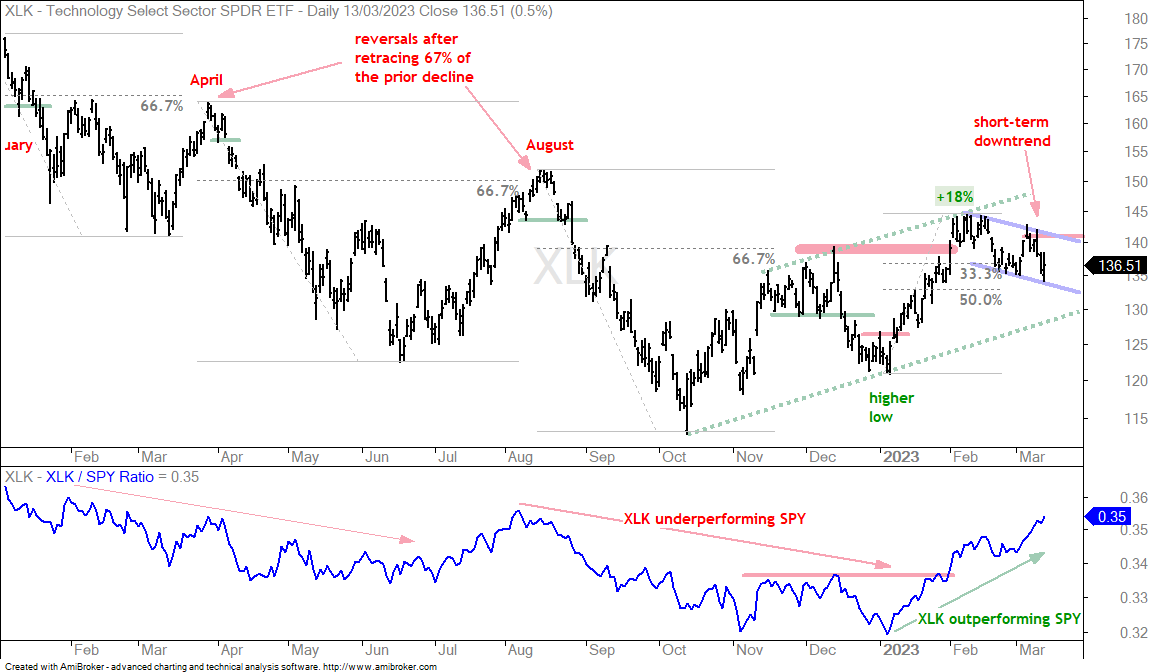
The Nasdaq 100 ETF (QQQ) and the Technology SPDR (XLK) fell with the rest of the market over the last six weeks, but they are holding up better here in March and showing relative strength overall. The first chart shows QQQ with a double bottom breakout and a falling channel pullback that retraced just over 50%. Both the pattern and the retracement amount are typical for corrections within uptrends. The broad market environment is not favorable right now, but QQQ has a bullish setup: pullback after breakout. A close above 300 would reverse the short-term downtrend and signal a continuation higher. The indicator window shows the QQQ:SPY ratio turning up in March as QQQ outperforms.
The next chart shows XLK with an 18% advance and falling flag/channel pullback since February. This pullback retraced 33-50 percent, which is shallower than the pullback in QQQ. The short-term trend is down right now and I am marking resistance at 141. A breakout here would be bullish and argue for further strength.
Semis, Software and Cyber Pull Back (SOXX, IGV, CIBR)
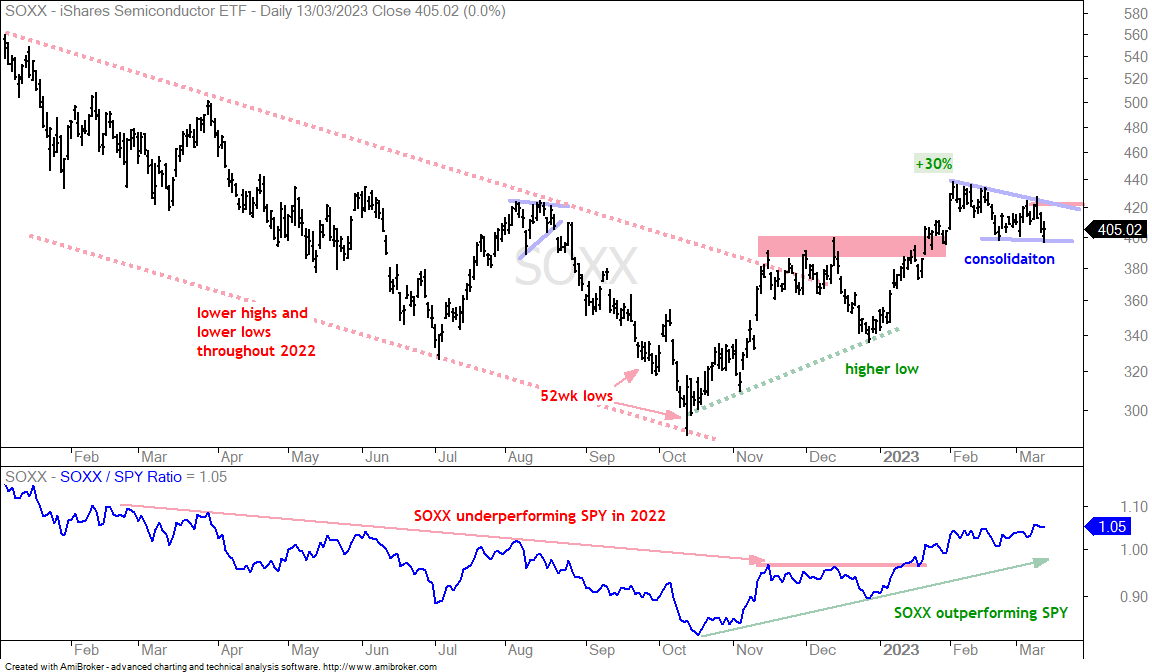
The next chart shows the Semiconductor ETF (SOXX) with a 30% surge and then a consolidation since early February. Flat consolidations, triangles, falling channels, falling flags and falling wedges are all pretty much the same. They represent a corrective period after a sharp advance and there are two ways to play. First, one can wait for a breakout to signal an end to the corrective period. Second, one could wait for an oversold condition and pullback to a key retracement level. SOXX is not oversold right now and remains in a flat consolidation or slightly falling wedge. A close above 422 would trigger a breakout.
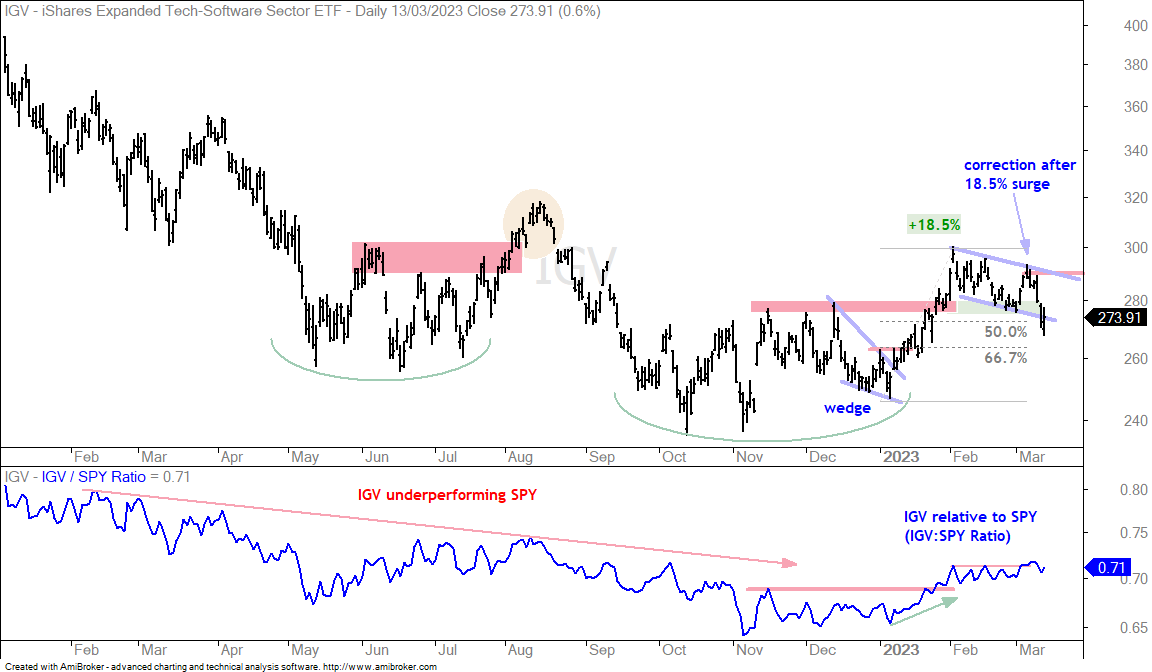
Sometimes we do not get a picture-perfect flag, wedge or triangle. The next chart shows the Software ETF (IGV) with an 18.5% surge and a decline that retraced 50-67 percent. IGV pierced the lower line of the falling flag on Friday and then bounced back on Monday. Overall, I still view this as a correction and a breakout at 290 would be bullish.
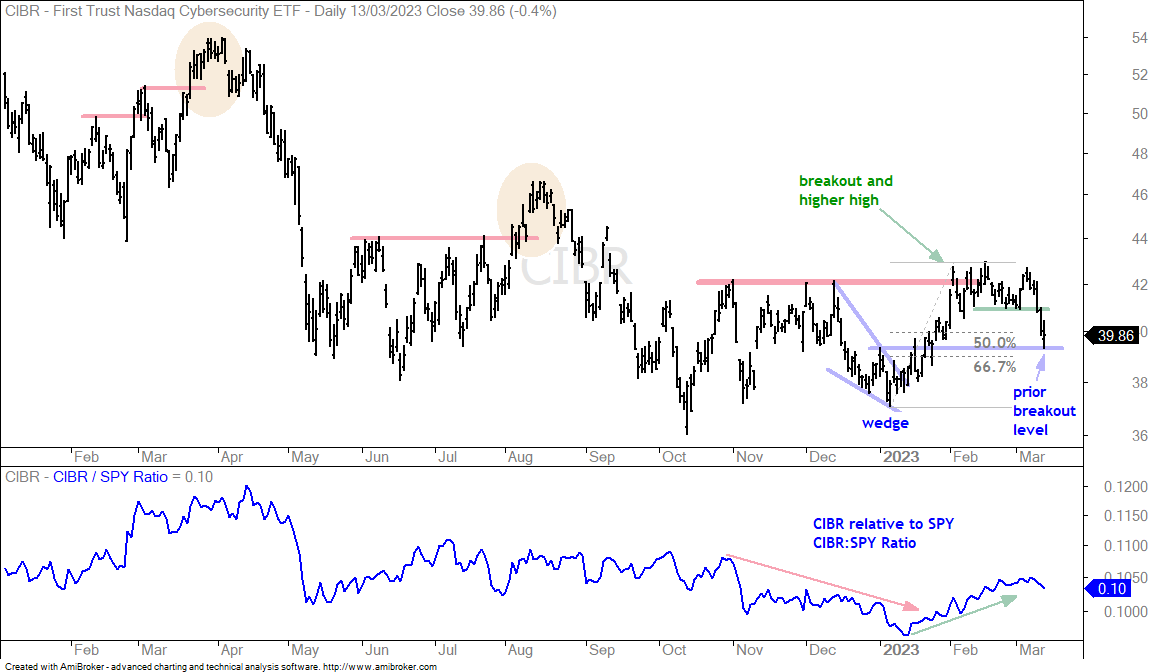
The Cybersecurity ETF (CIBR) was holding up relatively well in early March, but succumbed to broad market selling pressure the last three days and broke short-term support. Even though we do not have a nice pattern to work with here, note that the decline retraced 50-67 percent of the prior advance. CIBR also returned to the prior breakout level and became short-term oversold as the Momentum Composite hit -3 (not shown). Thus, we have an oversold setup, a possible support level and a retracement level to watch for a bounce. I would also cue off XLK and QQQ. These two need breakouts to pull tech-related ETFs higher.
Home Construction ETF Forms Corrective Wedge (ITB)
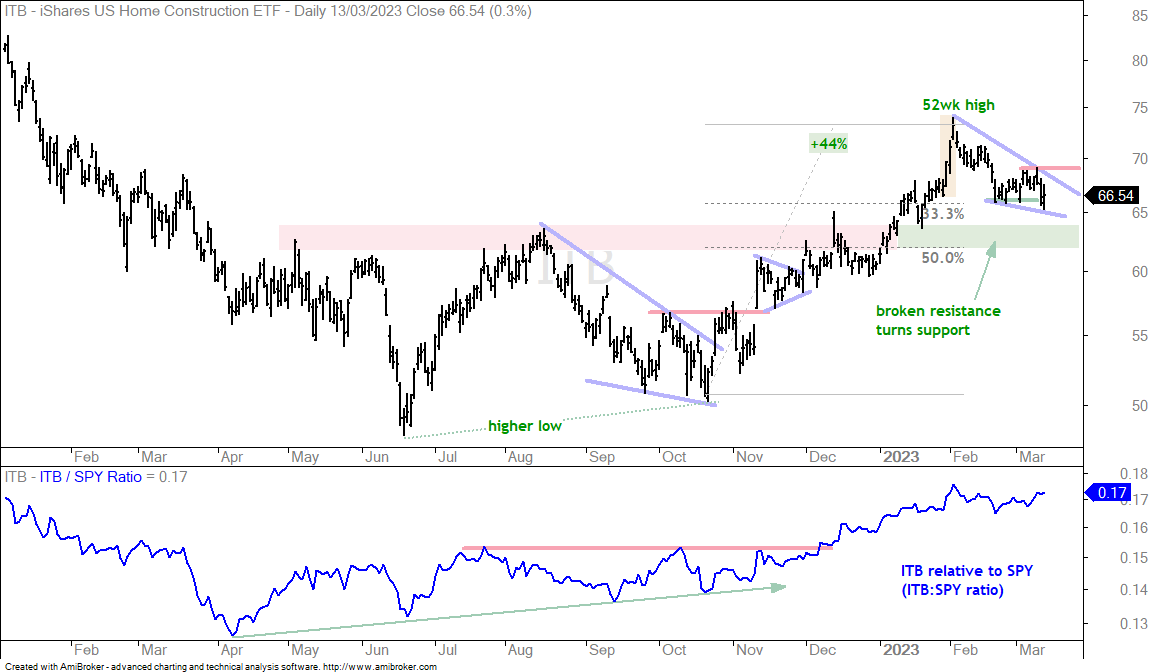
The Home Construction ETF (ITB) also has a corrective pattern working. The ETF advanced some 44% and then formed a falling wedge. The short-term trend is down as long as the wedge falls. A breakout at 69 would reverse the fall and signal a resumption of the bigger uptrend.
Information in the Regional Bank ETF Chart (KRE)
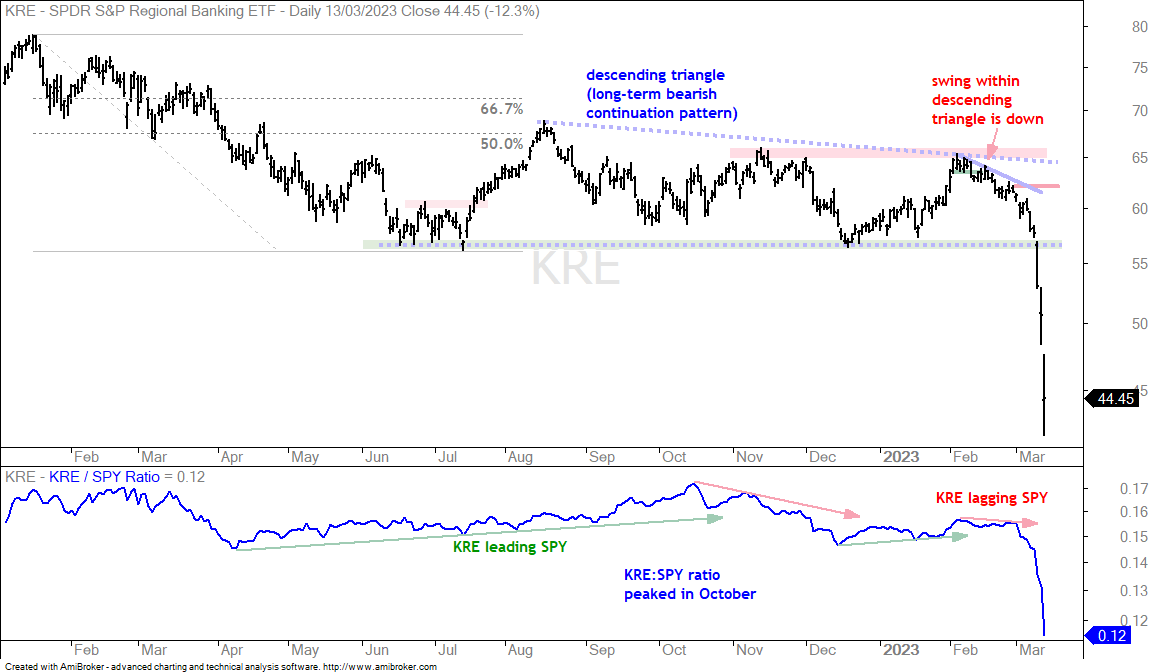
I showed a large Descending Triangle in the Regional Bank ETF (KRE) in reports on February 21st and March 7th. I did NOT predict the crash, but there was valuable information in this chart. Namely, KRE was lagging SPY in early March, the short-term swing was down and a larger bearish pattern was taking shape. KRE was pretty much lagging since October, which is when the price-relative peaked (KRE:SPY ratio). KRE shows up why it is important to focus on ETFs in uptrends and ETFs that are not lagging.
Insurance ETF Plunges Along with Finance Sector (KIE)
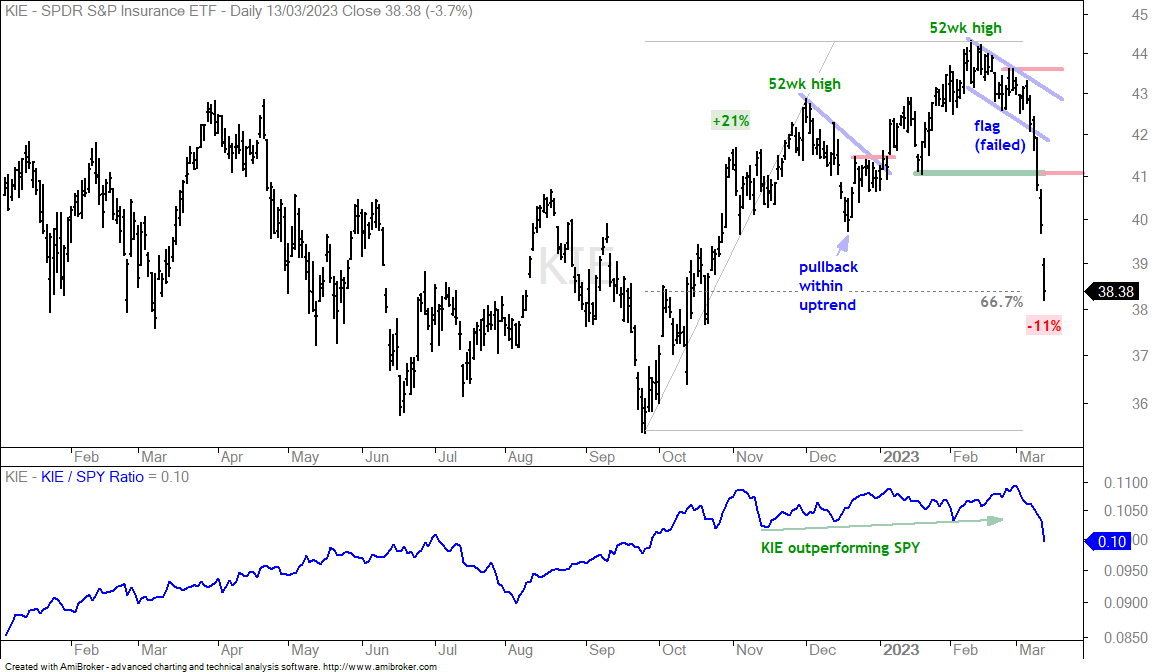
I do not know the intricacies of the insurance business and its connection to regional banks, but the Insurance ETF (KIE) is part of the finance sector and did not escape the gravitational pull. Correlations rise during broad market declines and insurance is more correlated to the finance sector than software. My guess is that this is an overreaction. KIE is down around 11%, it is oversold and near the 67% retracement line. This is a good spot for the falling knife to bounce. The support break at 41 marks first resistance.
Aerospace-Defense ETF Pulls Back with Market (PPA, PHO)
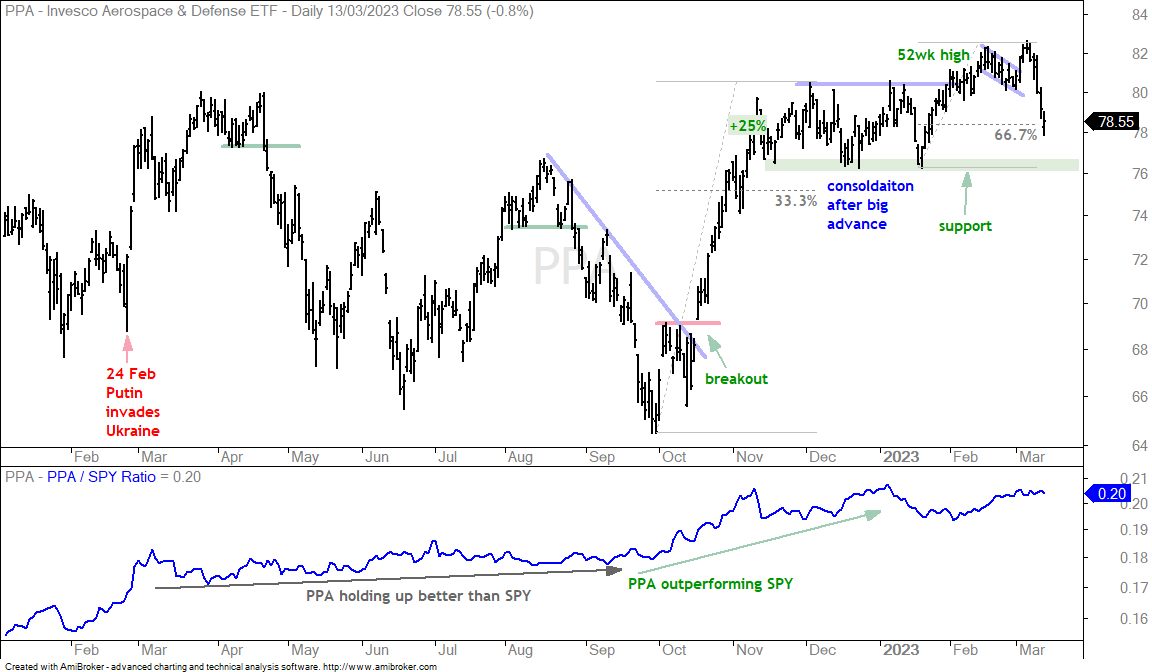
The Aerospace & Defense ETF (PPA) was also leading the market at the end of February. PPA broke out of a flag, but this flag breakout failed as PPA succumbed to broad market weakness and fell sharply the last five days. This decline puts PPA near the 67% retracement and in an oversold condition. Note that the Momentum Composite hit -4 and Relative ROC dipped to -189 (not shown). The three defense ETFs became oversold on Friday and were shown on the Mean-Reversion setup table (ITA, PPA, XAR).
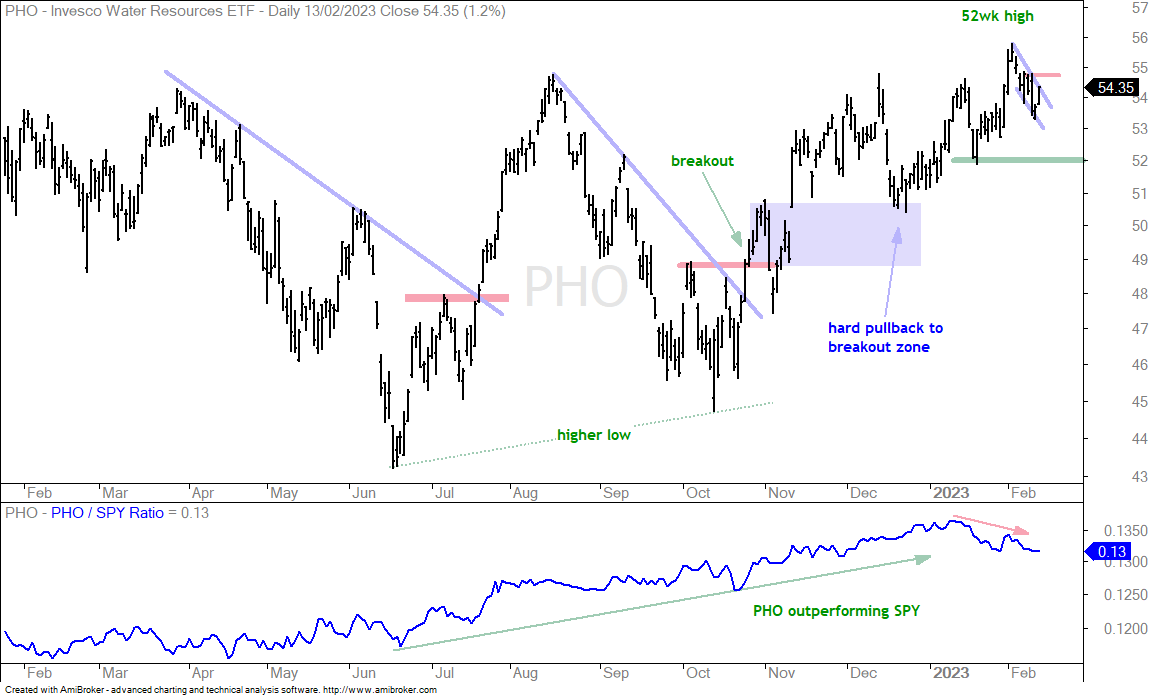
The next chart shows the Water Resources ETF (PHO) hitting a 52-week high and leading the market in early February. As with KIE, the ETF fell in February with a falling flag and never broke out. The flag failed. Nevertheless, the decline in PHO is still a pullback within a bigger uptrend and PHO is at support. The ETF was also short-term oversold on Friday as the Momentum Composite hit -3 and Relative ROC exceeded -150.