")
This content is for subscribers. (Login or Subscribe)

A Rough December, Pullbacks within Uptrends, Marking Setup Zones and Resistance, Gold, Bitcoin and China
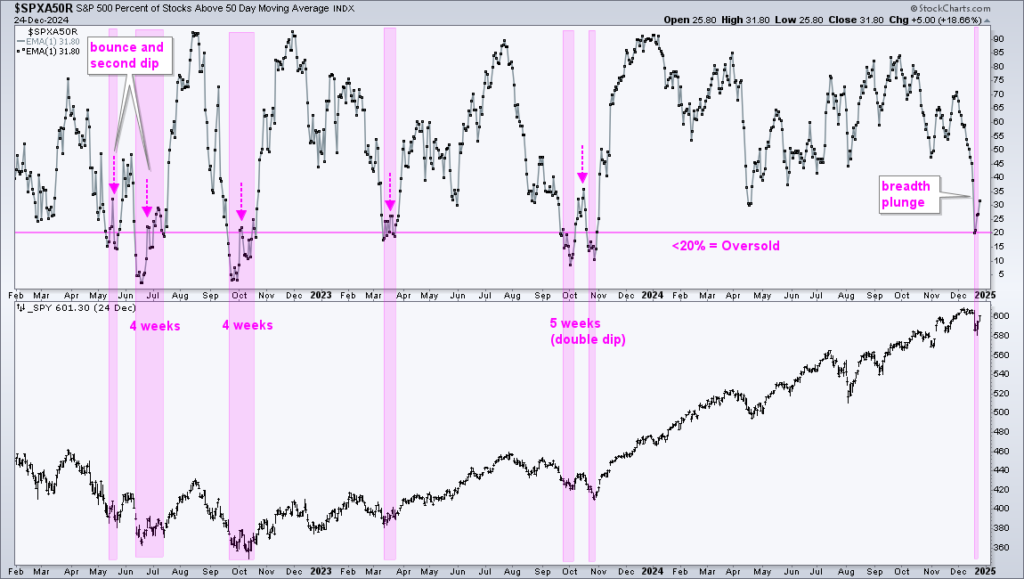
Today’s report starts with average stocks (equal-weight, mid-caps and small-caps). These groups fell rather sharply in December and gave back their November gains. They have fallen and cannot get back up. Many are trading near bullish setups zones, but remain short of breakouts needed to reverse the short-term pullbacks. We will set the key levels to watch for a dozen ETFs with setups. Attention then turns to gold, Bitcoin and China.