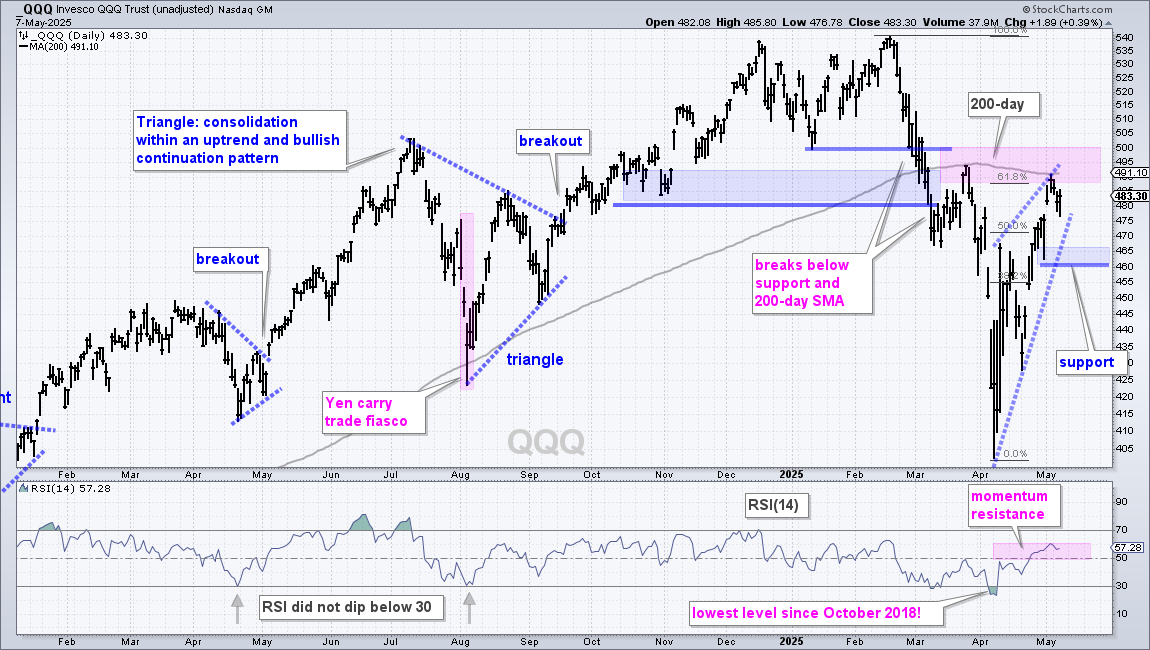
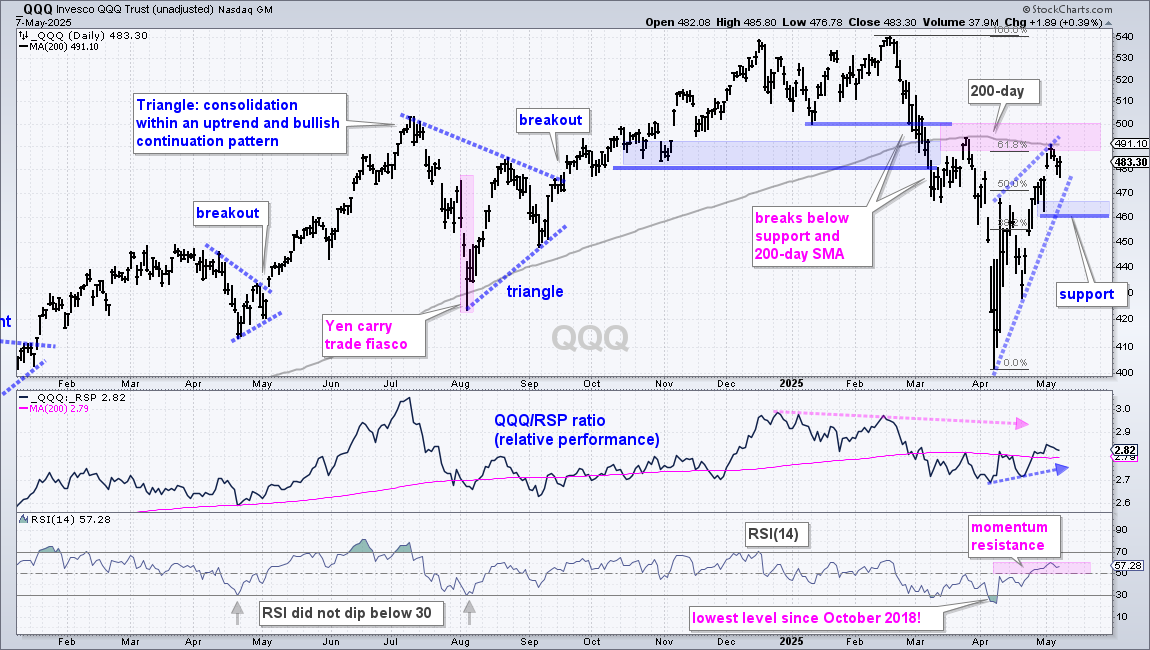
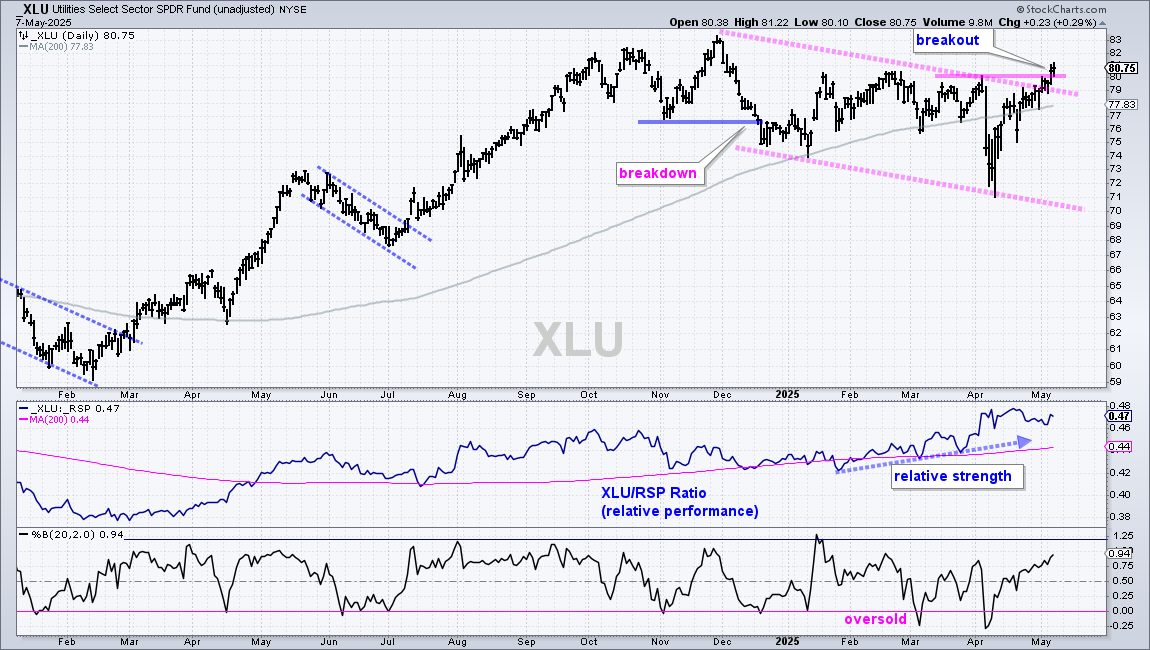
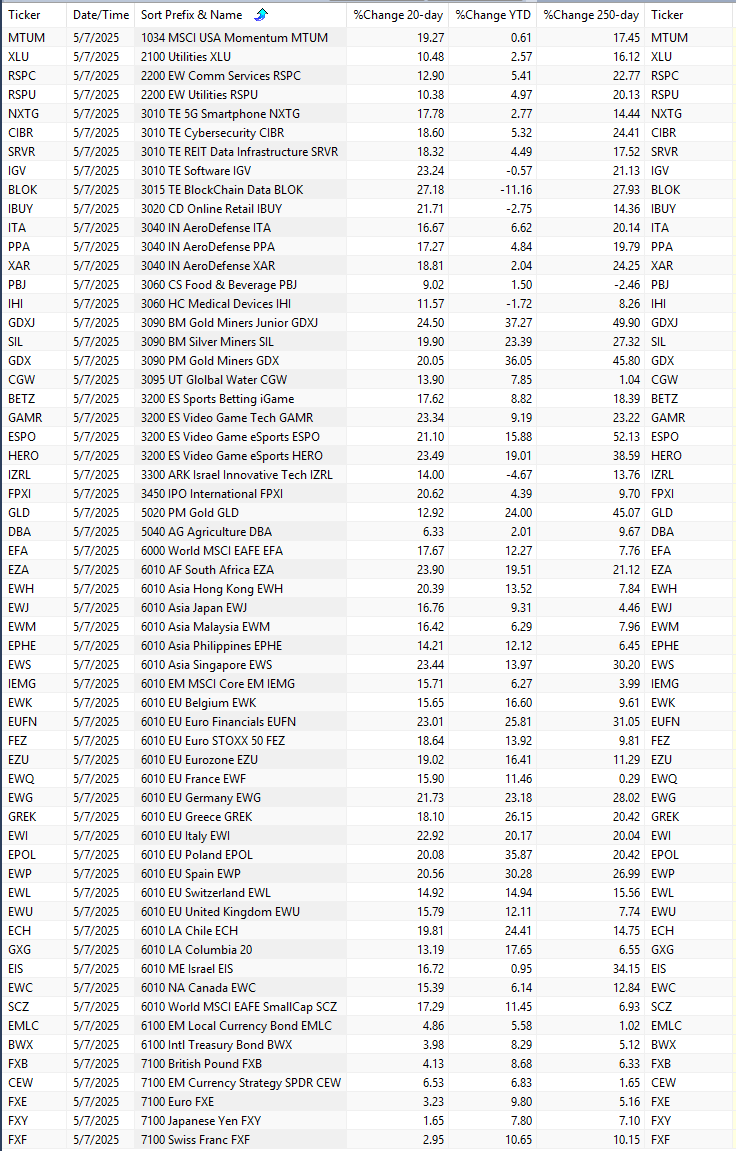



The weight of the evidence is mixed, at best for the stock market. Our long-term trend and breadth indicators are bearish, but we did get short-term thrust signals towards the end of April. These signals remain in play so we will update the key levels to watch. Despite a record rebound the last few weeks, the March breakdowns remain and the short-term upswings look like counter-trend bounces. Stocks are also short-term overbought. Strategically, the long-term downtrends and bear market are negative. Tactically, upside could be limited as resistance levels come into play and short-term conditions become overbought.
Market/ETF Video – Long-term Breadth vs Thrusts – Wedges and Overbought in Downtrends Read More »
This market regime report weighs the evidence to determine the state of the stock market. Are we in a bull market or bear market? We start with the long-term trends for three major index ETFs (SPY,QQQ,RSP). Attention then turns to breadth indicators to measure the percentage of stocks in uptrends/downtrends and the percentage hitting new highs/lows. These indicators
Market Regime – Bear Market Bounce – Spreads Narrow – TLT Holds Breakout Read More »
The weight of the evidence is mixed, at best for the stock market. Our long-term trend and breadth indicators are bearish, but we did get short-term thrust signals towards the end of April. These signals remain in play so we will update the key levels to watch. Despite a record rebound the last few weeks, the March breakdowns remain and the short-term upswings look
Market-ETF Report – Long-term Down + Short-term Overbought = Not Ideal Read More »

The market does not always follow the same script or sequence, but bear markets end with a bottoming process that often goes in stages. First, there is the capitulation phase, which suggests that selling pressure reached extremes and a bottom may be close. There was a capitulation setup in early April. Second, short-term thrust indicators mark a sharp recovery after an
Bottoming Process – Capitulation, Short and Medium Term Thrusts, Regime Change Read More »
Chartists can also use the 200-day SMA and the direction of the 200-day SMA to compare performance. ETFs trading above their rising 200-day SMAs are performing better than those trading below their falling 200-day SMAs. Overall, 23 of the 72 core ETFs are trading above their rising 200-day SMAs.
Trend Trio Signal for ITA – Few Uptrends – GLD Remains Frothy – Software Breaks Out Read More »
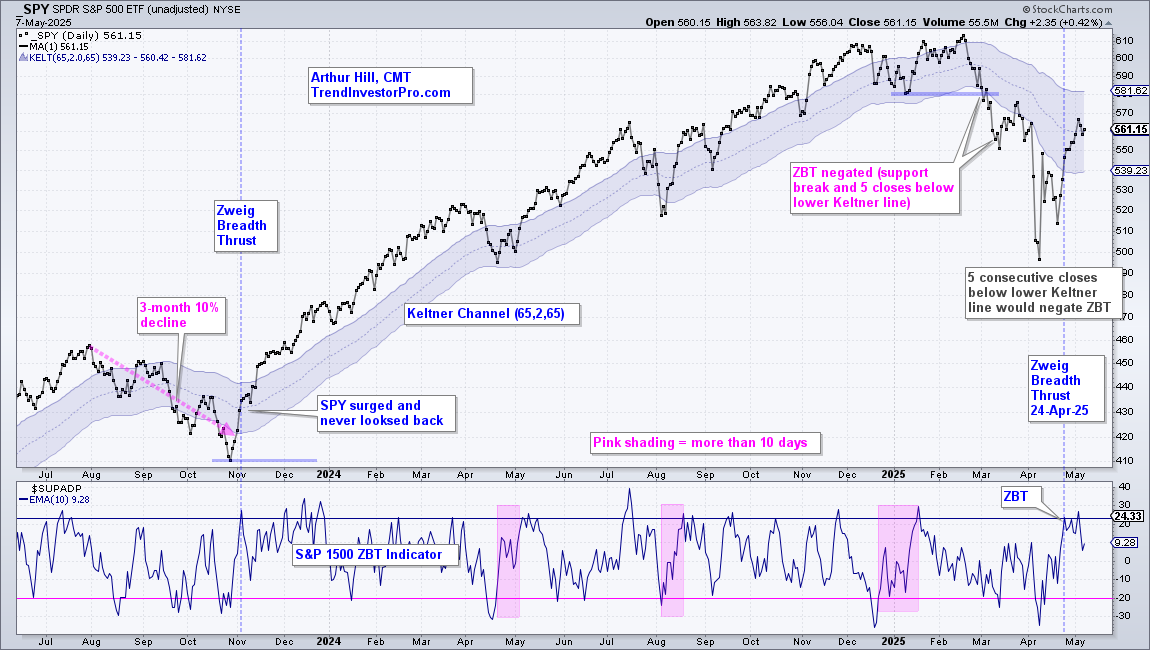
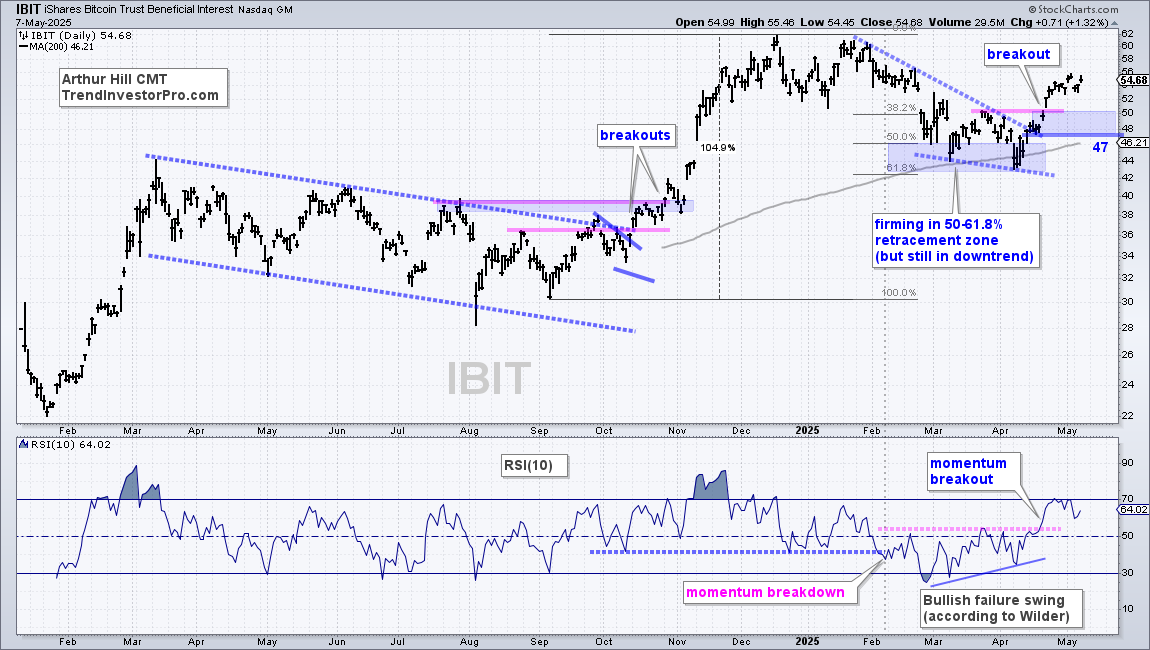
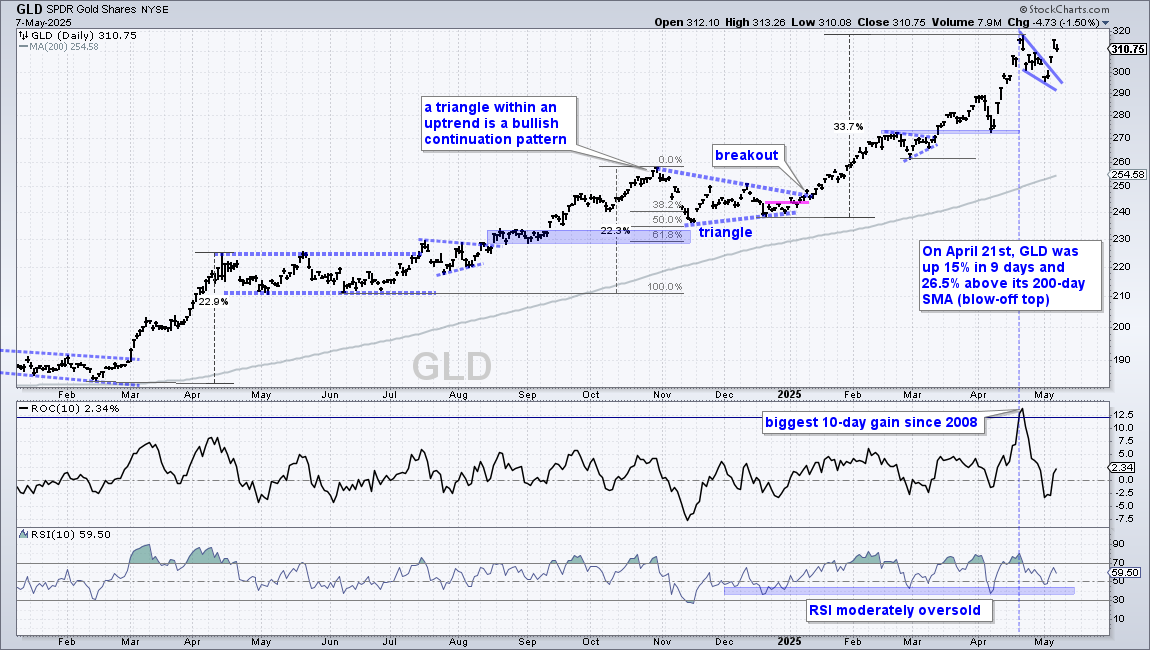
Today’s video starts with the long-term trend and breadth indicators to define the broad market environment. We then turn to the Zweig Breadth Thrust and show the key SPY levels to watch going forward. Stocks are all over the place in April, but a handful of leaders emerged with uptrends, relative strength and breakouts. Elsewhere, the Bitcoin ETF extended on its breakout and GLD is still looking extended.
Market/ETF Video – Bear Market vs ZBT – SPY/QQQ Resistance – ETFs with Leading Breakouts Read More »
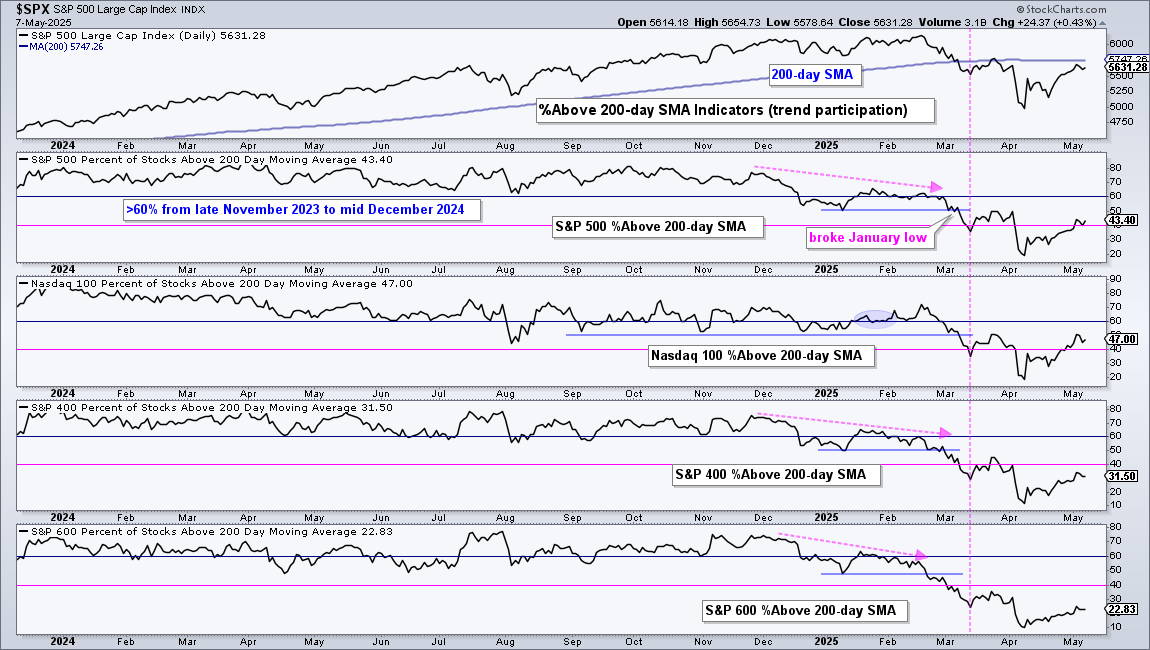
After hitting oversold extremes in early April, breadth indicators bounced the last few weeks with the percentage of S&P 500 stocks above their 200-day SMA hitting 36%. This also means that 66% are below their 200-day SMAs and in long-term downtrends. You cannot have a bull market with
Market Regime – Weighing the Evidence using Trends, Breadth and Yield Spreads Read More »
Stocks are all over the place in April with a breakdown at the beginning and a Zweig Breadth Thrust towards the end. April price action seems to dominate, but it was the March breakdowns that reversed the long-term uptrends. The weight of the evidence also turned bearish in mid March as long-term breadth indicators also triggered. Currently, the long-term
Market-ETF Report – ZBT Update – Key SPY/QQQ Levels – XLK Resistance – Breakouts in Play Read More »
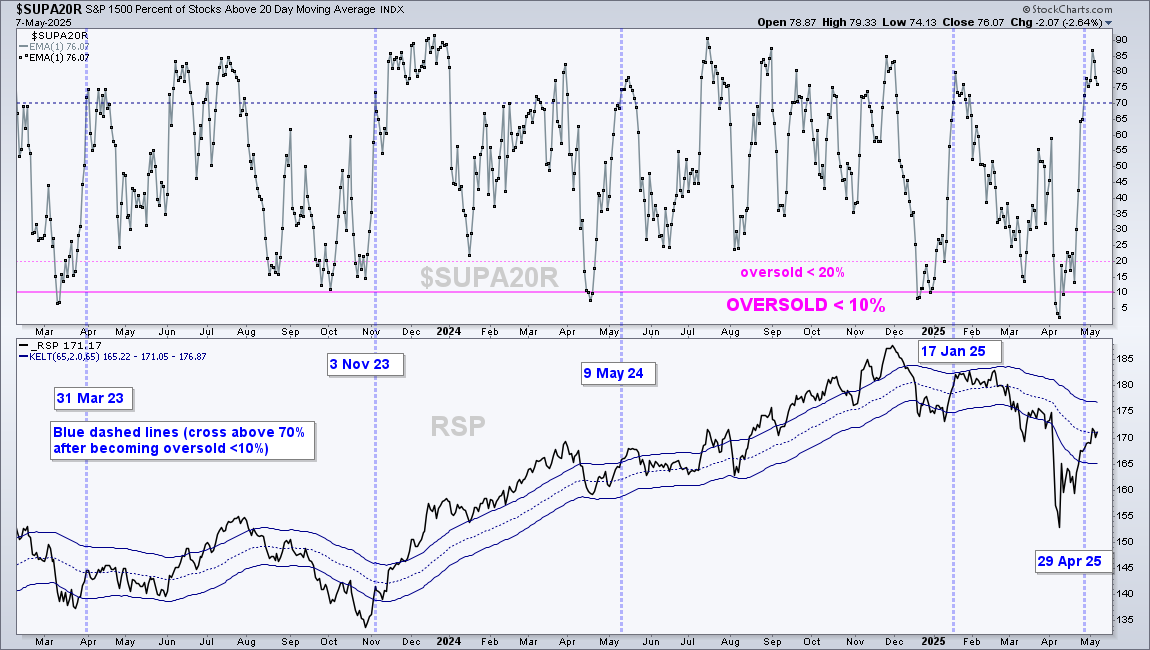
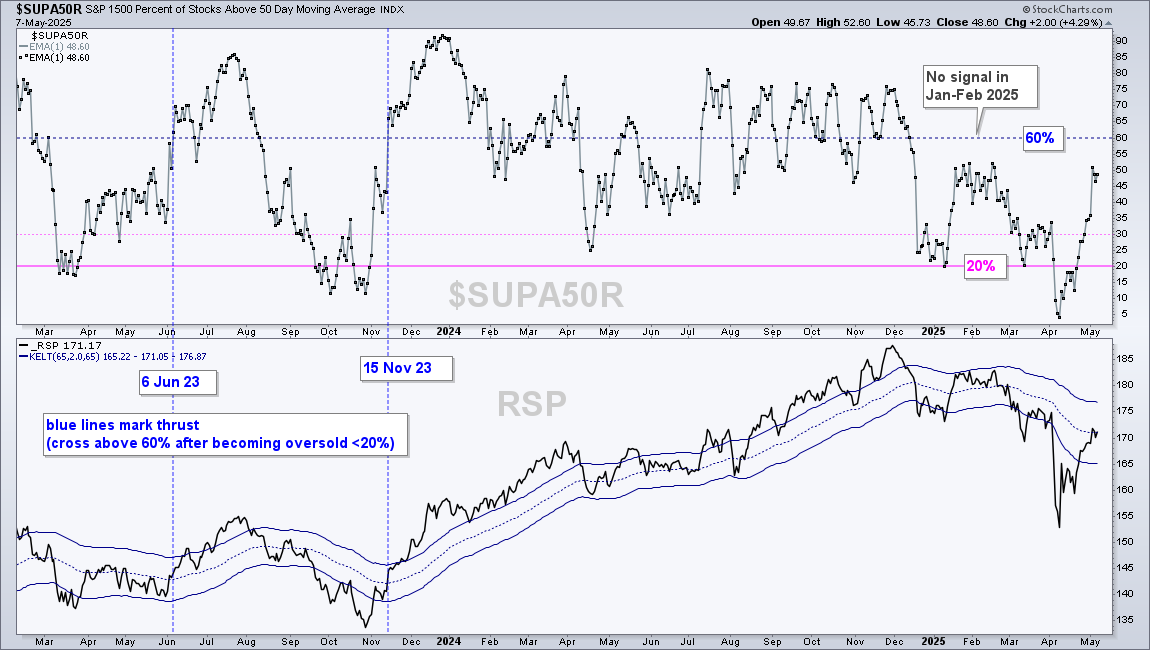
Besides the Zweig Breadth Thrust, chartists can identify bullish thrusts using short-term breadth indicators, such as the percentage of stocks above their 20 and 50 day SMAs (simple moving averages). Breadth thrust signals reflect a sharp turnaround in participation that can foreshadow an extended uptrend. Thrust signals start with a setup that shows very few stocks
Thrust Signals using %Above SMA Breadth – Theory, Practice, Reality Read More »

Developed by the late great Marty Zweig, the Zweig Breadth Thrust uses advance-decline data to identify material shifts in participation. This indicator sets up with when the advance-decline data becomes oversold and triggers when there is a sharp broadening in upside participation (advancing stocks). It is a time sensitive indicator that must trigger within a 10 day window.
Zweig Breadth Thrust – NYSE Original – Modern Version AD% Read More »
Today’s report starts with the Zweig Breadth Thrust, which failed to trigger for the S&P 500, but remains a possibility for the S&P 1500. Follow through in the coming days is needed to trigger. We then turn to detailed analysis of SPY, which is below its falling 200-day SMA and near short-term resistance. Stocks are still broadly out of favor with eight of the eleven sectors
Market & ETF Report – Thrust Shortfall – SPY Resistance – Defensive Groups Lead Read More »
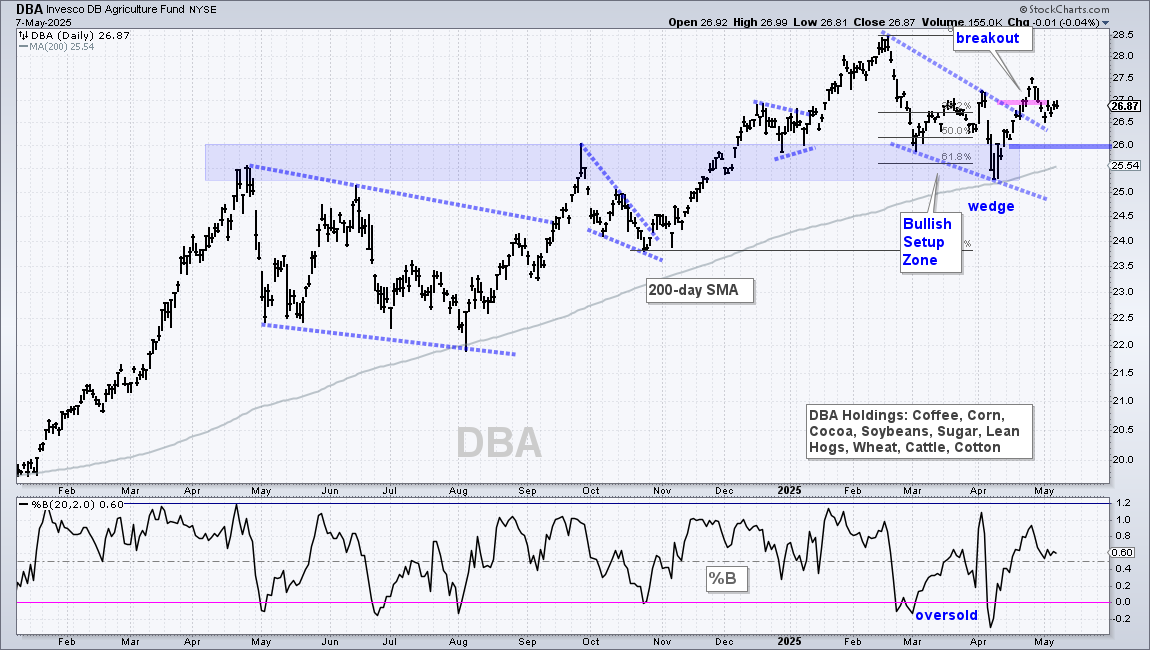
The weight of the evidence remains bearish, but stocks are currently experiencing an oversold bounce. This video will show upside targets and show what it takes to go from a bear market bounce to a bullish breadth thrust. Attention then turns to nine equity ETFs that are holding up the best, including two tech-related ETFs. In the alternative asset group, Bitcoin broke out and the DB Agriculture ETF is making a move. Gold is going parabolic and getting dangerous.

Short-term breadth became oversold on April 4th and stocks surged on April 9th with SPY gaining 10%. SPY then fell 6.5% into Monday and became short-term oversold again. Stock rebounded on Tuesday with SPY gaining 2.6%. Trading is very choppy, but SPY is currently experiencing an oversold bounce. This is still considered a bear market bounce because the market regime indicators are net bearish and we have yet to see a bullish breadth thrust.
Stocks Surge, but Was it Enough for a Breadth Thrust? Read More »
The long-term trends and breadth charts have been net bearish since mid March. SPY, QQQ and the S&P 500 EW ETF (RSP) are in long-term downtrend since early-mid March. Six of the nine breadth indicators were bearish as of mid March. The bond market and Fed policy are the wild cards.
Market Regime – Weighing the Evidence using Trends, Breadth and Yield Spreads Read More »
The next report/video will be on Wednesday, April 23rd. Short-term, the stock market is like the silver ball in a
Manipulation and Volatility – Downtrend and Bear Market – Volume Spikes – Bitcoin Read More »

Trading is all about the odds. Trade when the odds are in your favor. Exercise patience and stand aside when the odds are NOT in your favor. Stocks are in a bear market and the vast majority of names are trading below their 200-day SMAs. Clearly, the odds are NOT in our favor for equities and equity ETFs. Traders need to look elsewhere. Today’s report will highlight some non-equity leaders and analyze Bitcoin as it sets up.
Equities? Fuhgeddaboudit! Alternative Assets are Leading Read More »
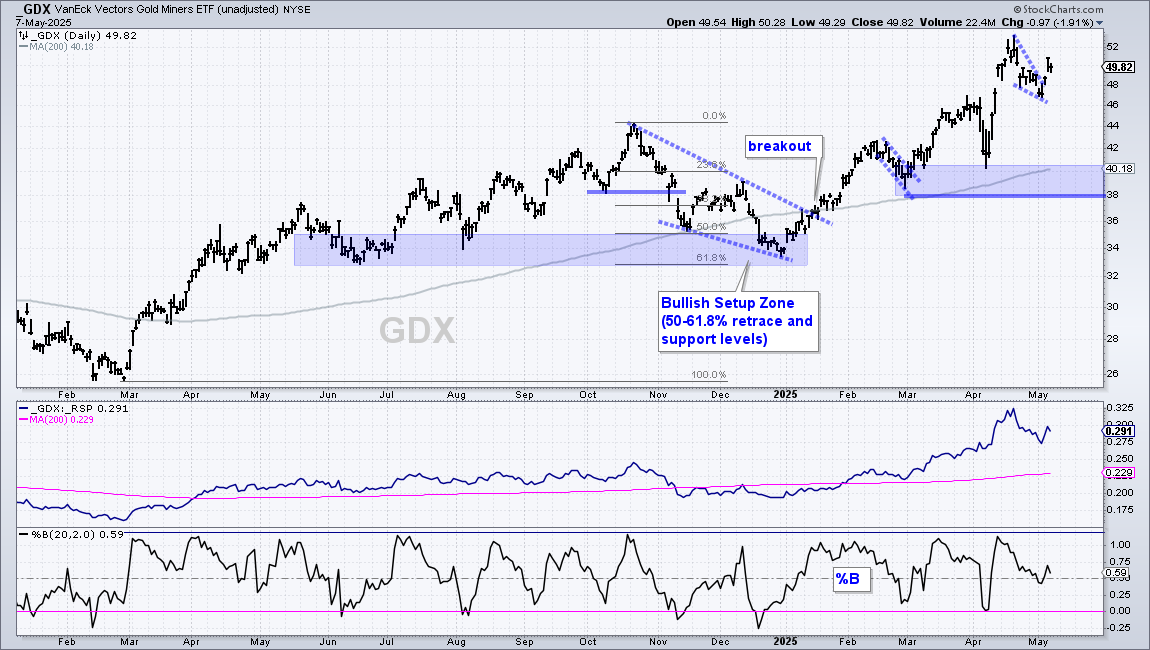
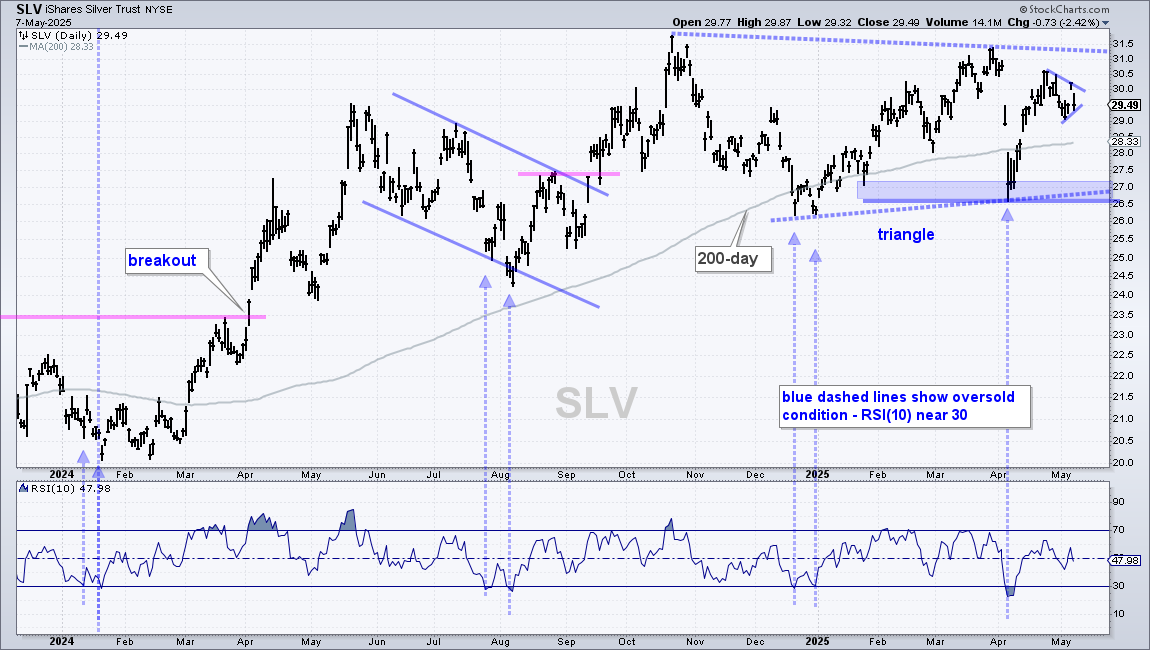
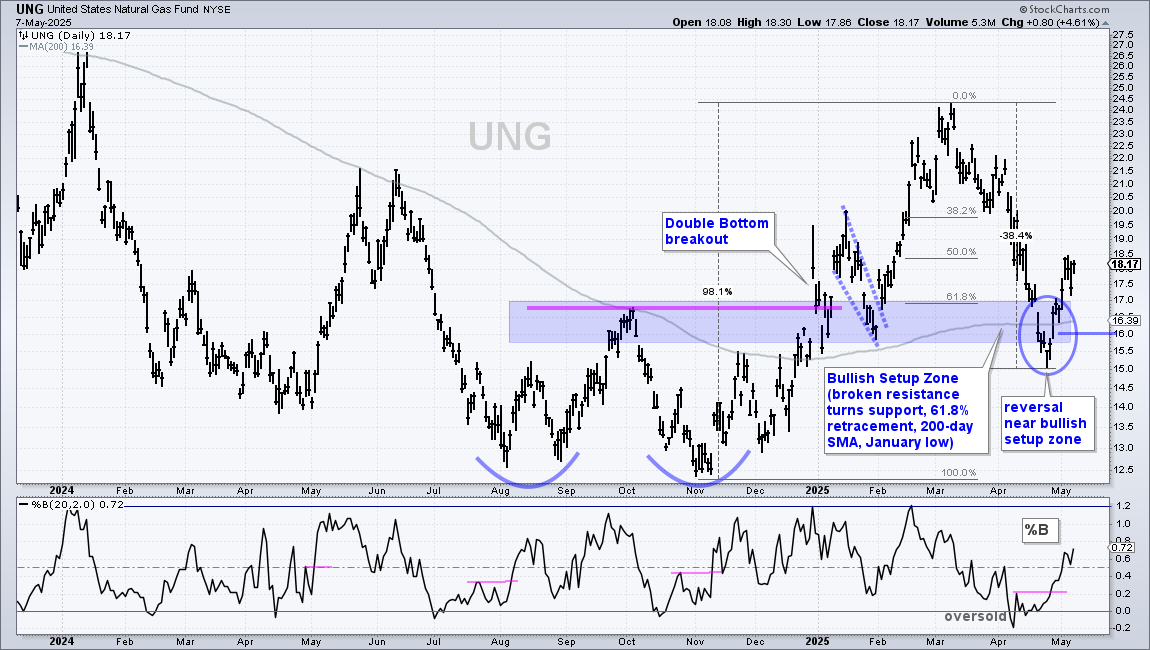
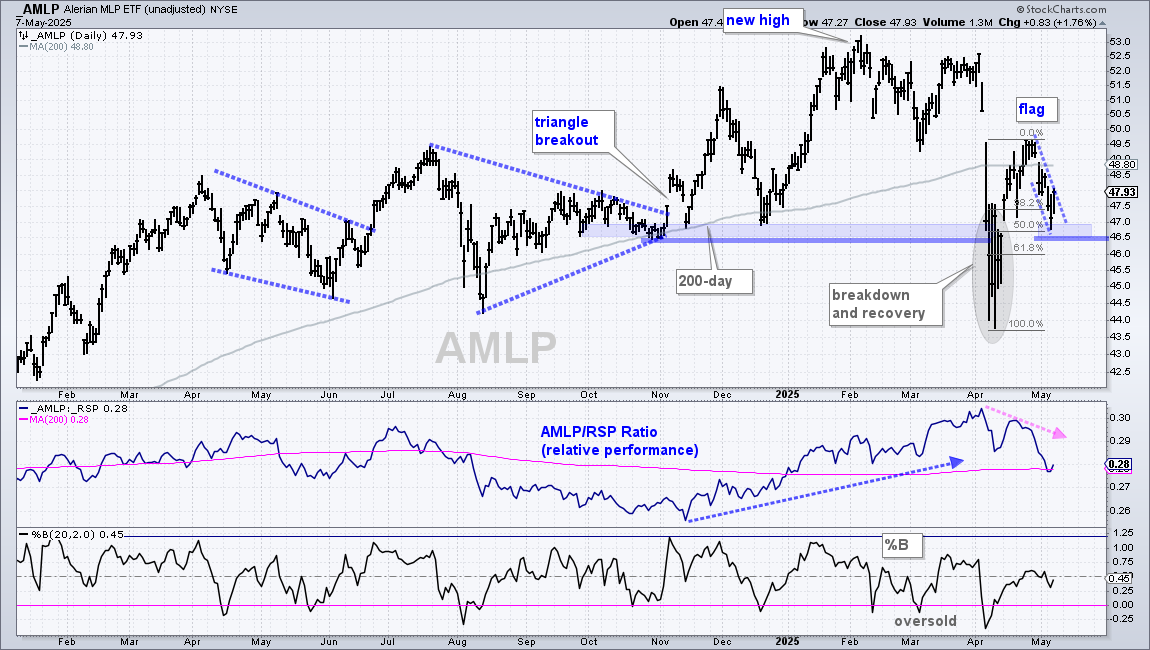
Today’s report will focus on some commodity-related ETFs for two reasons. First, we are in a bear market for stocks. Second, these ETFs are in uptrends. Despite these uptrends, volatility is increasing in this group as well. There is no escaping volatility these days. We will also cover Bitcoin because it is an alternative asset that is setting up.
The weight of the evidence remains bearish. Stocks are in the midst of an oversold bounce, but we have yet to see follow through strong enough to trigger a bullish breadth thrust. SPY and QQQ are in long-term downtrends and near short-term resistance levels after their oversold bounces, which creates a precarious situation. In fact, several ETFs are hitting resistance levels after oversold bounces. Some ETFs are even showing relative strength, but this really means “less weakness”. Gold remains the ultimate safe-haven and Bitcoin has a bullish failure swing working.
Even with the big rebound last week, the vast majority of stocks are below their 200 and 150 day SMAs. Only 23% of S&P 1500 stocks are above their 200-day SMAs (77% below), and only 20% are above their 150-day SMAs (80% below). New lows expanded last week with over 30% of S&P 1500 stocks hitting 52-week lows.
Market Regime – Weighing the Evidence using Trends, Breadth and Yield Spreads Read More »
The weight of the evidence remains bearish for stocks and the bounce over the last four days is considered an oversold bounce. Our short-term breadth thrust indicators have yet to trigger. Until these indicators trigger, I will consider this a bear market bounce. This means negative outcomes are still more likely than positive outcomes. Resistance zones are more likely to hold and support levels are more likely to be broken. In short, risk in stocks remains above average. See this report for an update on the thrust indicators..