Video and Report Headlines
- %Above 200-day Remains Bullish
- 26-wk High-Low Percent Remains Bullish
- 4wk High-Low Percent is Bullish, but Mixed
- SPY and QQQ Hit New Closing Highs
- S&P MidCap 400 SPDR Corrects within Uptrend
- Healthcare SPDR Breaks Out of Triangle
- Merck and Thermo Fisher Setting Up
- Cybersecurity ETF Corrects to 40wk SMA
- CheckPoint and CyberArk Break Out of Corrections
- Palo Alto Extends on Post-Earnings Recovery
The next Chart Trader will be posted on Thursday morning, June 13th.
The weight of the evidence is bullish for the long-term, but the short-term evidence is a bit mixed. SPX 4wk HiLo% plunged below -30% on May 29th, but NDX 4wk HiLo% did not confirm this signal. Thus, the combo remains net bullish and supports the short-term uptrends in SPY and QQQ. The stock market advance over the last five weeks was rather narrow and I am watching the S&P MidCap 400 SPDR for signs of broadening. Mid-caps and small-caps peaked in mid May and fell the last three weeks. Elsewhere, we can expect some fireworks in the bond market because the Fed starts its two-day meeting today, CPI and the policy statement are on Wednesday and PPI is on Thursday.
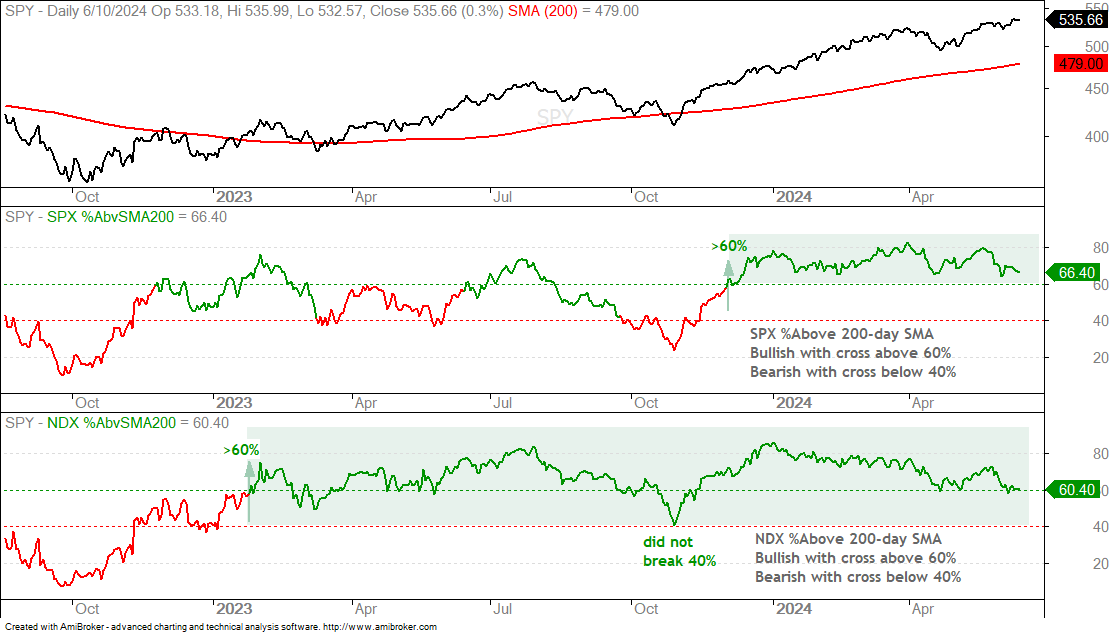
%Above 200-day Remains Bullish
for the S&P 500 and Nasdaq 100. SPX %Above 200-day is at 66.4% and has been above 60% since December 1st. No problem here. It is bullish until a cross below 40%, which is nowhere close. NDX %Above 200-day SMA fell to around 60% and we are seeing less strength within the Nasdaq 100. Nevertheless, more stocks are above their 200-day SMAs than below and this is net bullish.
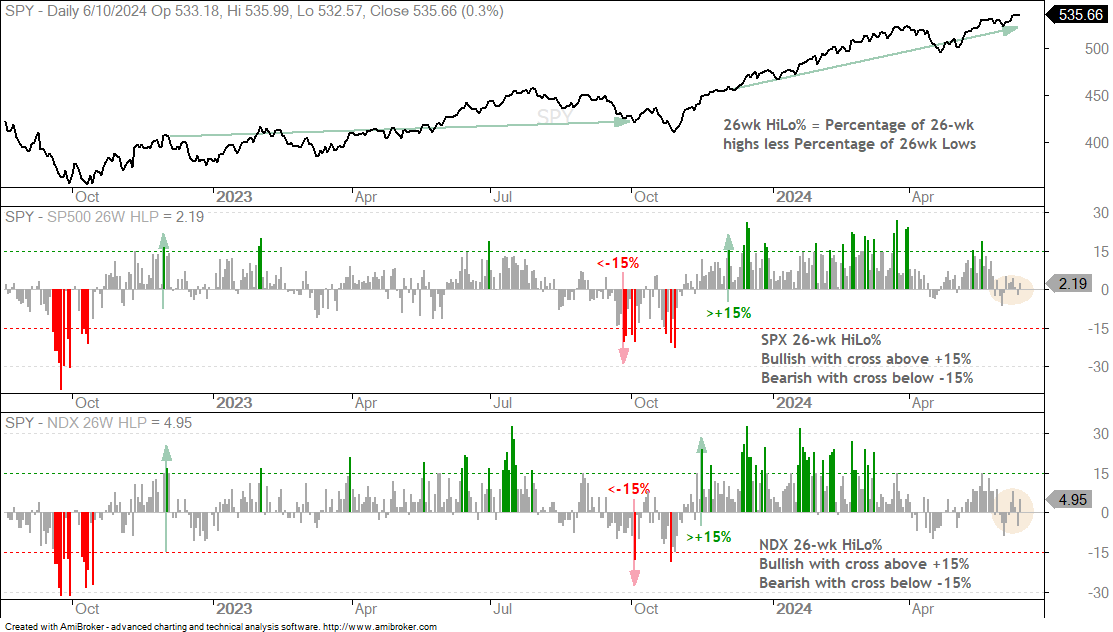
26-wk High-Low Percent Remains Bullish
26-wk High-Low Percent is the percentage of stocks making 26-week highs less the percentage making 26-week lows. SPX 26wk High-Low Percent turned bullish with a move above +15% on December 1st and NDX 26wk High-Low Percent turned bullish with a move above +15% on November 14th. They remain bullish until a cross below -15%. SPY and QQQ powered to new highs here in early June, but 26-wk HiLo% remains subdued as fewer stocks hit fresh 26-wk highs (yellow ovals). Upside participation is waning, but we have yet to see a surge in 26-wk lows that would push the indicator into negative territory.
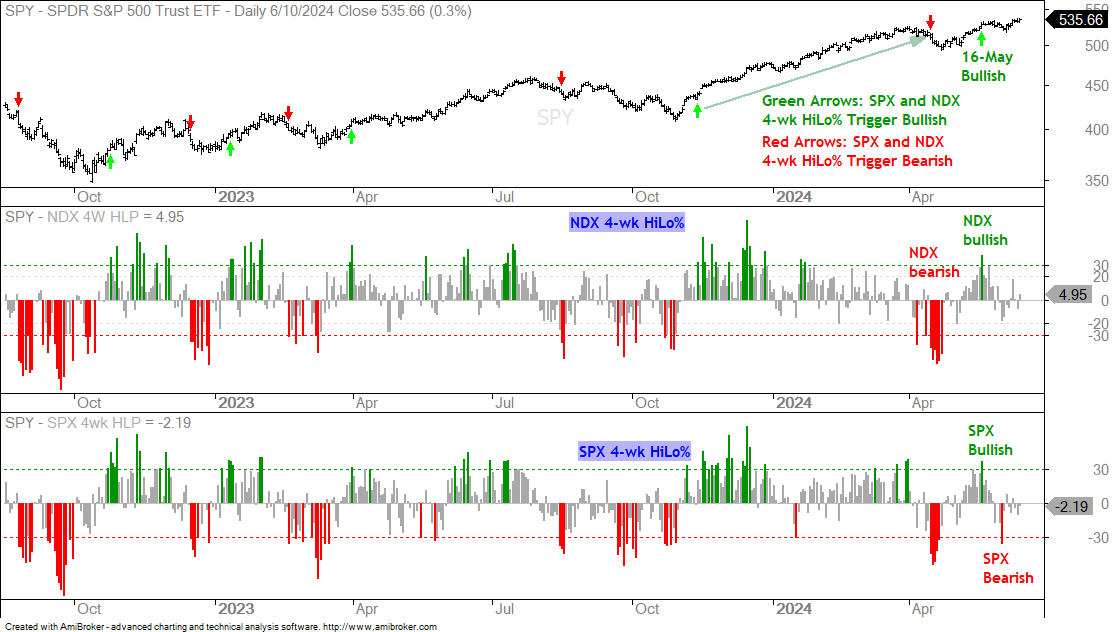
4wk High-Low Percent is Bullish, but Mixed
The next chart shows 4wk High-Low Percent for the S&P 500 and Nasdaq 100. These indicators are for short-term trend timing. An uptrend signals when BOTH exceed +30% and a downtrend signals when BOTH break below -30%. The red and green shadings show some signals for each index. A bullish signal triggered on May 16th when both surged above +30%. SPX 4wk High-Low Percent plunged below -30% last week to turn bearish. This signal has yet to be confirmed by NDX 4wk High-Low Percent. Thus, the combo signal remains bullish. A plunge below -30% on NDX HiLo% would turn the indicator combo bearish and argue for a correction in the broader market.
SPY and QQQ Hit New Closing Highs
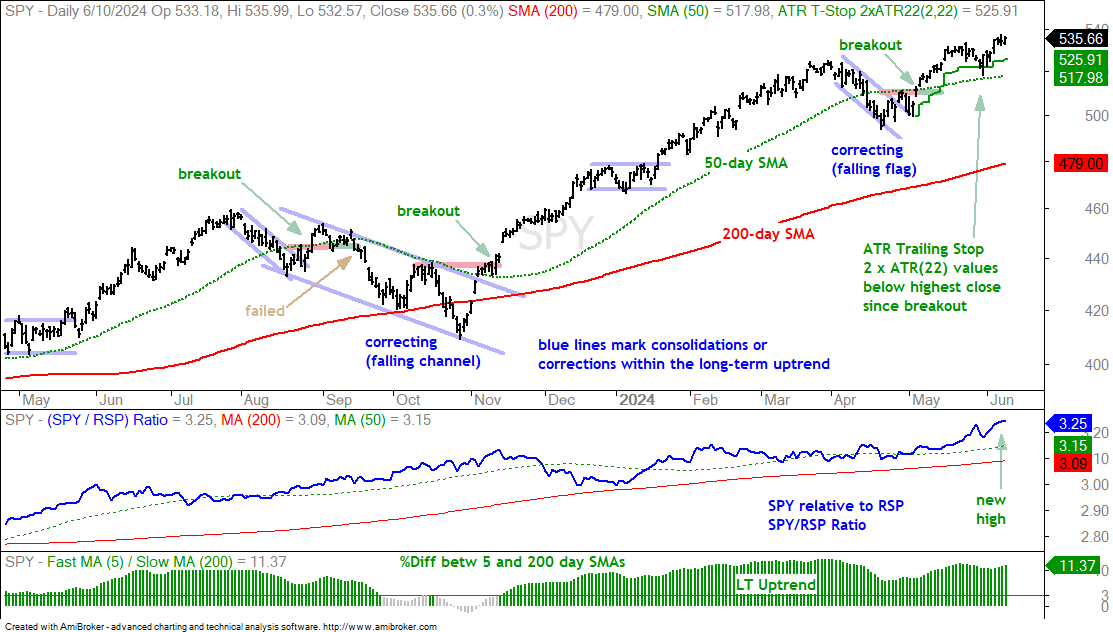
Large-caps and large-cap techs are not to be denied. SPY hit a new high last week and a new closing high on Monday. Overall, the long-term trend is clearly up with price well above the rising 200-day SMA. Short-term, SPY broke out on May 3rd and continues to extend on this breakout. There was a short pullback in late May and then another push higher last week. SPY is in the post-breakout extension phase and there is no setup on this chart. The solid green line marks the ATR Trailing Stop (2xATR(22)) at 525.91. Note that this stop starts with the May 3rd breakout. The middle indicator window shows the SPY/RSP ratio hitting a fresh new high as large-caps continue to outperform the S&P 500 Equal-weight ETF (RSP).
The story is the same for QQQ. The long-term trend is up with QQQ hitting new highs the last few days and price well above the rising 200-day SMA. Short-term, QQQ corrected into late April and broke out in early May. Price is currently extending on this breakout and there is no setup on this chart. A setup is a short-term corrective pattern, such as the falling flag. The solid green line marks the ATR Trailing Stop (2.5 x ATR(22)) at 451.1 for reference. The middle window shows the QQQ/RSP ratio hitting a new high as QQQ continues to lead the market.
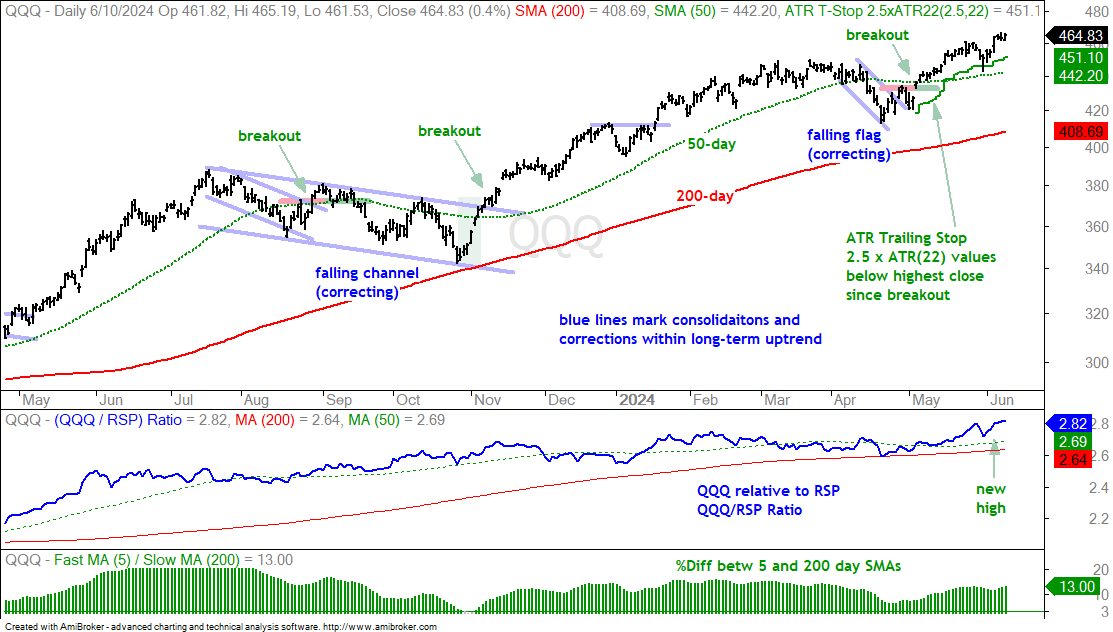
Chart Analysis, Setups and Trading Ideas
The following charts show price bars with the 200-day SMA (red line), the 50-day SMA (green line), the price-relative (ITB/RSP ratio) with the 200-day SMA and the percentage difference between the 5 and 200 day SMAs. On the price chart, I am looking for tradable pullbacks within a bigger uptrend or bullish consolidation patterns. With the price-relative, I am looking for relative strength. The price-relative (ITB/RSP ratio) rises when the ETF or stock outperforms. And finally, the percentage difference between the 5 and 200 day SMA is bullish (long-term uptrend) with a move above 3% and stays bullish until a move below -3%. This basically measures the tide or long-term bias.
S&P MidCap 400 SPDR Corrects within Uptrend
Mid-caps are the next level down in the pecking order (large-caps, mid-caps, small-caps and micro-caps). I am not a big fan of small-caps because risk does not justify reward. Mid-caps occupy a sweet spot in the market because they grew enough to get out of the small-cap universe, but they are not big enough to be large-caps. Perhaps they are on their way. Breadth is waning and this is weighing on small-caps and mid-caps. Large-caps are not affected by breadth because the top ten stocks account for around 35% of SPY. The top ten stocks account for 50% of QQQ. We can watch mid-caps and small-caps for signs that the bull market is broadening.
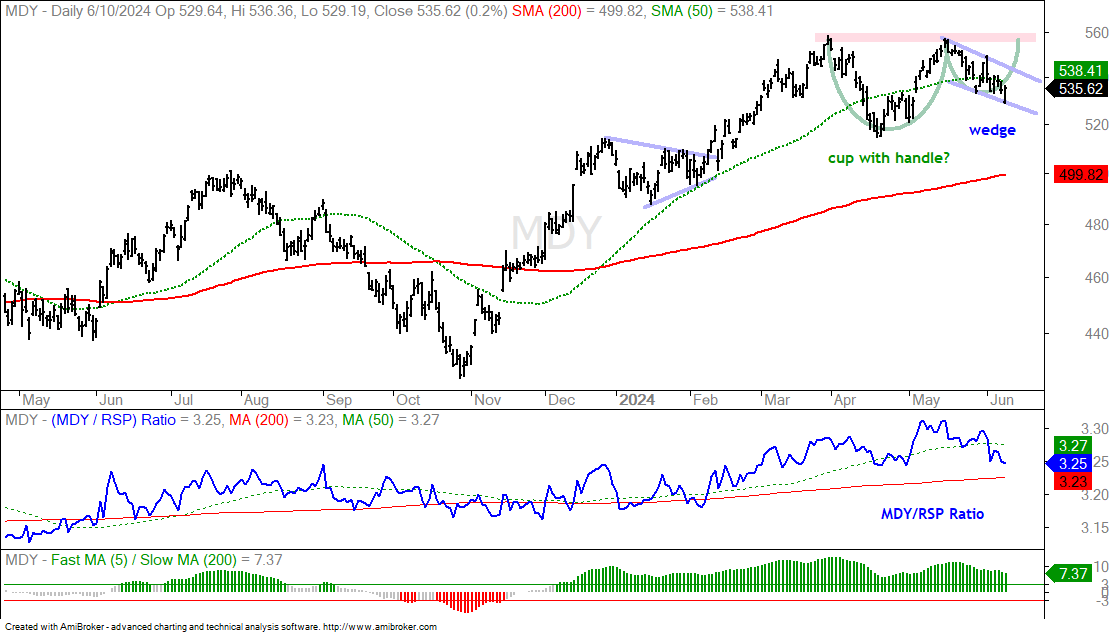
The chart below shows the S&P MidCap 400 SPDR (MDY) in a long-term uptrend. Price is above the rising 200-day SMA and the ETF hit a new high in April. Shorter term, MDY consolidated within this uptrend with a possible cup-with-handle forming (green lines). This is a bullish continuation pattern and a break above rim resistance (red shading) would confirm the pattern. The handle looks like a falling wedge, which marks a correction after the advance from mid April to mid May. A falling wedge breakout at 545 would signal a continuation higher and increase the odds of a bigger breakout.
Healthcare SPDR Breaks Out of Triangle
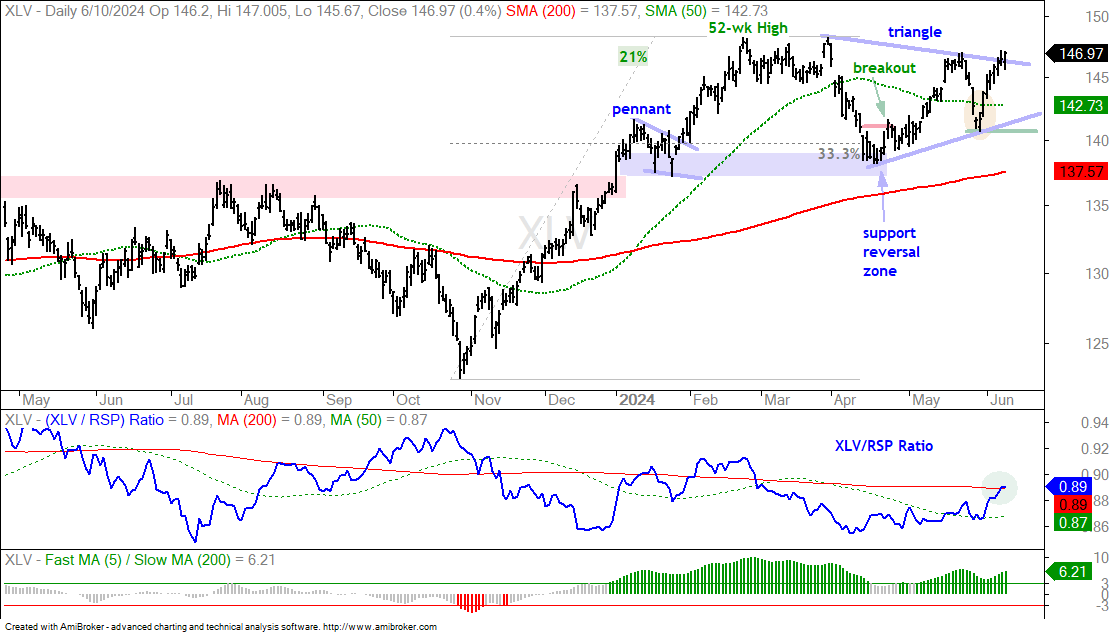
The Healthcare SPDR (XLV) surged 2.34% in June and is the third strongest sector this month. The Technology SPDR (XLK) is up 5.18% and the Communication Services SPDR (XLC) is up 3.47%. Overall, XLV is in a long-term uptrend and breaking out of a triangle consolidation. The ETF surged 21% from late October to mid February and hit a new high. XLV then embarked on a consolidation period to digest these gains. The ETF hit a Support-Reversal Zone in late April and featured in ChartTrader on May 2nd with a short-term breakout. Trading turned a bit volatile the last four weeks as XLV dipped below the 50 day SMA (green dashed line) and quickly recovered. Overall, I view the triangle as a consolidation within a bigger uptrend and the breakout signals a continuation of this uptrend. The late May low marks first support at 140.
Merck and Thermo Fisher Setting Up
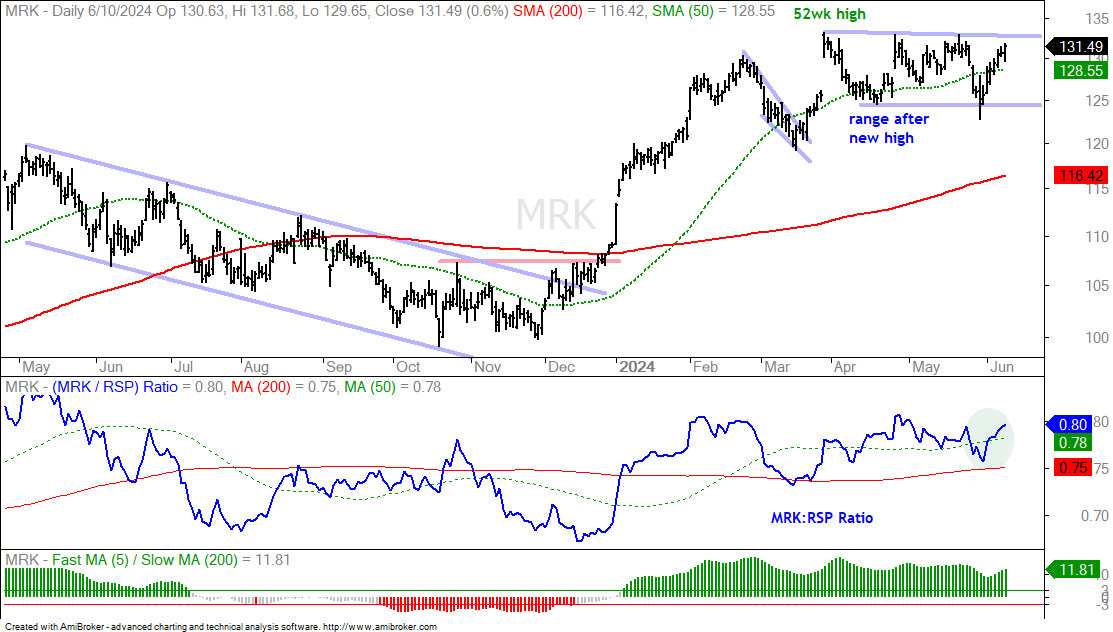
Eli Lilly is the big leader within the Healthcare sector as it broke out to new highs over the last few weeks. This stock has not lost any weight because it accounts for a 12.35% of XLV. Note that LLY featured in ChartTrader on May 14th as it consolidated within a bigger uptrend. I also featured Merck (MRK) on May 14th and this stock remains within a bullish continuation pattern. MRK surged to a new high in early April and then moved into a trading range. It is not really a flag, but it is a consolidation within an uptrend and this makes it a bullish continuation pattern. Short-term, MRK surged back above its 50-day SMA (green dashed line). The stock is poised to challenge resistance and a breakout would signal a continuation of the uptrend.
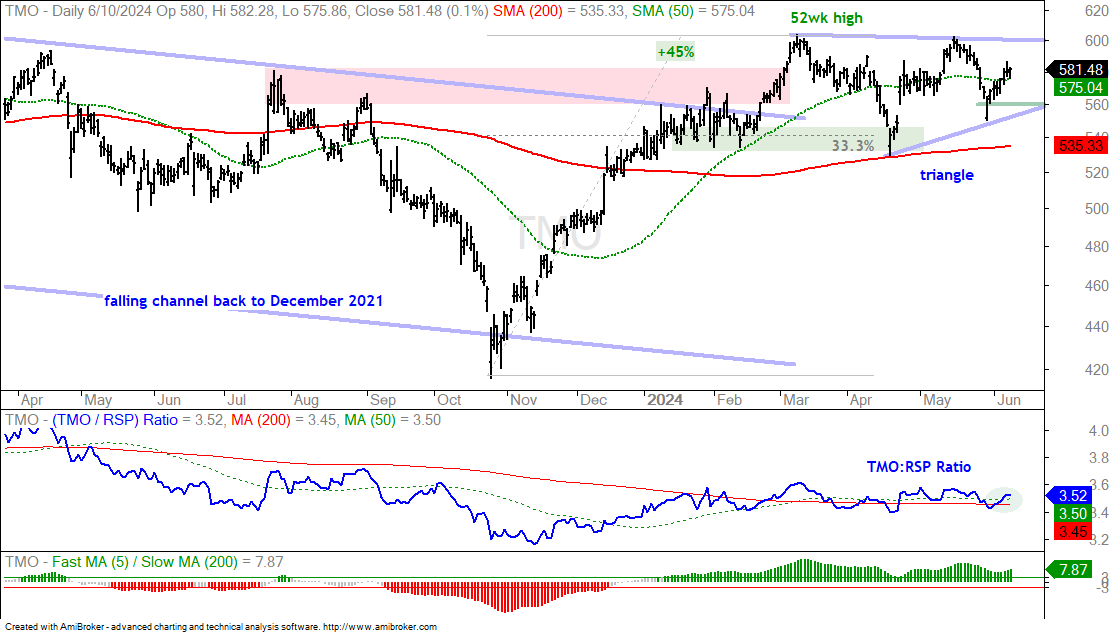
The next chart shows Thermo Fisher (TMO) with a 45% advance and new highs in March. TMO fell back to the 200-day SMA with a correction into April. Notice that this correction retraced 33% and found support near the low from late January to early February (green shading). The stock surged off this Support-Reversal Zone, but hit resistance from the March high as it fell back in the second half of May. With a bounce back above the 50-day SMA, I view the overall pattern as a triangle within a bigger uptrend. This consolidation is a bullish continuation pattern and a breakout at 600 would signal a continuation higher. With the recent bounce above the 50-day, I think the odds of a breakout are increasing. A close below 560 would call for a re-evaluation.
Cybersecurity ETF Corrects to 40wk SMA
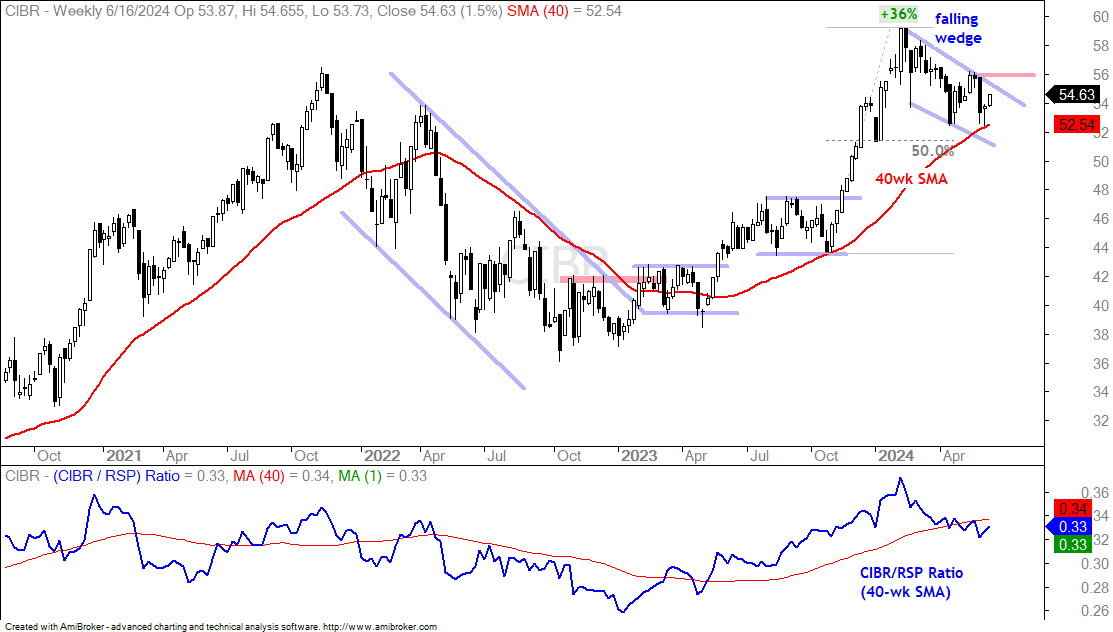
The next chart shows weekly candlesticks for the Cybersecurity ETF (CIBR) with the 40-week SMA (red). The long-term trend is still up because CIBR is above the rising 200-day SMA. However, the ETF peaked way back in February and fell the last three months. I am showing a weekly chart to put this into perspective. Notice that CIBR was up 36% from late October to February. A corrective period after a huge move is normal. A falling wedge formed an this decline retraced 33-50% of the prior advance. Both the pattern and the retracement amount are normal for corrections. A breakout at 56 would reverse the falling wedge and signal a resumption of the bigger uptrend. The indicator window shows the CIBR/RSP ratio falling below its 40-wk SMA. A break back above would show a return to relative strength.
CheckPoint and CyberArk Break Out of Corrective Patterns
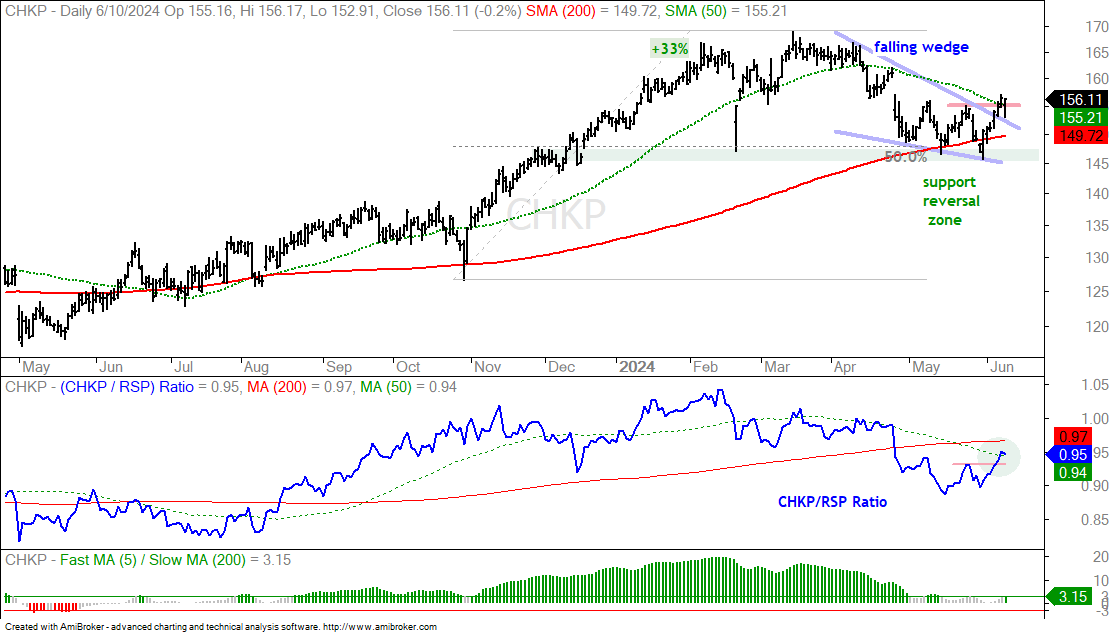
Within the cybersecurity group, Crowdstrike (CRWD) is the clear leader as it surged to a fresh 52-week high on Monday. I am seeing breakouts in CheckPoint (CHKP) and CyberArk (CYBR). Palo Alto (PANW) is alsoperforming well. The first chart shows CHKP advancing 33% and then correcting with a falling wedge. This wedge retraced half of the 33% advance and returned to the 200-day SMA. It also found support near the December consolidation and February low (green shading). The support levels and retracement formed a Support-Reversal Zone around 145-147. With a surge the last two weeks, the stock broke out of the wedge and this signals a continuation higher. I would use the 200-day SMA (red line) as a re-evaluation level.
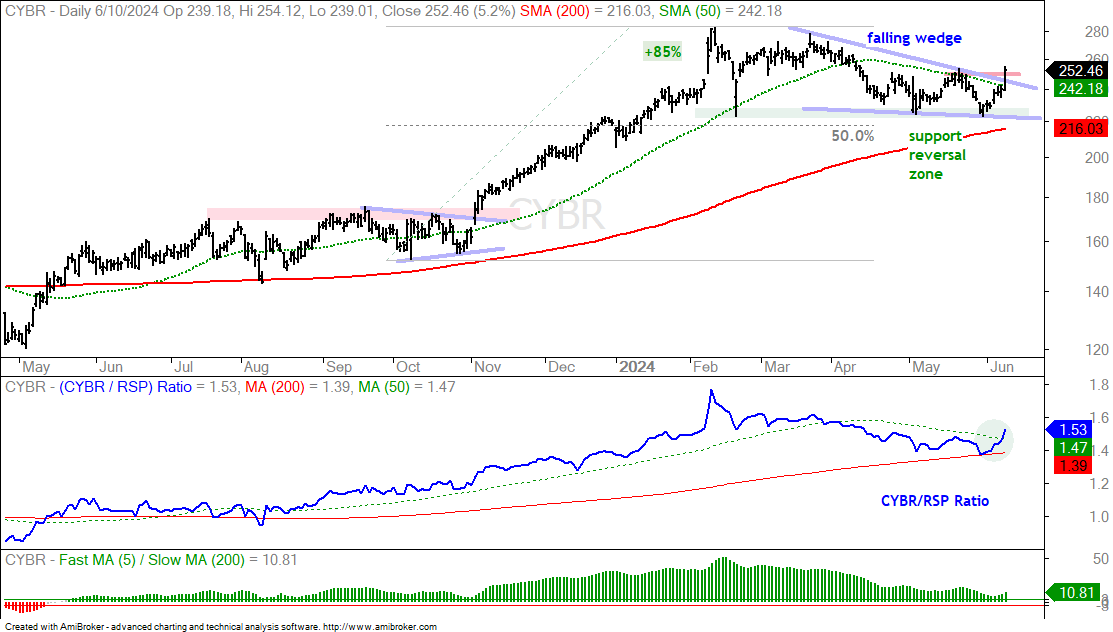
The next chart shows CyberArk (CYBR) with a similar setup. A falling wedge retraced 33-50 percent of the prior advance. CYBR hit the Support-Reversal Zone in May and broke out with a big move on Monday. This breakout signals an end to the corrective period and a resumption of the bigger uptrend. The middle windows shows the CYBR/RSP ratio turning up as CYBR starts to outperform the broader market.
Palo Alto Extends on Post-Earnings Recovery
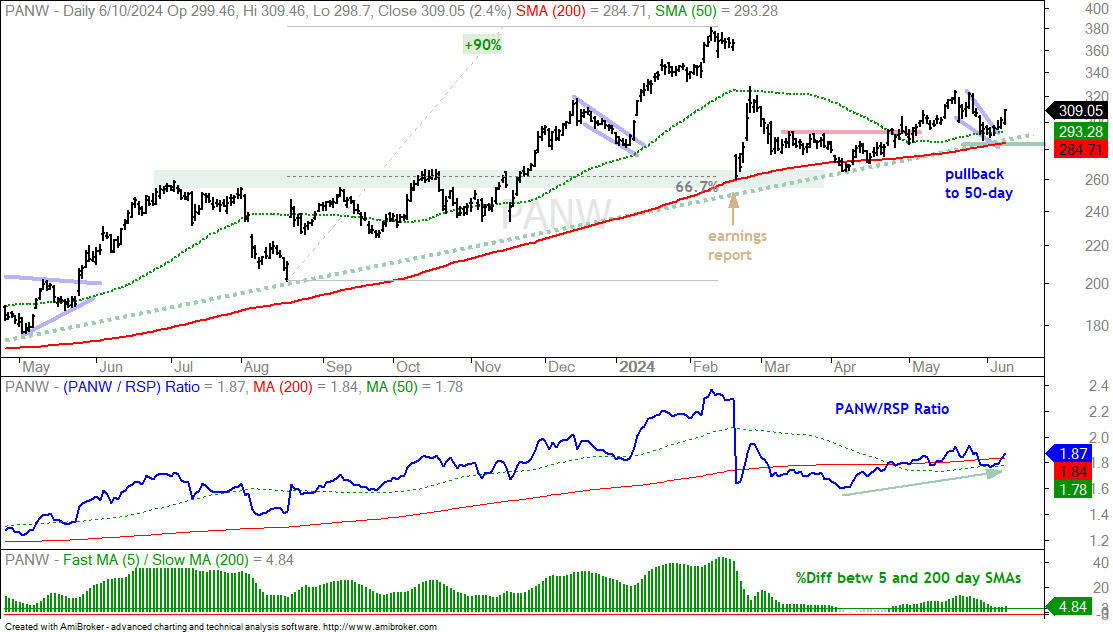
Palo Alto (PANW) was leading the cybersecurity group in mid February, but plunged 28% on February 21st after an earnings report. Guess it disappointed. The stock rebounded the last five days with a move back to the 50-day and then fell back to the 200-day in mid April. It has since worked its way higher and held above the 200-day SMA since April 16th. Overall, I still see a long-term uptrend on this chart. The trendline extending up from the May 2023 low is holding and the 5/200 Differential remains bullish (bottom window). Short-term, the stock pulled back to the 50-day (green dashed line) in late May and popped the last five days. I see a short-term breakout in the works. This little pop also reinforces support at the 200-day SMA (red line), which acts as the re-evaluation for this uptrend. The middle window shows the PANW:RSP Ratio working its way higher since early April and it is back above the 200-day (red line).