The next Chart Trader will be posted on Tuesday morning, June 19th.
The Fed and CPI are in the past and large-cap techs continue to lead the market highs. SPY, QQQ, MAGS, the Technology SPDR, the Communication Services SPDR and the Semiconductor ETF (SOXX) hit 52-week highs to lead the market. Small-caps and the S&P 500 EW ETF (RSP) are still lagging, but this weakness is not affecting the large-cap tech trade. Breadth is not an effective tool for SPY and QQQ because these two are driven by a 7-10 large-cap tech-related stocks. Elsewhere, the 20+ Yr Treasury Bond ETF is battling its breakout zone and the crypto names are holding their breakouts. We will also look at TradeDesk, Advanced Micro Devices and Edwards Life Sciences.
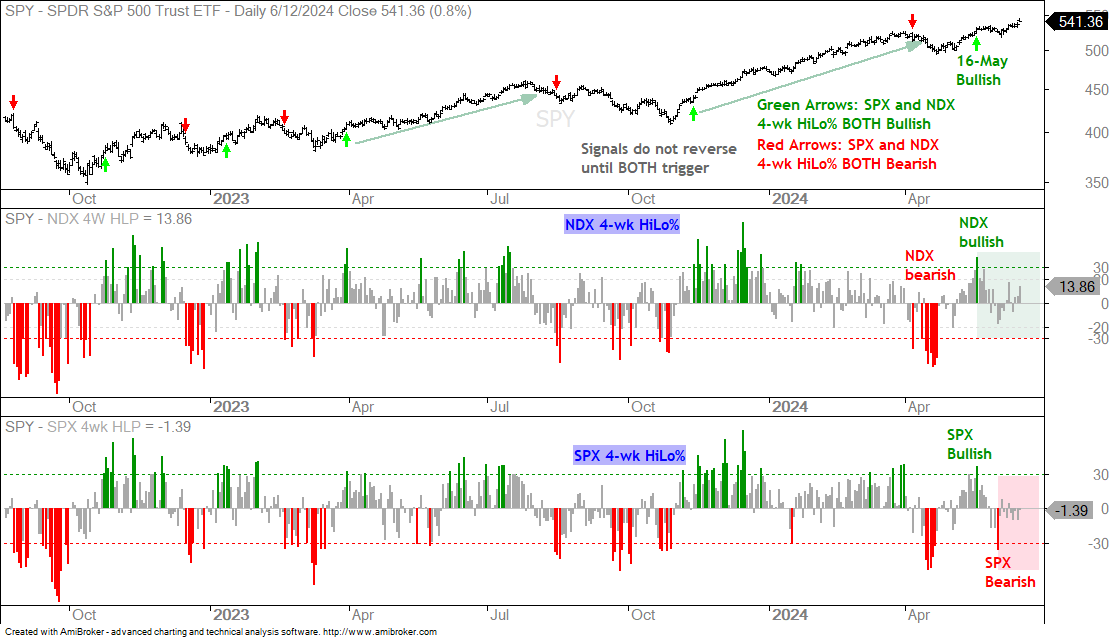
4wk HiLo% Combo Remains Bullish
4wk HiLo% remains split because the S&P 500 has an active bearish signal (< -30%) and the Nasdaq 100 has an active bullish signal (> +30%). This pair triggered bullish on May 16th and both must trigger bearish to reverse this signal. In other words, the bullish signal remains until both exceed -30%. Nasdaq 100 stocks account for around 35% of the S&P 500 and they are powering the market right now.
SPY, QQQ and MAGS Hit New Highs
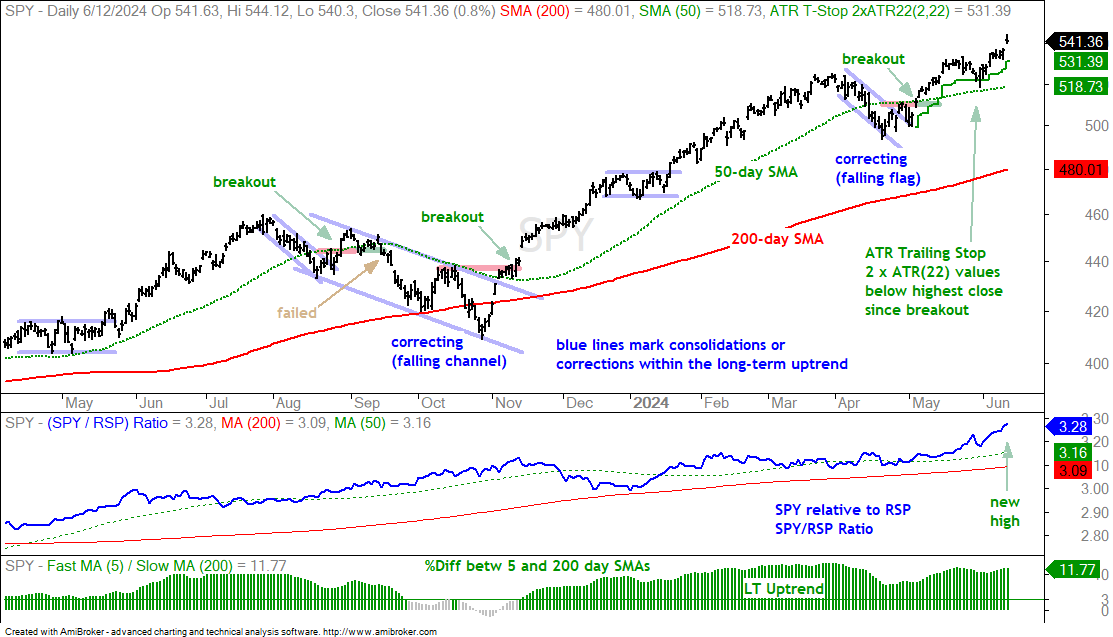
There is no change with SPY as the ETF gapped above 541 on the open and closed above 541. SPY notched another new high and further extended on its May 3rd breakout. One could suggest that SPY is short-term overbought because it is up 9.5% since mid April, but overbought conditions are not really an issue within an uptrend. How many times have we seen SPY become overbought and remain overbought? Furthermore, overbought is not a signal or setup when the bigger trend is up. Oversold conditions, on the other hand, provide signals and setups when the bigger trend is up. SPY is simply in a short-term uptrend without a tradable setup. With a new high, the ATR Trailing Stop (green line) rose to 531.39.
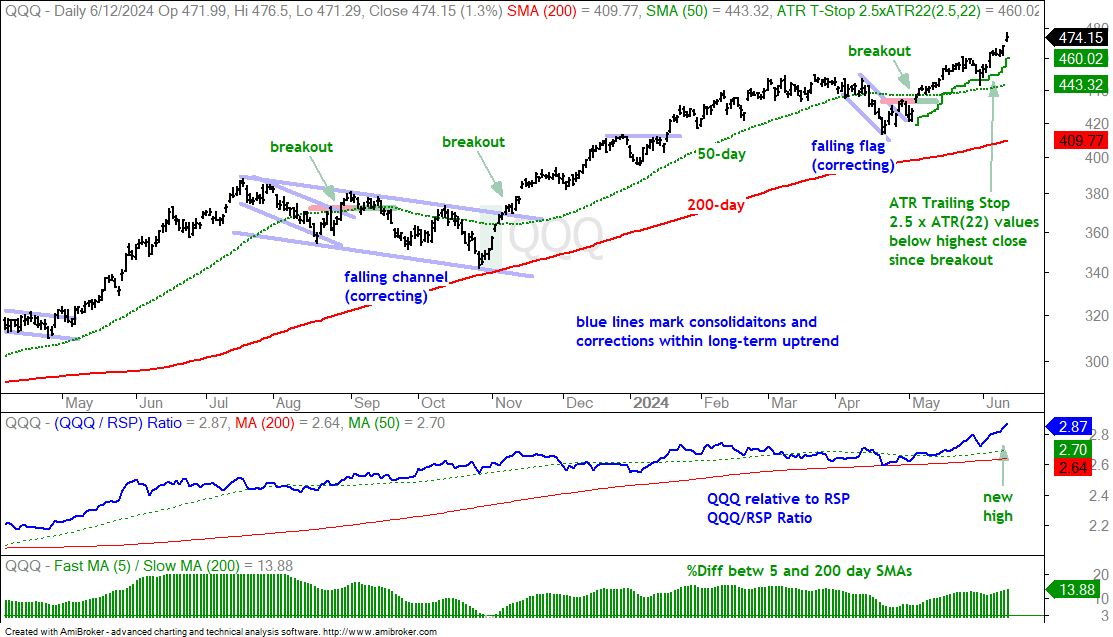
QQQ also gapped up and hit another new high. Semis powered the ETF higher as all three semiconductor ETFs hit new highs (SOXX, SMH, XSD). Several big semiconductor stocks also hit new highs (NVDA, AVGO, ASML, AMAT, KLAC, LRCX, MU, TSM, NXPI). As with SPY, there is no setup on this chart. QQQ is extending on its long-term and short-term uptrends. The solid green line marks the ATR Trailing Stop at 460.02.
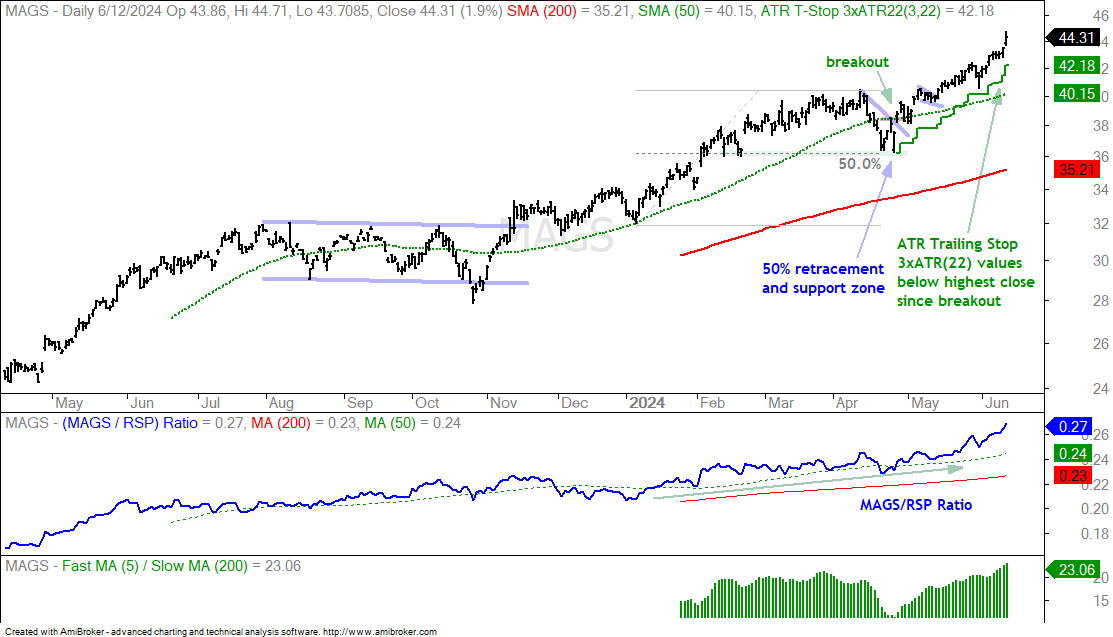
Perhaps we should add the MAG7 ETF (MAGS) to regular coverage because these seven stocks account for 42.5% of QQQ and around 32% of SPY. Tesla (TSLA) is by far the smallest weighting of the seven. Shareholders are currently voting on the $56 billion pay package for Elon Musk. Tesla has a market cap of $565.41 billion and this pay package is around 10% of the market cap! Returning to MAGS, the ETF broke out on April 26th and extended to new highs. There is no setup on this chart, just a leading uptrend. The ATR Trailing Stop starts on April 26th and the multiplier was 3 to place it just below the pre-breakout low. This stop is currently at 42.18.
The following charts show price bars with the 200-day SMA (red line), the 50-day SMA (green line), the price-relative (ITB/RSP ratio) with the 200-day SMA and the percentage difference between the 5 and 200 day SMAs. On the price chart, I am looking for tradable pullbacks within a bigger uptrend or bullish consolidation patterns. With the price-relative, I am looking for relative strength. The price-relative (ITB/RSP ratio) rises when the ETF or stock outperforms. And finally, the percentage difference between the 5 and 200 day SMA is bullish (long-term uptrend) with a move above 3% and stays bullish until a move below -3%. This basically measures the tide or long-term bias.
RSP Not Bearish, but Lagging SPY
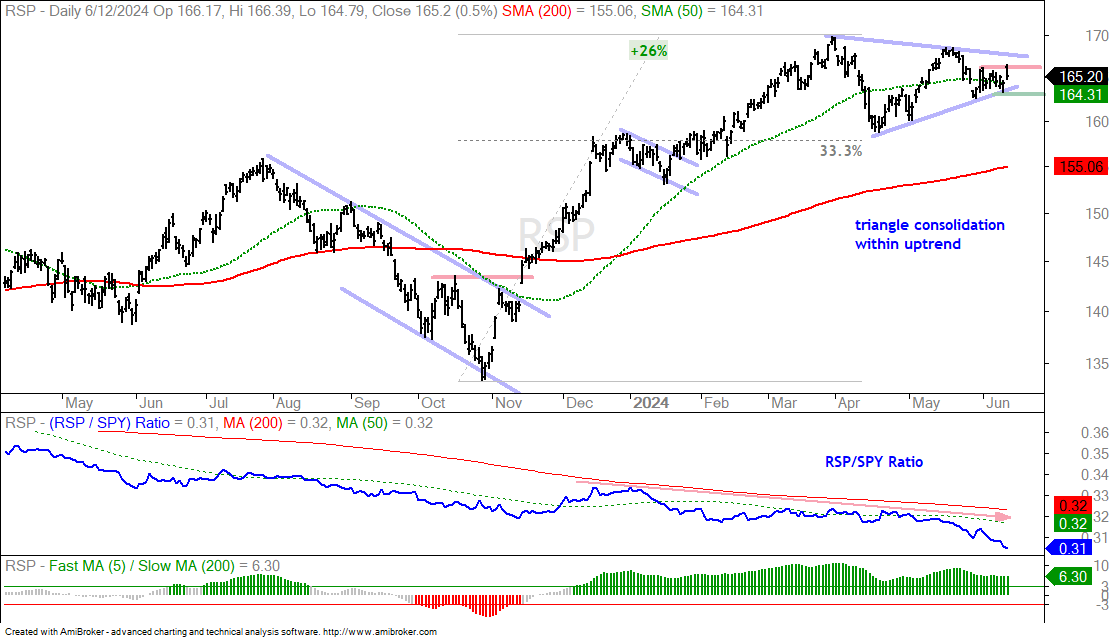
SPY and QQQ are hitting new highs, but the S&P 500 EW ETF (RSP) remains below its April and May highs. In fact, RSP formed lower highs as SPY forged ahead with higher highs. The performance discrepancy is pretty large as money piles into large-cap tech stocks and semis. Overall, I still see a triangle consolidation within a bigger uptrend. Technically, this is a bullish continuation pattern, but relative weakness is a concern. There are two levels to watch going forward. A close above 167 would trigger a short-term breakout and increase the odds of a triangle breakout. Such a move would suggest that the bull market is broadening (it is currently narrowing). Failure to break out and a support break at 163 would be bearish and argue for a test of the 200-day SMA (red line).
TLT Attempts to Hold Breakout
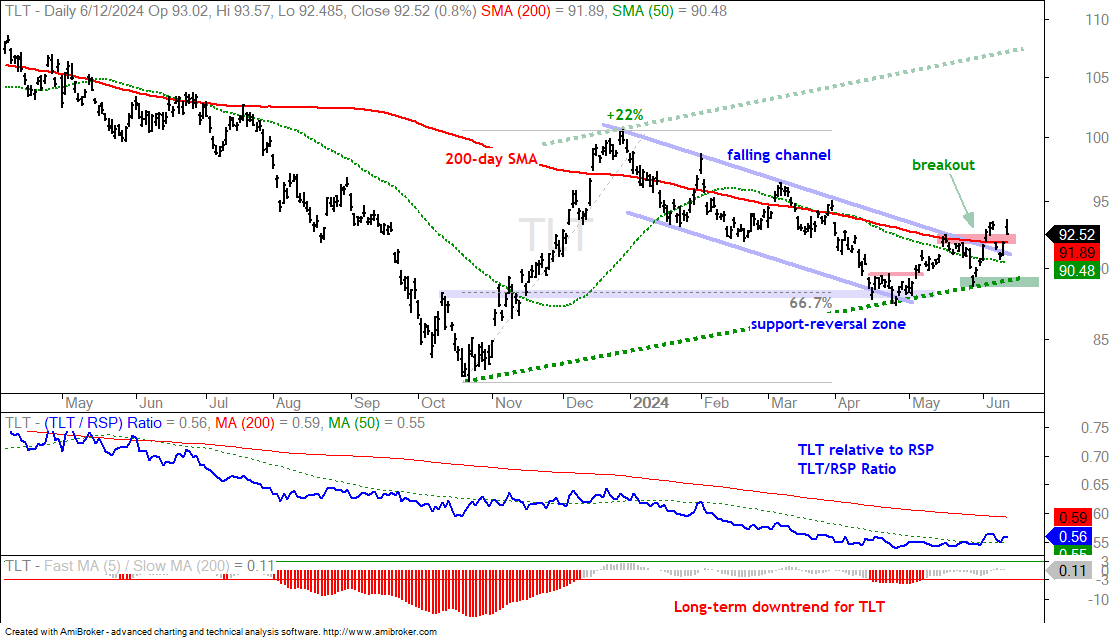
The 20+ Yr Treasury Bond ETF (TLT) broke out with a surge above 92 last week, but is having trouble extending on this breakout. Overall, TLT formed a falling channel as it retraced 67% of the prior advance and returned to the November breakout. The ETF hit a Support-Reversal Zone in late April and broke out with the advance into early June. This breakout signals a continuation of the October-December advance and targets a move to the 107-108 area. The low just before the breakout marks key support. A break below 89 would represent a total failure.
Monitoring the Breakouts in IBIT, COIN and BLOK
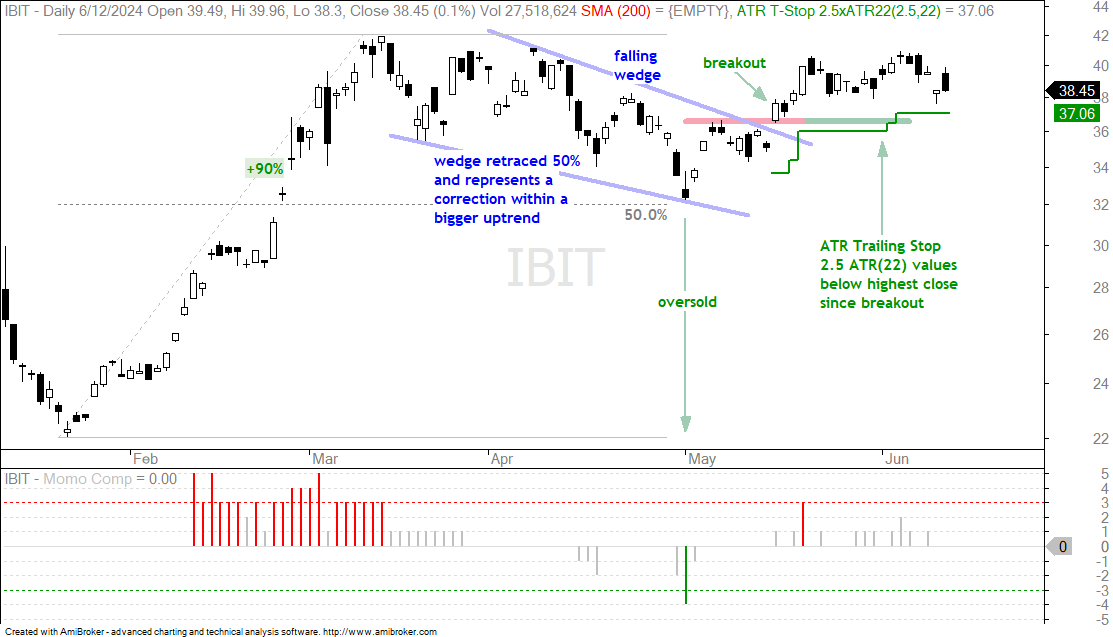
The next three charts cover the crypto world and they were first featured on May 28th. The Bitcoin ETF (IBIT) broke falling wedge resistance with a surge in mid May, but did not really follow through on this breakout. Even so, the breakout is holding and remains bullish until proven otherwise. It is now time to choose a level that would negate the breakout. First, we have broken resistance, which turns into the first support level (36.50). A strong breakout should hold and close below 36.50 would show cold feet. Second, there is the ATR Trailing Stop at 37.06. This stop started with the breakout and rose along with price into early June. A close below 37 would trigger this stop.
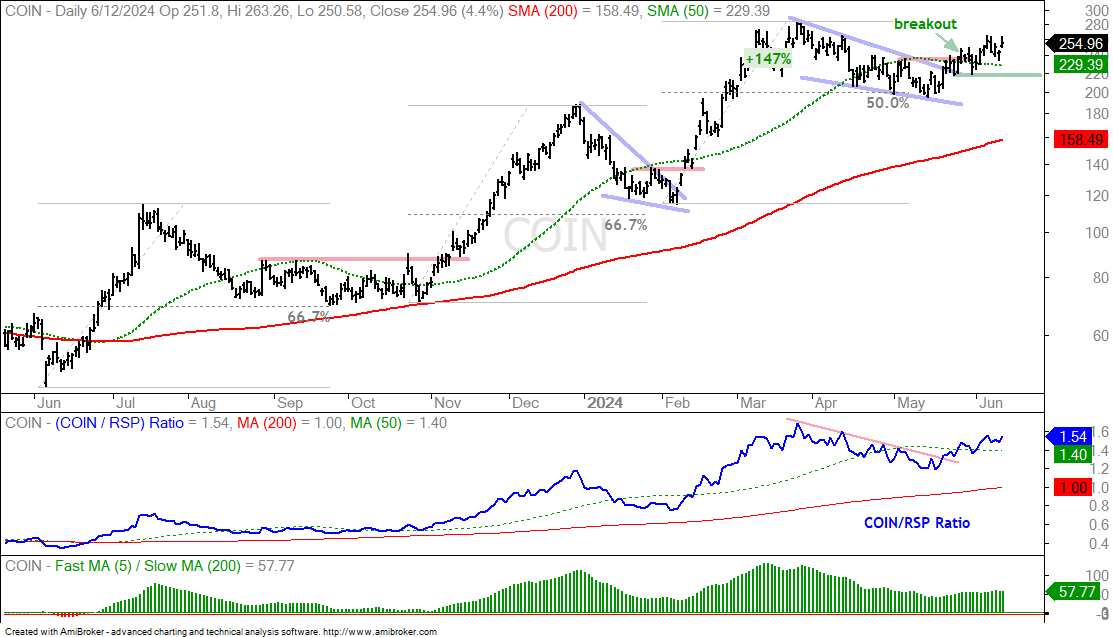
The next chart shows Coinbase (COIN) with a falling wedge breakout and short extension higher. The lows in late May and early June mark first support at 217. A close below this level would negate the breakout.
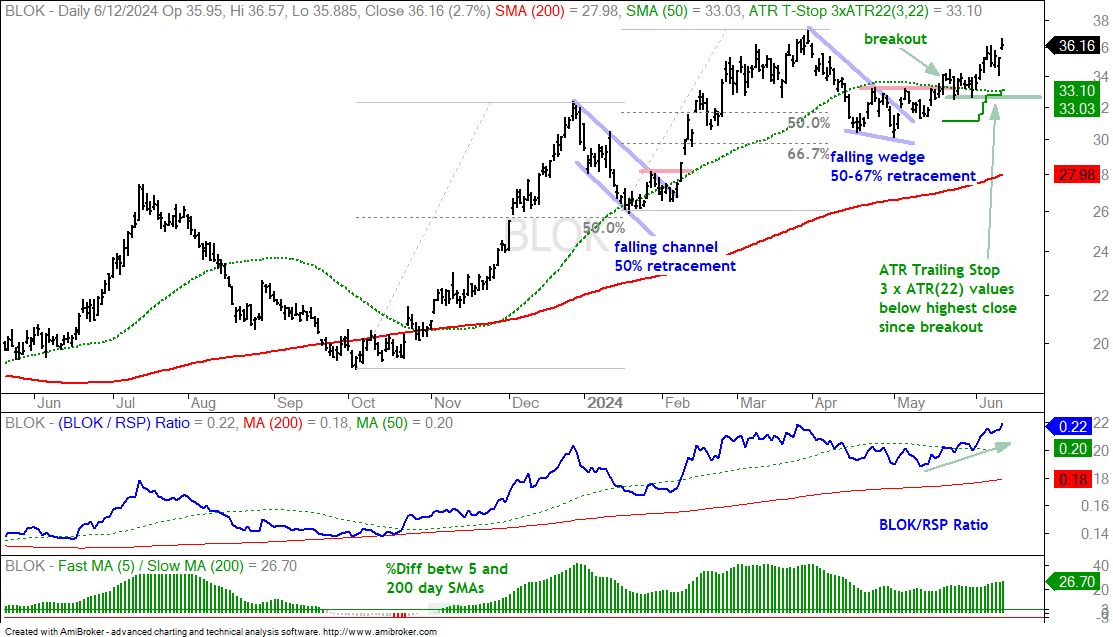
The next chart shows the Transformational Data Sharing ETF (BLOK) with a breakout on May 17th and an extension higher the last two weeks. There are two levels to consider. First, the lows from late May and early June mark support near the breakout. A close below 32.50 would negate the breakout. Second, the ATR Trailing Stop rose along with price and is currently at 33.10.
TradeDesk Holds Above Breakout Zone
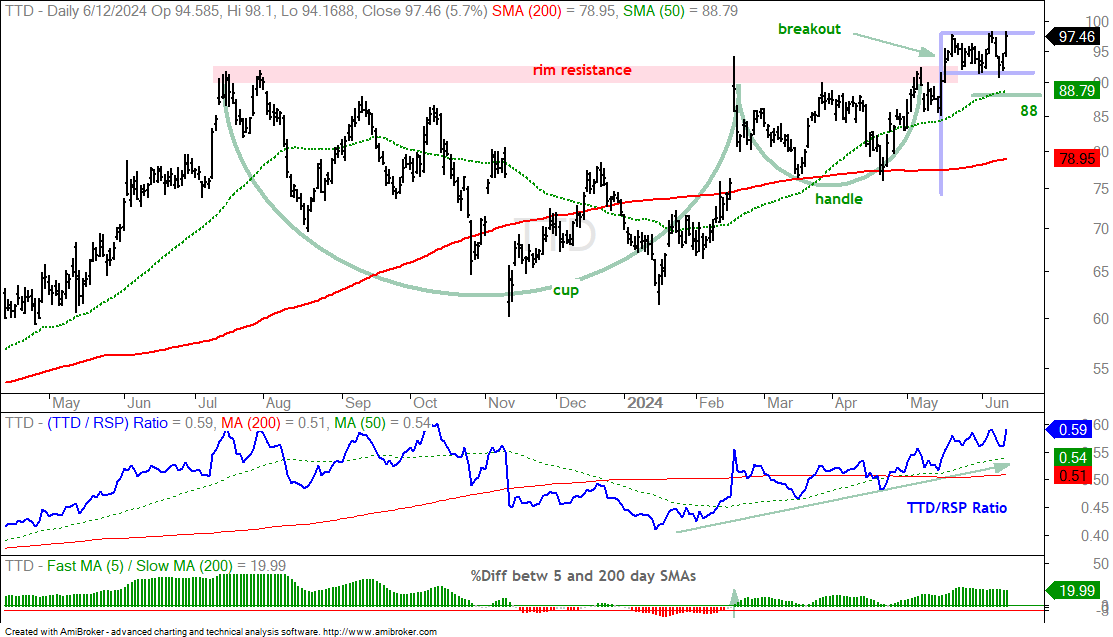
TradeDesk (TTD) featured on May 28th as it broke cup-with-handle resistance. This breakout triggered a 52-week high and a resumption of the prior advance, which was from 40 to 90 from January to July 2023. I am using a rising 50-day SMA and a buffer to mark re-evaluation support at 88. Short-term, TTD held above the breakout with a consolidation that looks like a flat flag. A flag breakout would signal a continuation of the advance from mid April to mid May. The middle window shows the TTD/RSP ratio rising since January as TTD outperformed the broader market. The lower window shows the long-term trend turning bullish in mid February as the 5/200 Differential exceeded +3% (turned green).
AMD Stalls after Breakout
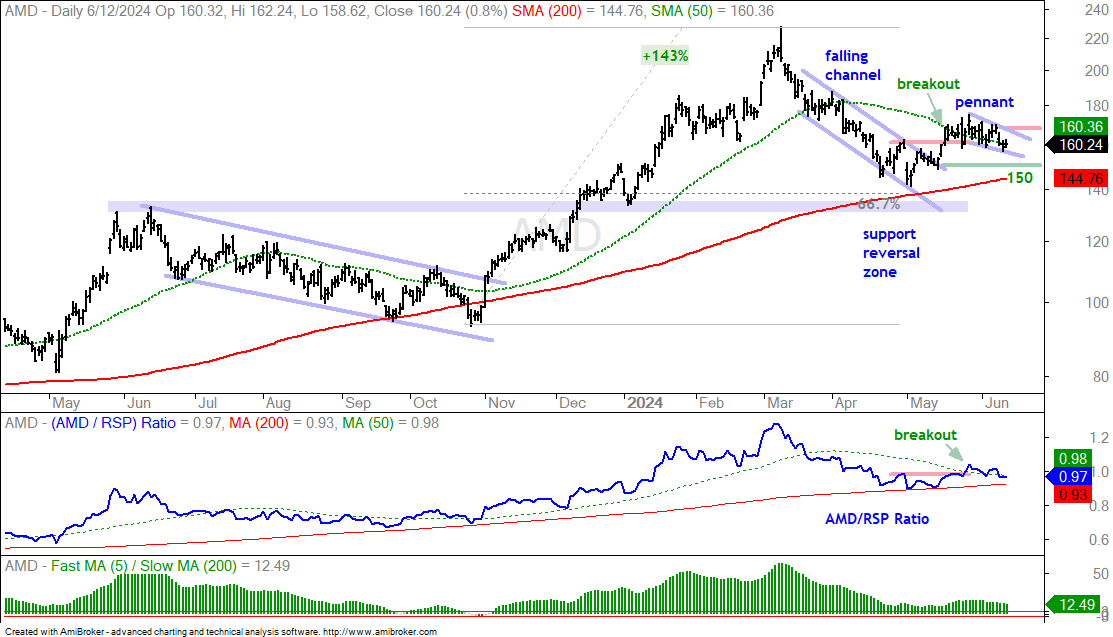
AMD featured on May 14th as it tested its 200-day SMA and Support-Reversal Zone. The stock broke out with a move above 161 and the price-relative (AMD/RSP ratio) also turned up. AMD is not participating in the semiconductor surge this month as it edged lower the last few weeks. Overall, AMD is battling the breakout zone and I am not ready to call it a failure. My initial re-evaluation level was set at 150 and this remains the level to watch for a failure. Short-term, the stock advanced from 140 to 175 (late April to late May) and the corrected with a small falling wedge (pennant). A breakout at 168 would be short-term bullish and keep the bigger breakout alive.
EW Consolidates within Uptrend
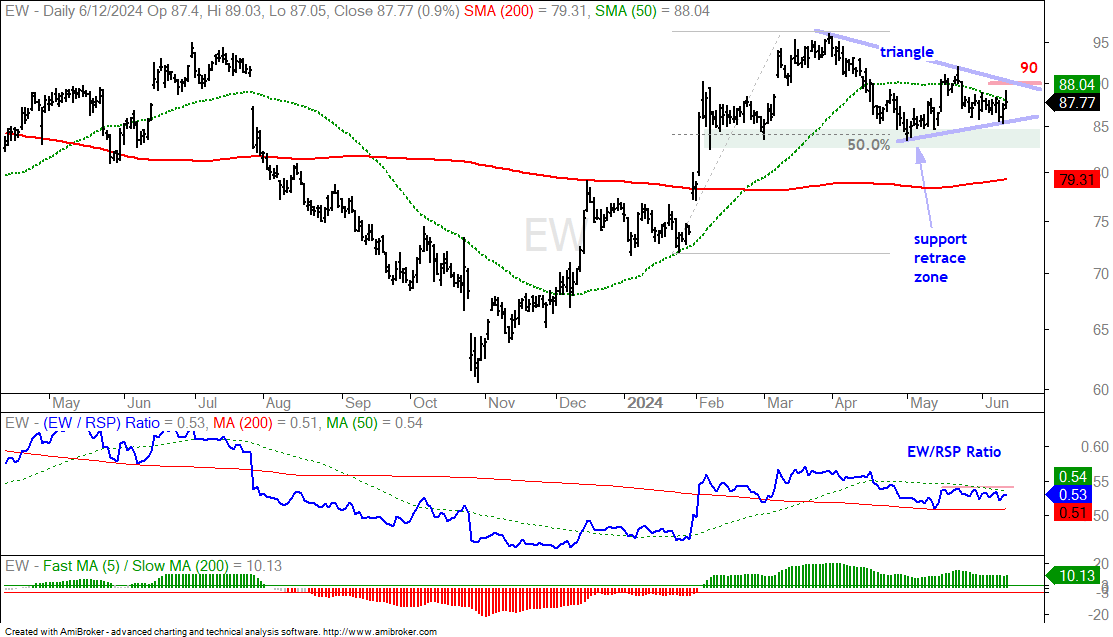
The next chart shows Edwards Life Sciences (EW) surging from 60 to 91 and then consolidating with a triangle. It led the market from late January to March, but lagged over the last few months as it corrected. Nevertheless, the bigger trend is up and the triangle is a consolidation within this uptrend. This makes it a bullish continuation pattern or rest within the trend. The green shading marks a Support-Retracement Zone in the 83-85 area (green shading). There is support from the February-May lows and the decline into early May retraced 50% of the January-March surge. Support and the key retracement make this a possible reversal zone that could mark the end of the correction. I am marking resistance at 90 and a breakout there would provide the first clue that this correction is ending and the bigger uptrend is resuming.