Oversold Bounce, but 4wk Hi-Lo% has yet to Trigger
Oversold Bounces after Outsized Declines
10-yr Treasury Yield Still Rising
Staples and Utilities Still Leading (plus PBJ)
Uranium ETF Turns Up with Bigger Bullish Pattern
Revenge of Old School Semis
The next Chart Trader will be posted on Tuesday morning, May 7th.
The Fed has come and gone, but earnings season remains in full swing and SPY is in corrective mode. This is not an ideal time for stock setups and signals. Volatility is above average and I prefer to avoid setups in stocks with upcoming earnings reports. As such, today’s report focuses on ETFs. Healthcare and biotech are perking up. The tech-related ETFs remain within corrective patterns and I will mark key levels going forward. And finally, CORN is holding a short-term breakout.
4wk Hi-Lo% has yet to Trigger
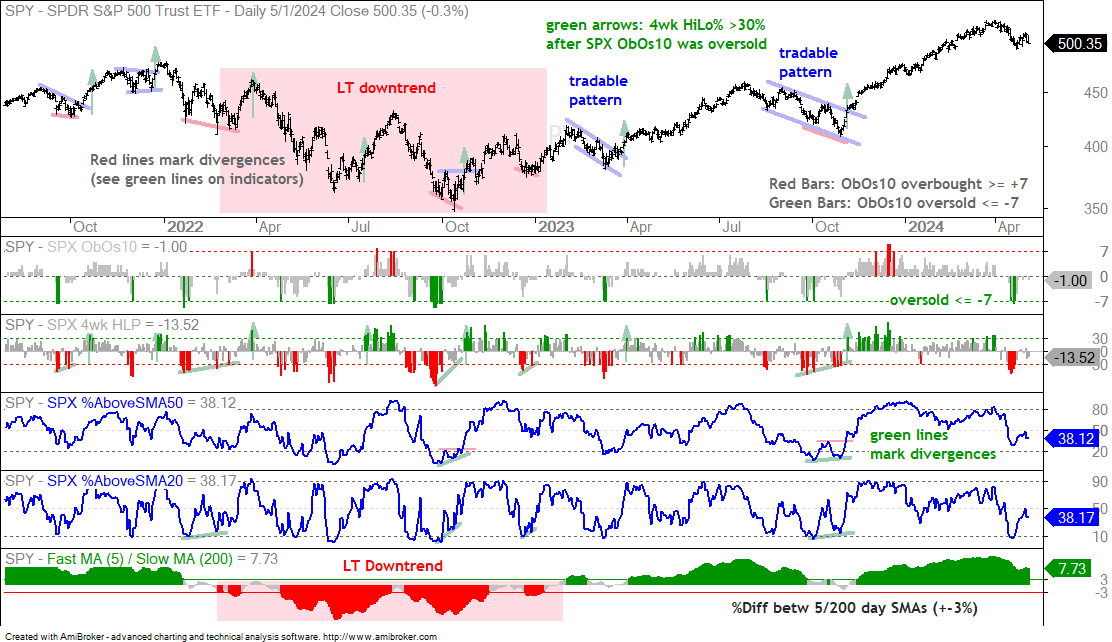
The next chart shows SPY with four short-term oscillators and a long-term trend indicator (see explanation below). SPX ObOs10 became oversold with dips to -7 and -8 from April 15th to 18th (green bars in first indicator window). SPX %Above 20-day SMA also dipped below 10% to become oversold (fourth indicator window). These oversold conditions foreshadowed the bounce in late April, but this was not enough to signal an end to the correction. I want to see an upside catalyst from SPX 4wk High-Low Percent and a cross above +30%. Thus, no signal yet.
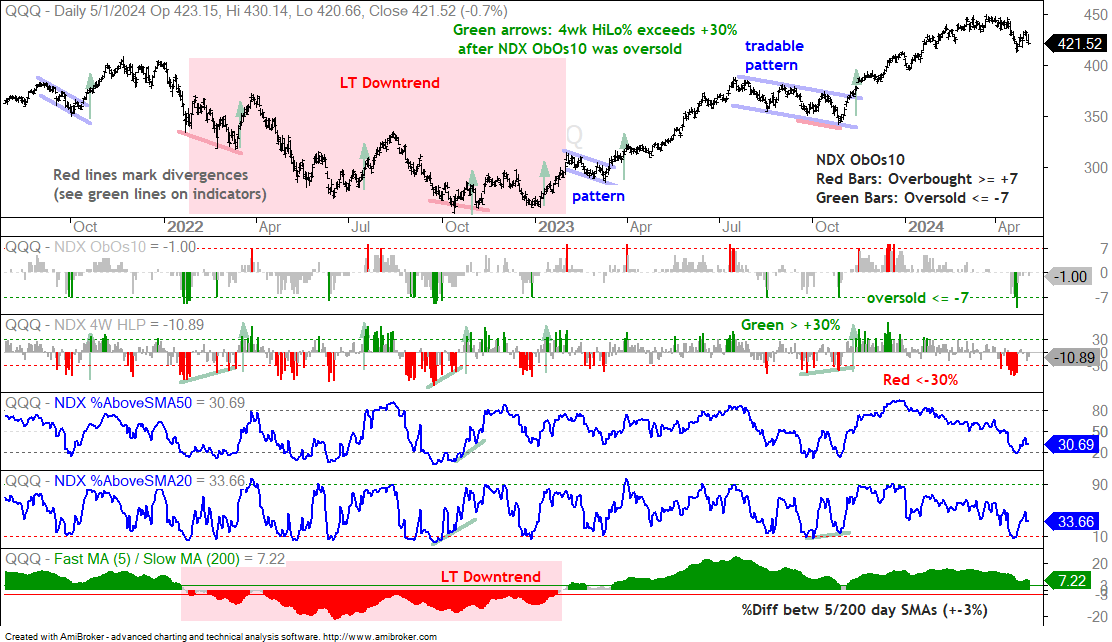
The next chart shows QQQ with the same indicators. NDX ObOs10 (first indicator) became oversold on April 18th and 19th (-7 and -10). NDX %Above 50-day SMA and NDX %Above 20-day SMA also became oversold with dips below 20% and 10%. These oversold conditions foreshadowed the bounce in late April. However, NDX 4wk High-Low Percent (second window) has yet to cross above +30%. No signal here either. A second push lower could lead to bullish divergences in the indicators and a more robust signal.
About the Indicators: The charts above feature a long-term trend indicator in the bottom window and four short-term indicators to identify short-term bullish setups. I am using the percentage difference between the 5 and 200 day SMAs for the long-term trend. A break above +3% is bullish and stays bullish until a break below -3%. The red shading marks the long-term downtrend in 2022. The first indicator window shows SPX/NDX ObOs10, which aggregates overbought and oversold signals in 10 indicators. It is oversold at -7 or lower and overbought when at +7 or higher. I am mostly interested in oversold readings when the long-term trend is up. Once ObOs10 becomes oversold, I then look for short-term signals to suggest an end to the correction. First, a bullish signal triggers when 4wk High-Low Percent crosses above +30%. Second, I look for short-term bullish divergences in Percent above 20 and 50 Day SMA indicators. Third, I look for tradable patterns and breakouts on the price chart.
Defining the Short-term Downtrends in SPY and QQQ
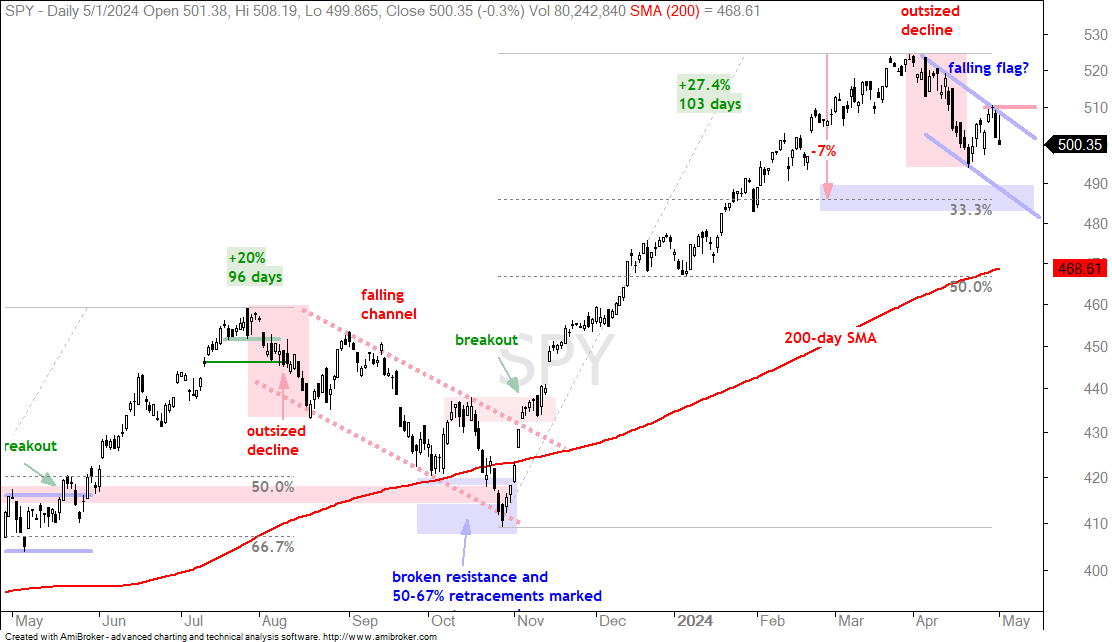
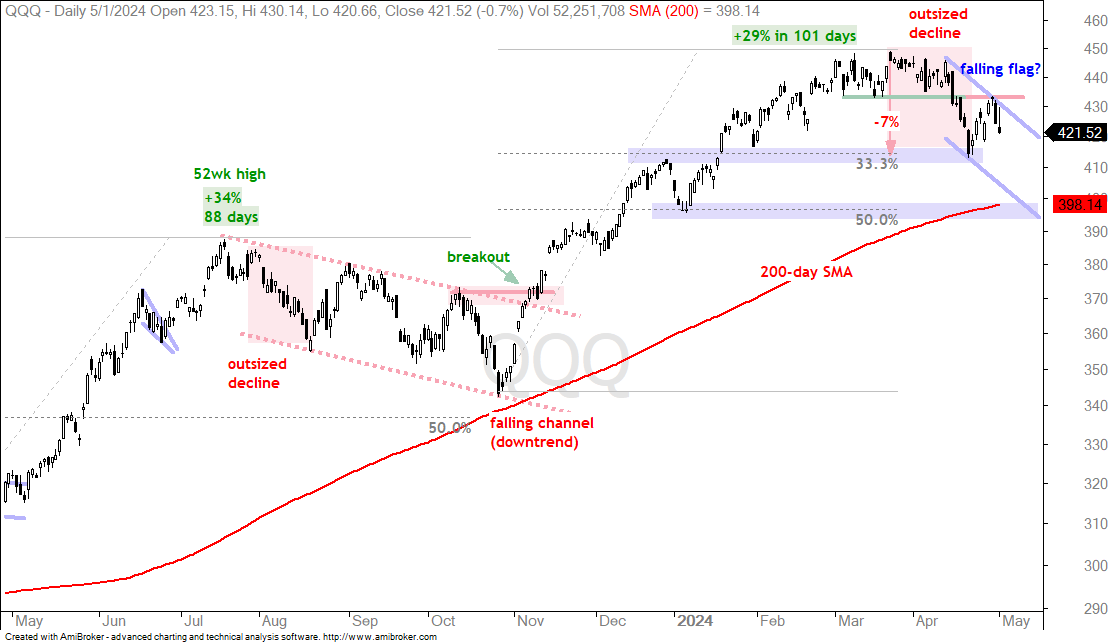
SPY and QQQ advanced from late October to March with massive moves and reversed these steep uptrends with outsized declines in April. Outsized declines show above average selling pressure that is enough to derail an uptrend, as in mid August 2023. These are not long-term bearish signals, but the immediate uptrends reversed and we are now in corrective mode.
Short-term, SPY formed a lower high from late March (525) to late April (510). This lower high formed as SPY bounced in late April, hit resistance at 510 and fell sharply the last two days. The bulls failed at 510 and a breakout here would show resilience. The blue lines mark a possible falling flag that extends to the 480 area. Barring a breakout at 510, the 480-490 area is the next zone to watch. The lower line of the possible flag, the 33% retracement and the February low mark the next Support-Reversal Zone to watch.
The next chart shows QQQ with similar characteristics. QQQ broke short-term support around 435 and this level turned into resistance as QQQ fell sharply the last two days. The blue lines mark a short-term downtrend with first resistance at 435. A breakout here would show resilience. Barring a breakout, a possible falling flag extends to the 390-400 area. This area also marks a 50% retracement of the prior advance. We can also find the rising 200-day around 400 and the early January low. This is a Support-Reversal Zone to watch should QQQ fall further.
Chart Analysis, Setups and Trading Ideas
TLT Firms at Support-Reversal Zone
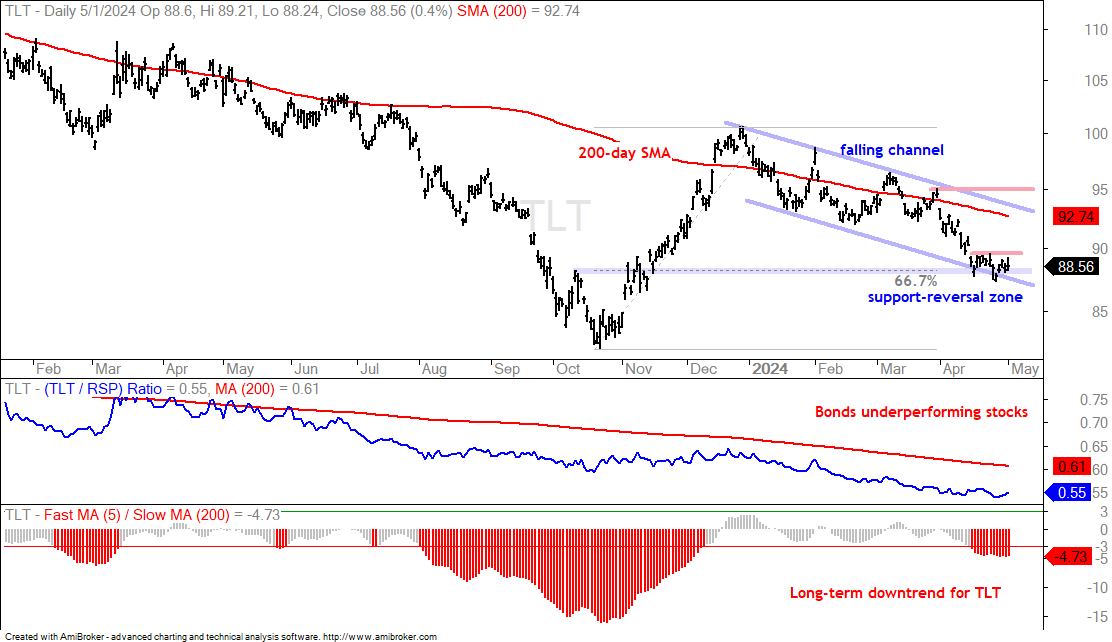
As noted on Tuesday, I am watching the 20+ Yr Treasury Bond ETF (TLT) for clues on stocks because stocks and bonds are positively correlated right now. TLT, SPY and QQQ fell sharply in April, and the 10-yr Treasury Yield rose. TLT is in a long-term downtrend, but trading near a Support-Reversal Zone. Notice how the 66.7% retracement, lower channel line and broken resistance converge here (blue shading). The swing within the falling channel is down with first resistance marked at 90. A breakout here would be short-term bullish and could lift stocks. Barring a breakout, all three trends are down for TLT. The 5/200 cross defines the long-term downtrend (bottom window), the falling channel defines the medium-term downtrend and resistance at 90 defines the short-term downtrend.
XLV Bounces off Support-Reversal Zone
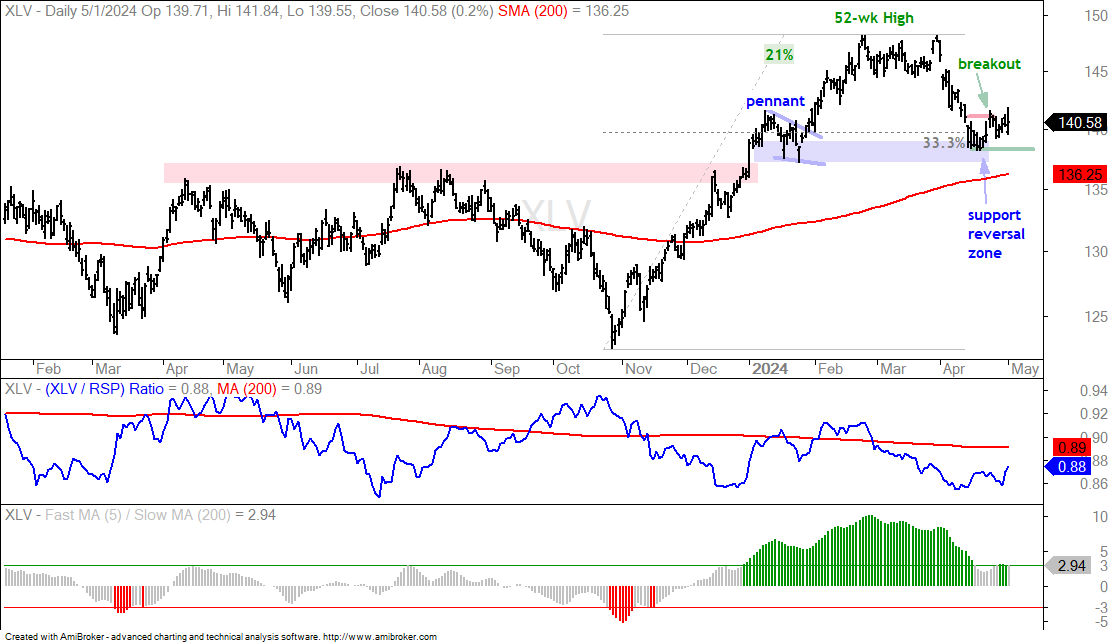
The Healthcare SPDR (XLV) hit a Support-Reversal Zone in mid April, firmed and broke short-term resistance last week. The chart below shows XLV in a long-term uptrend. XLV hit a 52-wk high in February, price is above the rising 200-day SMA and the 5-day is 2.94% above the 200-day SMA (bottom window). XLV hit a Support-Reversal Zone marked by the 33% retracement and support from the pennant lows. The ETF firmed and broke short-term resistance at 141 last week. XLV fell back after the breakout, but I view this breakout as bullish and would re-evaluate on a close below the April low (138.20).
Biotech SPDR Breaks Channel Resistance
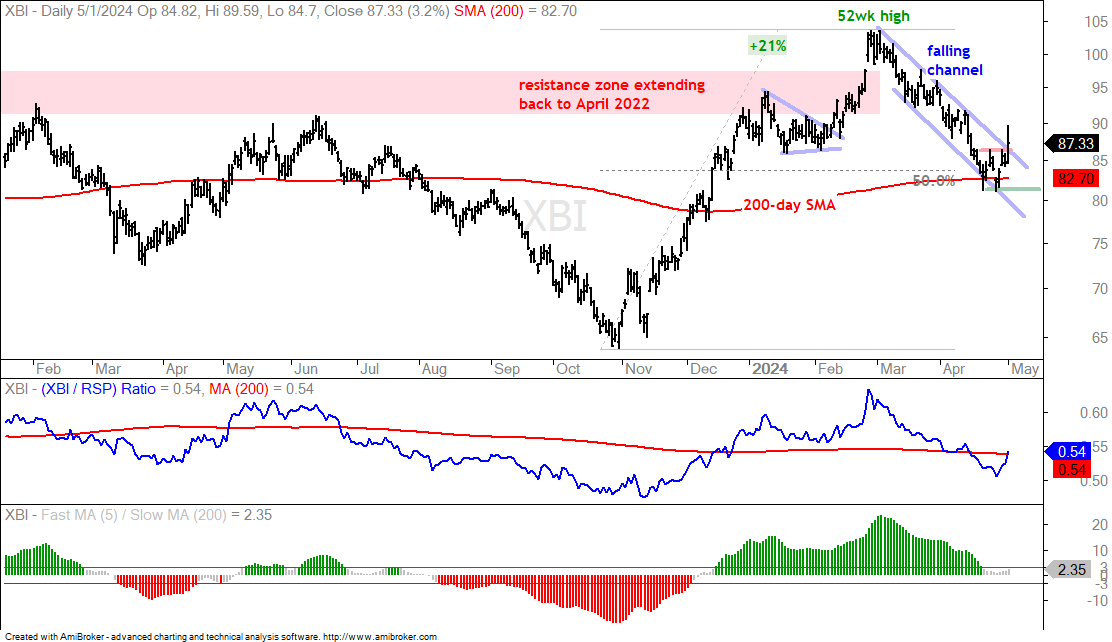
The Biotech SPDR (XBI) sprang to life with a surge and channel breakout the last five days. Overall, XBI surged from October to March and broke a big resistance zone that extends back to April 2022. The ETF forged a 52-week high in March and then retraced 50% of this advance with a return to the 200-day SMA. A 50% retracement is normal for a correction and a falling channel is typical for a corrective pattern. XBI is showing resilience with a surge and breakout on Wednesday. I view this as bullish and would re-evaluate on a close below the April low (81).
KBW Bank ETF Holds Strong
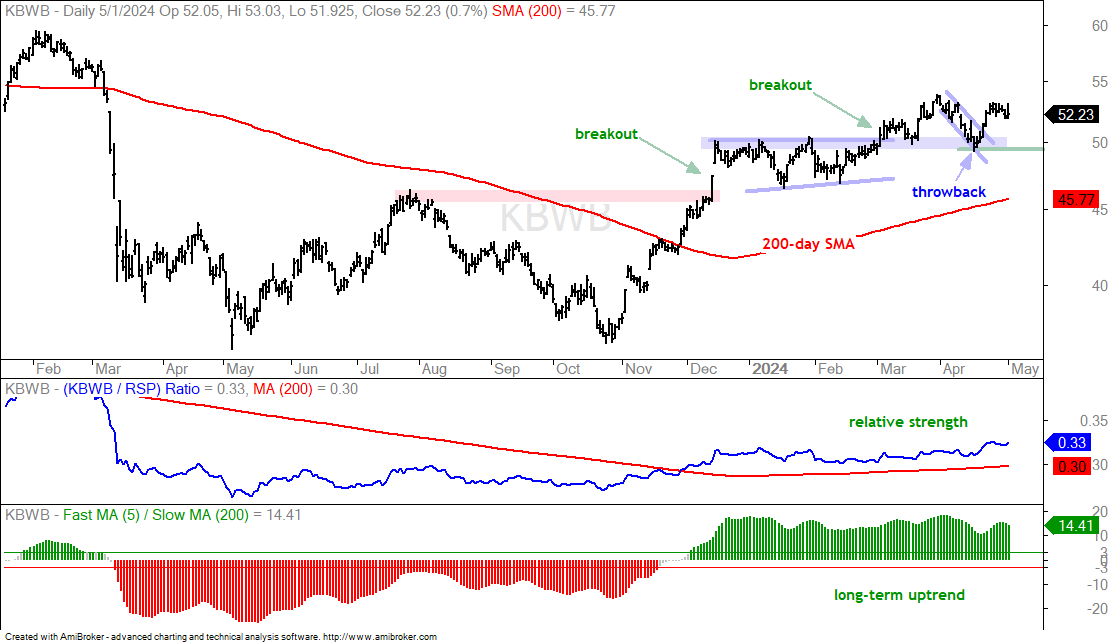
The next chart shows the KBW Bank ETF (KBWB) holding strong in April and leading the market. KBWB broke out with a big move into December, consolidated with an Ascending Triangle and broke out again in March. The ETF fell back to the breakout zone (throwback) with a falling flag and broke out with a surge in late April. Support is marked at 49. The first indicator window shows the KBWB:RSP ratio above the 200-day SMA (relative strength). Note that SPY fell sharply in April, but KBWB was unchanged and held up much better. The bottom window shows that the 5-day SMA is 14.41% above the 200-day SMA (long-term uptrend).
Corrective Patterns for Tech ETFs (IGV, CIBR, SKYY, SOXX)
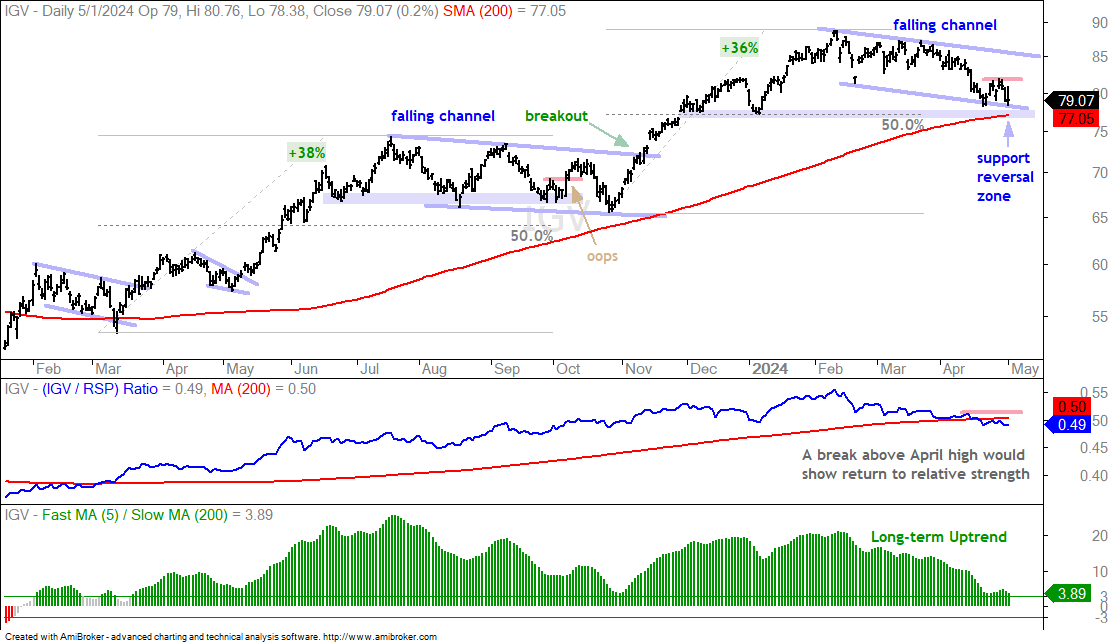
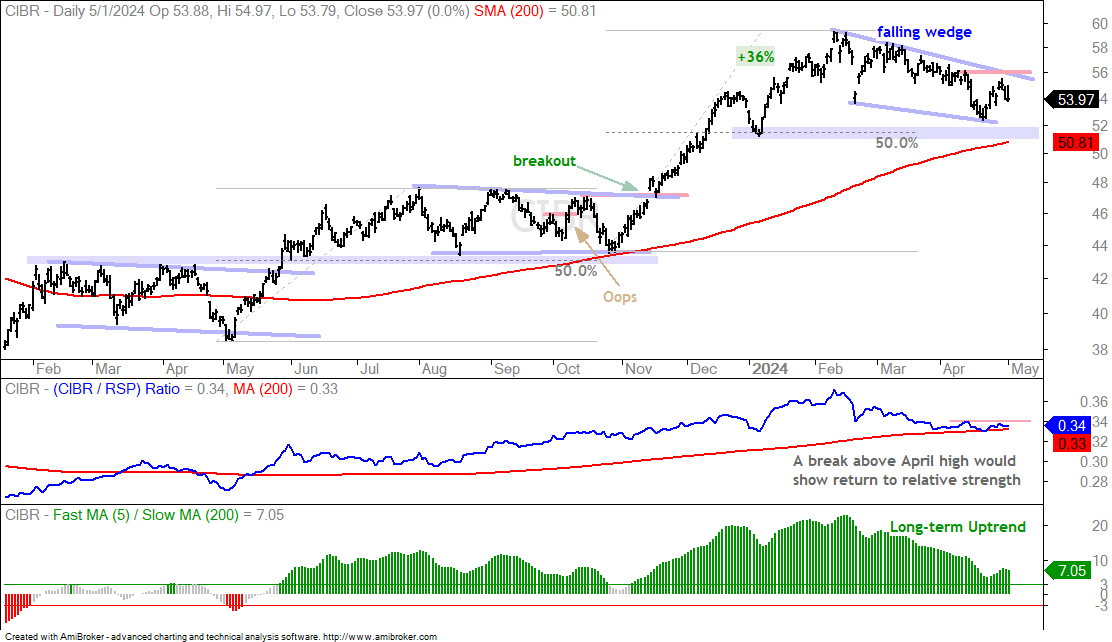
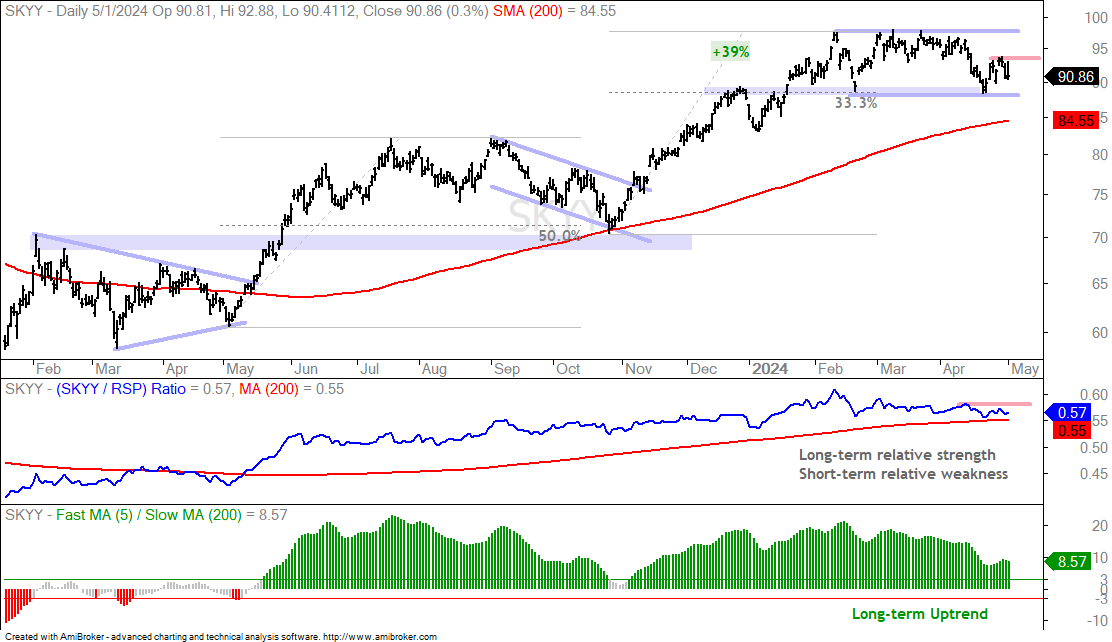
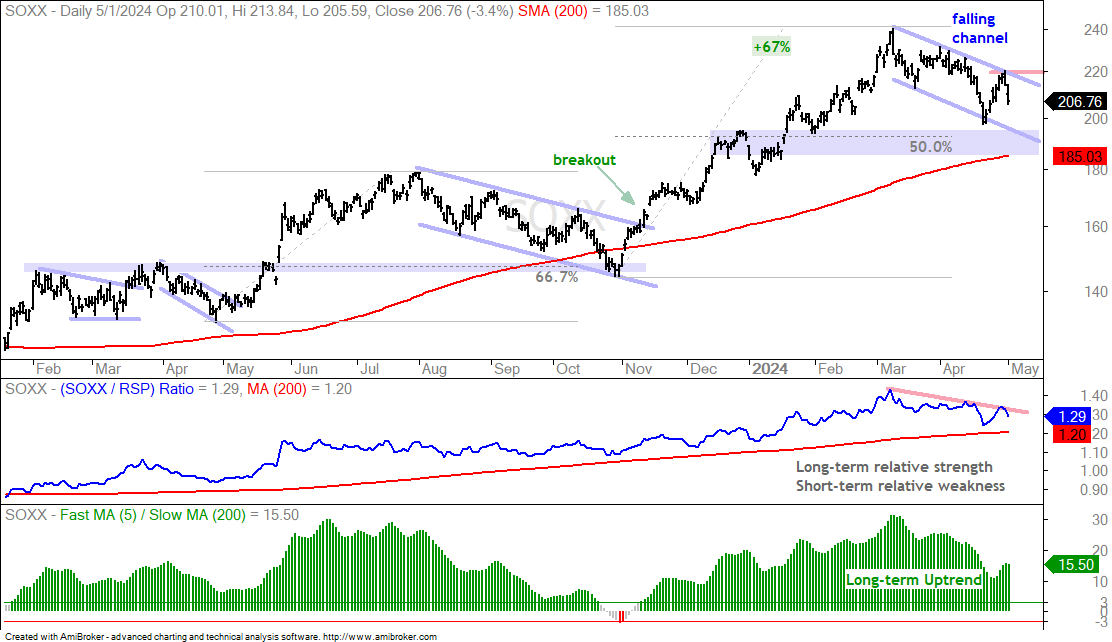
The tech-related ETFs started the corrective process as the Software ETF (IGV) and Cybersecurity ETF (CIBR) peaked in February and started their corrections. The Cloud Computing ETF (SKYY) and Semiconductor ETF (SOXX) peaked in early March, while SPY peaked in late March. These four tech ETFs sport corrective patterns over the last few months. There are two approaches to trading these patterns. First, one can buy on the breakout that signals an end to the correction. Second, one can buy when these ETFs become oversold and reach Support-Reversal Zones. I use retracements, the 200-day SMAs, broken resistance levels, support levels and channel extensions (lower line) to mark these zones.
The first chart shows the Software ETF (IGV) with a falling channel correction since February. This correction looks quite similar to the falling channel from mid July to late October. IGV is close to a Support-Reversal Zone marked by the 50% retracement, lower line of the channel, early January low and the rising 200-day SMA (blue shading). The ETF established short-term resistance with a pop and drop the last two weeks and a breakout at 82 would be short-term bullish. A channel breakout at 86 would fully reverse the falling channel. There was a similar short-term set in mid October 2023, but the short-term breakout did not hold (see oops on chart). This is the risk. The channel line breakout in early November did hold, largely because the broader market turned bullish with the Zweig Breadth Thrust.
The next chart shows the Cybersecurity ETF (CIBR) with a falling wedge correction since February. Wedge resistance is marked at 56 and a breakout here would be bullish. The Support-Reversal Zone is set in the 51-52 area.
The next chart shows the Cloud Computing ETF (SKYY) holding up the best of the four. SKYY did not break its February low and formed a flat consolidation the last few months. A breakout at 98 would be bullish. Within the pattern, I am marking short-term resistance at 94 and a breakout here would provide the first sign of strength.
The next chart shows the Semiconductor ETF (SOXX) with a falling channel correction and resistance marked at 220. A breakout here would reverse the correction and signal a resumption of the bigger uptrend. The Support-Reversal Zone is set in the 190 area.
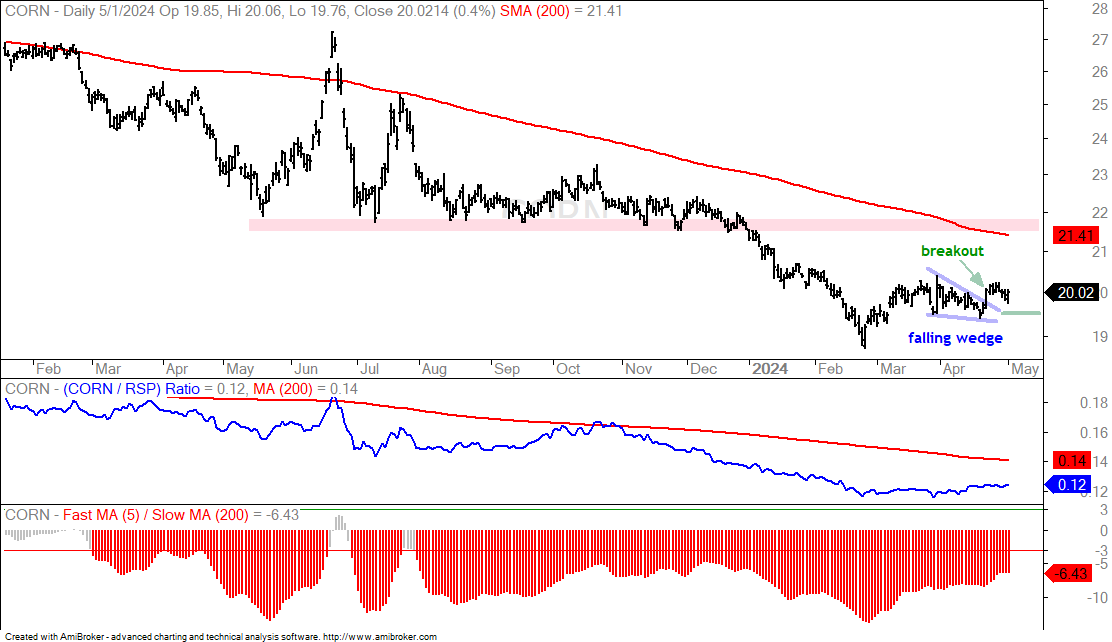
CORN: A ST Breakout within LT Downtrend
The chart below shows the Corn ETF (CORN) within a long-term downtrend. CORN hit a 52-week low in February and the 5-day SMA is some 6.5% below the 200-day SMA. Despite the long-term downtrend, I am seeing some short-term strength with a falling wedge breakout in late April. Moreover, this breakout is holding and is bullish until proven otherwise. I would target a move to the 21.5-22 area. The green line marks the re-evaluation level at 19.50. A close below this level would negate the breakout.