Timing Models – ROC Shock Lingers, but Short-term Breakouts Hold

The long-term trend is up for the S&P 500 and Nasdaq 100, but questionable for the S&P SmallCap 600 and S&P MidCap 400. Small-caps and mid-caps are largely off my radar right now. Despite long-term uptrends and bullish evidence for large-caps, I remain in the correction camp for three reasons. First, SPY and QQQ became extremely extended in early September, as measured by the percentage above the 200-day SMA. Second, S&P 500 breadth did not keep pace in August and September. Third, there was an outsized decline with the fifth ROC Shock since January 2018.

As the chart below shows, ROC Shocks in early 2018 and August 2019 led to ten week corrective periods and choppy trading. ROC Shocks October 2018 and February 2020 led to sharp declines an 52-week lows. A ROC Shock is an outsized move that rattles the existing trend. The trend was up in early September and the above average decline rattled the bulls. It usually takes some time for the bulls to find their footing after such a hit.

The weekly chart shows a big spinning top followed by a three week decline for SPY. The ETF fell around 10% during this decline and became short-term oversold last week, which gave way to this week’s bounce. The base-case is still for a correction that returns to the 40-week SMA (200-day SMA) and retraces around a third of the March-September advance. Such a move would also return SPY to the June consolidation, which should offer support.

The short-term downtrend reversed with a breakout on Monday and this breakout is holding. We are also in the turn of the month period and this eight day window shows a bullish bias over the years. This window covers the last four days of September and first four days of October, and ends next Tuesday.

On the daily chart, SPY broke out of a falling wedge and this breakout is holding, even after opening weak on Friday. The dotted lines show how a possible correction might unfold over the coming weeks. For now, the breakout is bullish until proven otherwise and I am watching Monday’s gap. A close below 328 would fill the gap and negate the breakout. This would then argue for a return to correction mode and we could then see a decline back to the 310 area.

The next chart shows QQQ with a wedge breakout and stronger move this past week. The wedge breakout is also bullish until proven otherwise and Monday’s gap holds the first key. A close below 271 would fill the gap and negate the breakout. This would move QQQ from breakout mode to corrective mode with a target in the 250 area.

SPY and QQQ are the big drivers for the broader market right now. ETFs with late September breakouts have a much better chance of extending on these breakouts as long as SPY and QQQ hold strong. These breakouts were noted on Thursday. Five sector SPDRs broke out: XLK, XLY, XLC, XLV and XLP. A number of tech-related ETFs also broke out: IGV, SOXX, FINX, HACK, IPAY and SKYY. ITB and XRT also broke out, as did IHI and IHF. Healthcare ETFs in general seem to be caught in a whirlwind of events these days.

Medium-term Indicators Get Whippy

Several medium-term indicators are all over the place with the recent swings in the market. The Bullish Percent Indexes, High-Low Lines and 20-day High-Low Percent are not adding any value at this stage so I will not cover them in detail. In short, the S&P 100 Bullish Percent Index moved below 40% to turn bearish, while the Nasdaq 100 Bullish Percent Index moved back above 60% to reverse its bearish signal. The SML and MID High-Low Lines turned back up with the bounce in stocks over the past week. We also saw 20-day High-Low Percent move back above +10% and volatility tick lower with the bounce in stocks.

The %SilverCross indicators continue to fall and remain below their 20-day EMAs. The Nasdaq 100 and S&P 500 have yet to trigger bearish with moves below 40%. However, the Small-cap and Mid-cap %SilverCross indicators moved below 40% for the first time since May.

The S&P 500 and Nasdaq 100 %GoldenCross indicators remain in bull mode, but the Small-cap and Mid-cap %GoldenCross indicators moved below their signal lines last week and remain below their signal lines. Again, we are seeing weakness in small-caps and mid-caps, and these two groups account for the majority of stocks.

Breadth Models Bullish, with a Little Red

I had to make a change with the breadth models and go back to Amibroker. Optuma is great for charting and displaying data in a clear and customizable format, but Amibroker still rules when it comes to breadth data and testing. I gave Optuma breadth the old college try, but it proved too unstable to use on a regular basis. It is just too bad that the Amibroker charts are not as polished. In any case, the indicators and signals are clearly visible and this is most important.

A few individual signals changed and one model flipped with the move back to Amibroker. We cannot expect two different data sources to produce the same exact signals, especially when it comes to breadth.

You can learn more about the breadth model and its historical performance in this article and video (here).

%Above 200-day Remains Anemic for Small-Caps

The first chart shows the small-cap indicators with bullish signals in green and bearish signals in red. The %Above 150-day SMA for the S&P SmallCap 600 moved above 65% on September 2nd to turn the long-term breadth model bullish for small-caps. Two of the small-cap indicators, however, are still bearish. There are no new highs to speak of and the %Above 200-day SMA is at 43%. Clearly, the majority of small-cap stocks are in long-term downtrends.

The next chart shows the S&P 500 breadth indicators with all five on bullish signals. Even so, two indicators capture the recent deterioration in participation and a non-confirmation of new highs. Notice that the 10-day EMA of AD%, first indicator window, has been waning since early June. Each positive push petered out at lower and lower levels. This reflects waning participation on the upside.

The next to the last window shows SPX %Above 200-day SMA failing to exceed 65% in August or September, which is when SPY was powering to new highs. The indicator was more bullish than bearish, but a third of SPX components (35%) were still below their 200-day SMAs when SPY was hitting new highs. Note that this indicator regularly exceeded 75% in 2019 and early 2020. Again, there are some sizable pockets of weakness in the S&P 500.

Last week I noted that the Nasdaq 100 short-term breadth indicators did not trigger bearish and were at oversold levels. %Above 20-day SMA and %Above 50-day SMA dipped below 25%, but neither triggered bearish. Both bounced over the past week and the oversold condition is no longer an issue.

You can learn more about the breadth model and its historical performance in this article and video (here).

One New Bullish Signal in Sector Breadth Model

The sector breadth model remains largely bullish with five of the six biggest sectors in bull mode. The Finance SPDR (XLF) is the only one of the big six that is bearish. A new signal triggered in the Utilities SPDR (XLU) as the 10-day EMA of Advance-Decline Percent surged above +30% for a bullish breadth thrust. This flips Utilities net bullish with two of the three indicators on bullish signals. Overall, eight of the eleven sectors are net bullish and 23 of 33 indicators are on active bullish signals.

Even though XLU turned net bullish on the breadth model, the chart is seriously uninspiring. Perhaps XLU is trying to lull us to sleep and then breakout when nobody is watching. The ETF is up over 5% the last seven days, including a .50% pop today. As noted in Thursday’s report, XLU never came close to its February high and the August high was below the June high (red lines). XLU basically formed a long extended triangle consolidation the last few months and is going nowhere slowly.

Yield Spreads and Fed Balance Sheet

The AAA bond spread fell to normal levels in late May and then flattened. This is a no news is not bad news situation. The AAA spread remains at normal levels and does not become a negative unless it turns up and exceeds 1. The BBB spread fell until mid August and then flattened out at relatively low levels (pre-crisis highs). A move back above 2 would show stress and be negative.

Junk bond spreads ticked up in September as the High-Yield Bond ETF (HYG) edged lower. The uptick in junk bond spreads coincided with the decline in stocks because these two are negatively correlated. A small uptick is tolerable, but I would not want to see this spread widen past 6.

The Fed balance sheet ticked lower this past week with the largest contraction since early July. Even with this relatively small contraction, the balance sheet has largely expanded since mid July and remains near the $7 trillion mark.

Thanks for tuning in and happy Friday!

ETF Trends, Patterns and Setup – Breakouts from September Corrections, Laggards still Lagging and Bonds Sag

After correcting most of September, many stock-related ETFs caught a bid the last few days and we are seeing short-term breakouts in several areas. The Solar Energy ETF (TAN) is far an away the leader and the only ETF in the core list to hit a new high. Nevertheless, a handful are knocking on the new high door with pennant breakouts in the making (ITB).

ETF Trends, Patterns and Setup – Breakouts from September Corrections, Laggards still Lagging and Bonds Sag Read More »

Weekend Video – Falling Wedges Take Shape, Select Tech and Housing Hold Up, Energy and Finance Remain in Doghouse

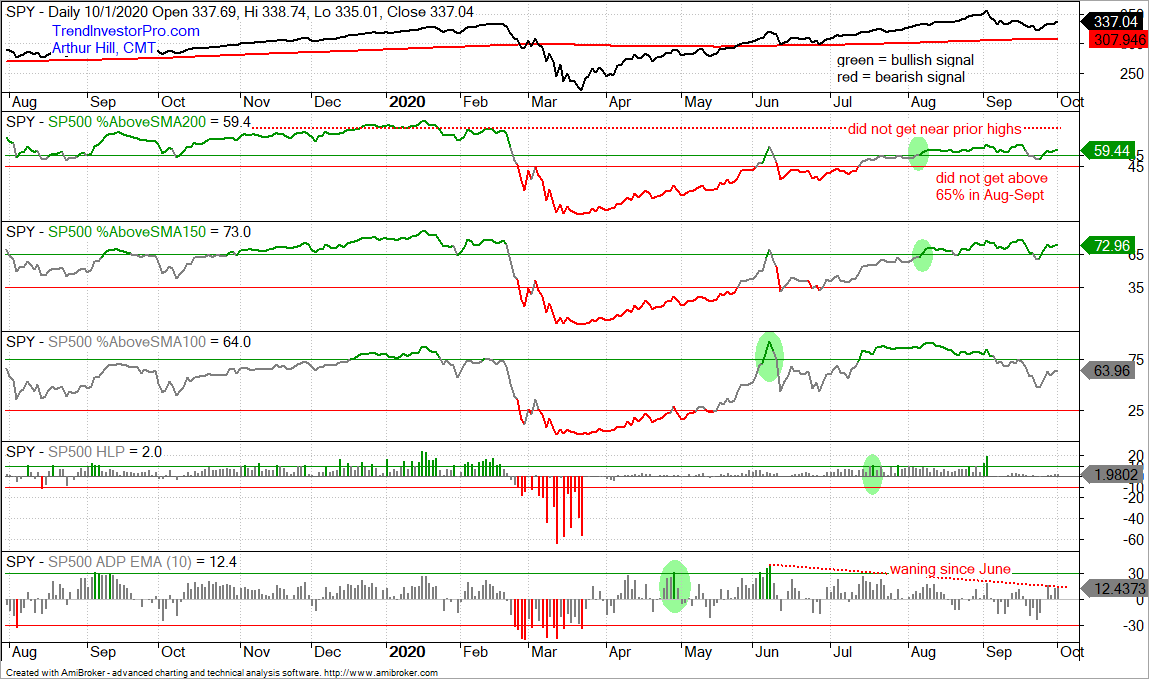
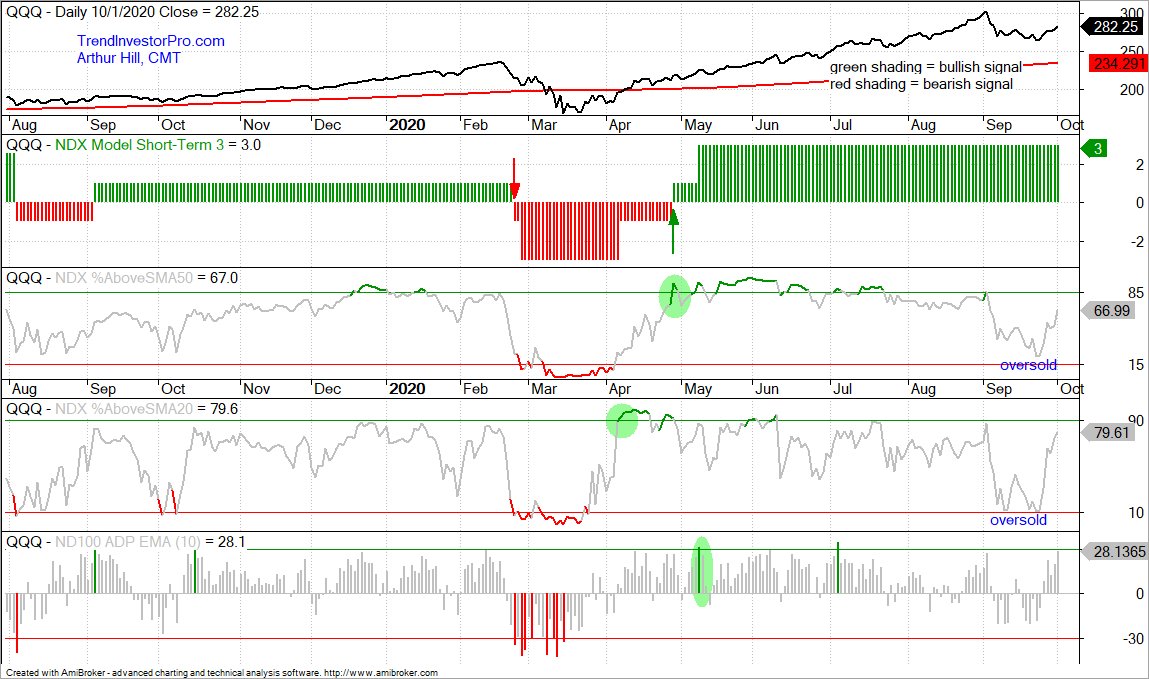
Today’s video starts with the broad market charts as SPY formed a weekly spinning top and QQQ formed a piercing pattern. Even though the ROC Shock reversal earlier this month remains the dominant chart feature, falling wedges are taking shape and breakouts from these corrective patterns would be short-term bullish. The Nasdaq 100 is holding up the best and its short-term breadth indicators are oversold. In addition, we are also seeing relative strength in several tech-related ETFs

Weekend Video – Falling Wedges Take Shape, Select Tech and Housing Hold Up, Energy and Finance Remain in Doghouse Read More »

Timing Models – The Only Game in Town, Double-Edged Swords and Some Bearish Breadth Signals

SPY and QQQ fell in September and are in short-term downtrends, which are considered corrections within a bigger uptrend. The S&P SmallCap 600 SPDR and S&P MidCap 400 SPDR also fell in September, but these declines do not look like mere corrections within a bigger uptrend. MDY, IJR and IWM fell well short of their January-February highs and broke their downward sloping 200-day SMAs. These three look like they are reversing the uptrends that began with the March blast off.

Timing Models – The Only Game in Town, Double-Edged Swords and Some Bearish Breadth Signals Read More »

ETF Trends, Patterns and Setups – Dollar and Bonds Shine, Gold Dulls, Tech ETFs Hold, SPY Continues Lower, Failed Flags

It has been a rough month for everything except the Dollar and Treasury bonds. The chart below shows month-to-date performance for nine ETFs. The Dollar Bullish ETF (UUP) and 20+ Yr Treasury Bond ETF (TLT) are the only gainers this month and both have been positive for the entire month. This is a big difference from August.

ETF Trends, Patterns and Setups – Dollar and Bonds Shine, Gold Dulls, Tech ETFs Hold, SPY Continues Lower, Failed Flags Read More »

Breadth Model Update: %Above 200-day SMA Sags for SPX and OEX and AD% Reflects Broad Downside Participation

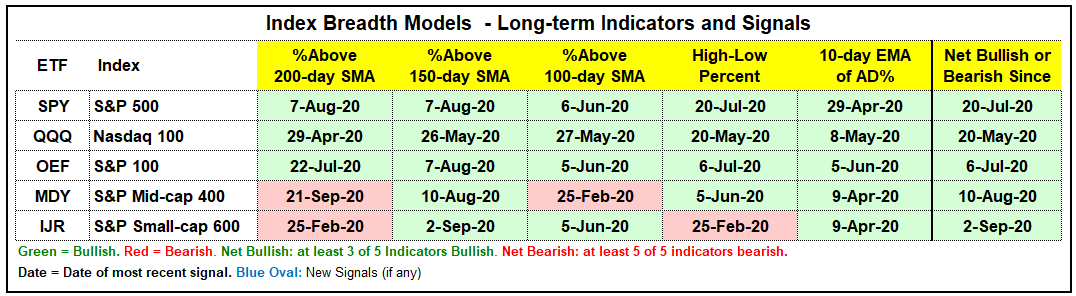
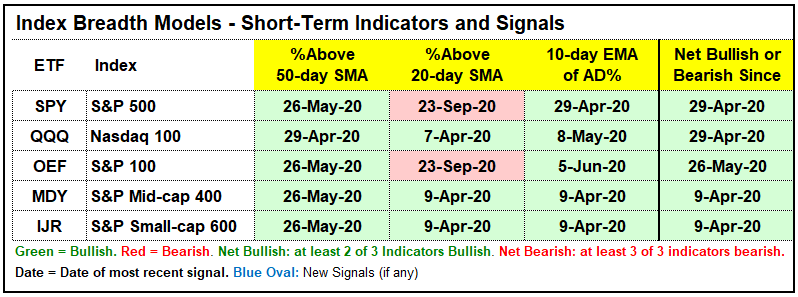
This is a midweek update to address Monday’s price action and its effect on the breadth indicators and models. At this stage, there was only one new signal: %Above 200-day for $MID broke below 45%. Nine of the ten breadth models remain bullish, but we saw more deterioration in the breadth indicators on Monday. Selling pressure was the strongest un small-caps and mid-caps over the last five weeks (since August 15th).

Breadth Model Update: %Above 200-day SMA Sags for SPX and OEX and AD% Reflects Broad Downside Participation Read More »

ETF Update: Flag Breaks, Breakaway Gaps, A Few Hold Up, Failed Breakouts and Tepid Bounce in Bonds

This is a midweek update to address Monday’s price action in some of the ETFs in the core chart list. We saw a continuation lower in SPY and QQQ, but some of the tech-related ETFs held up relatively well. ETFs that held up relatively well during broad selling pressure are often the ones that lead on any bounce, even if it is just an oversold bounce. Elsewhere

ETF Update: Flag Breaks, Breakaway Gaps, A Few Hold Up, Failed Breakouts and Tepid Bounce in Bonds Read More »

Weekend Video – Spinning Top Follow Thru, Correction or more?, Breadth Indicators Deteriorate, 4 Channel/Flag Breakouts, 2 to Watch

Today’s video starts with the S&P 500 and the reversal seen over the last few weeks. We look at the spinning top, the outside week, downside follow through and the ROC shock. With a reversal in play, I put forth a correction target for the S&P 500 SPDR and this serves as the base case for the broader stock market (a correction within a bigger uptrend).

Weekend Video – Spinning Top Follow Thru, Correction or more?, Breadth Indicators Deteriorate, 4 Channel/Flag Breakouts, 2 to Watch Read More »

Timing Models – ROC Shock Lingers, SPY Follows Thru on Outside Week, Breadth Models Remain Bullish

The medium-term indicators and breadth models are still bullish, but the ROC Shock in early September and some waning breadth indicators argue for at least a correction of the March-September advance. I covered the ROC Shock in detail last week and will review the findings. First, keep in mind that the character of the market (SPY) changed in January 2018 as the swings became bigger and 52-week lows were interspersed with 52-week highs. Big swings and volatility are the order of the day for now.

Timing Models – ROC Shock Lingers, SPY Follows Thru on Outside Week, Breadth Models Remain Bullish Read More »

ETF Trends, Patterns and Setups – SPY and QQQ Look Vulnerable, Bond Proxies Catch a Bid, Gold Stalls as Dollar Firms

There’s been a shake up this week. A handful of equity-related ETFs are in the top group, as far as the trend, patterns and setups are concerned. However, I downgraded several groups because it looks like SPY and QQQ are moving further into correction mode. The majority of stock-related ETFs will be under pressure should SPY correct and the majority of tech-related ETFs will be under pressure should QQQ correct.

ETF Trends, Patterns and Setups – SPY and QQQ Look Vulnerable, Bond Proxies Catch a Bid, Gold Stalls as Dollar Firms Read More »

Update for Precious Metals (GDX, GLD, SLV), Healthcare (XLV, IBB, XBI) and Bond Proxies (TLT, XLU, XLRE)

Tech-related ETFs continue to drag their feet and remain in corrective mode. This puts the attention elsewhere and biotechs are picking up the slack. Namely, the Biotech ETF (IBB) and Biotech SPDR (XBI) made bids to end their corrections and resume their bigger uptrends. Elsewhere, precious metals related ETFs bounced within their consolidations and bond proxies popped with XLU and XLRE getting big moves.

Update for Precious Metals (GDX, GLD, SLV), Healthcare (XLV, IBB, XBI) and Bond Proxies (TLT, XLU, XLRE) Read More »

Weekend Video – Acceleration, Outsized Decline, Mixed Indicators, Waning Breadth, Golden Pennants, TLT Battles Breakout …

Today’s video starts with the S&P 500 and breaks down the reversal over the last two weeks. We can see the index becoming overextended, accelerating higher and then suddenly reversing with an outsized decline. Such reversals occurred in the past and we will show what it means going forward. Elsewhere, the medium-term indicators turned

Weekend Video – Acceleration, Outsized Decline, Mixed Indicators, Waning Breadth, Golden Pennants, TLT Battles Breakout … Read More »

Timing Models – Accelerations, Trend Shocks, Indicators turn Mixed, Downside Targets and Breadth Models

The stock market was overextended in late August and the bulls gave it one more push higher with a small acceleration higher into late September. Technically, an acceleration higher signals an increase in momentum, which can be bullish. However, as with most technical signals, perspective is needed for interpretation. Today we will look at the accelerations that led to a reversal and the outsized decline. What do they portend going forward?

Timing Models – Accelerations, Trend Shocks, Indicators turn Mixed, Downside Targets and Breadth Models Read More »

ETF Grouping and Ranking Report – Outsized Declines, Retracement Targets, Patience During Corrections, Gold and Bonds Balk

Stocks were hit hard from Friday to Tuesday with the S&P 500 SPDR, Nasdaq 100 ETF and others recording outsized declines. Today we start with these outsized declines and show what they entail going forward. Stocks were already extended and these sharp declines signal the start of a corrective period. At this point, I will treat any weakness in SPY and QQQ as a correction within a bigger uptrend.

ETF Grouping and Ranking Report – Outsized Declines, Retracement Targets, Patience During Corrections, Gold and Bonds Balk Read More »

Weekend Video – Spinning Top, Indicators Turn Mixed, Correction Targets, Bond Breakouts Fail, Banks Buck Selling and More

The extended uptrend in stocks hit a speed bump this week with a sharp decline on Thursday-Friday. Today we will review the percent above 200-day SMA indicators and their extended nature. Attention then turns to the medium-term indicators, which turned mixed this week. The odds for a correction were already brewing and it looks like some sort of correction is unfolding. I will look at potential targets for SPY and QQQ, as well as for several ETFs in the ChartBook. Elsewhere

Weekend Video – Spinning Top, Indicators Turn Mixed, Correction Targets, Bond Breakouts Fail, Banks Buck Selling and More Read More »

Timing Models – Bears Fire a Shot, SPY Tags and Pulls Back, Volatility Ticks Up and Breadth Model Review

The bears fired a shot across the bow, but one or two days is not enough to reverse a strong uptrend. There were already warnings of a correction or pullback because SPY has been more than 10% above its 200-day since August 12th and QQQ has been 20% above its 200-day since July 6th. Of course, overbought indicators are not very good for timing a correction. In fact, I have yet to find a good indicator for timing a peak/pullback during a strong uptrend.

Timing Models – Bears Fire a Shot, SPY Tags and Pulls Back, Volatility Ticks Up and Breadth Model Review Read More »

ETF Trend/Pattern Grouping – Overextended get More So, Flag Breakouts, Pennants, Falling Wedges and Bollinger Band Squeezes

Overextended its an incredibly nebulous term. Many ETFs were considered overextended last week and simply became even more so as strong buying pressure persisted. This is a classic case of becoming overbought and remaining overbought because the uptrend is strong. These ETFs, which are in the first few groups, are in the trend-monitoring phase.

ETF Trend/Pattern Grouping – Overextended get More So, Flag Breakouts, Pennants, Falling Wedges and Bollinger Band Squeezes Read More »

Weekend Video – Breadth and Key Indicator Overview, Flag Breakouts (IWM), REITs Perk Up, GLD Winds UP and Bonds Extend Pullback

Today’s video starts with an overview of the breadth models for the S&P 500, Nasdaq 100, Mid-caps and Small-caps. We then turn to the all important medium-term trend and the four key indicators to watch. Diving into the chartbook, there are flag breakouts working in IWM and XLI. REITs are perking up and making good on their Bollinger Band breakouts. The gold and silver ETFs have bullish patterns and mean-reversion setups in the making. Bond ETFs, however, extended their pullbacks after the Fed announcement. The video finishes with

Weekend Video – Breadth and Key Indicator Overview, Flag Breakouts (IWM), REITs Perk Up, GLD Winds UP and Bonds Extend Pullback Read More »

Timing Models – Overextended, but Breadth and Medium-term Indicators Support Current Upswing

We all know that the S&P 500 is driven by large-caps, especially the big four, which account for over 20% of the index (AAPL, MSFT, AMZN, GOOGL). Furthermore, most of us are aware that breadth measures are not as strong as the S&P 500 and this is reflected in the S&P 500 EW ETF (RSP), which has yet to clear its June high. Breadth, however, is not exactly weak. It is just strong enough to sustain the advance. In other words, the cup is half full, not half empty.

Timing Models – Overextended, but Breadth and Medium-term Indicators Support Current Upswing Read More »

ETF Trend/Pattern Ranking and Grouping – Strong Extensions, Second Winds, Modest Extensions, Corrective Patterns, Laggards and Breakdowns

Stock-related ETFs remained strong and many so-called overbought ETFs became even more overbought as their uptrends extended. Many ETFs are in the trend-monitoring or waiting phase. The early breakouts occurred in July and these ETFs followed through with further gains the last several weeks. Some tech-related ETFs stalled in late July and early August, but caught a second wind with breakouts over the last few weeks.

ETF Trend/Pattern Ranking and Grouping – Strong Extensions, Second Winds, Modest Extensions, Corrective Patterns, Laggards and Breakdowns Read More »

Timing Models – SPY Tags a New High, Medium-term Indicators Favor the Bulls and SPX Breadth Model Remains Bullish

The bulk of the evidence remains bullish for large-caps, large-cap techs and mid-caps, but mixed for small-caps. I am also seeing mixed performance within the S&P 500, especially when looking at the equal-weight sectors. Technology, Healthcare and Consumer Discretionary remain strong, while Finance, Energy and REITs are weak. Finance is the only big sector that shows underlying weakness though.

Timing Models – SPY Tags a New High, Medium-term Indicators Favor the Bulls and SPX Breadth Model Remains Bullish Read More »

Scroll to Top