The next Chart Trader will be posted on Thursday morning, May 23rd.
Stocks remain strong with strength broadening. Even so, the old leaders are still the current leaders. The S&P 500 SPDR, Nasdaq 100 ETF and Technology SPDR hit new highs over the last few days. Large-caps and large-cap tech continue to lead the charge. Today’s report will provide updates on the breakouts in some key tech ETFs and then look at the long-term patterns for the biotech ETFs. We have one new setup and several setups from last week that remain in play. I will update the charts for these setups as well.
Weight of Evidence Remains Bullish
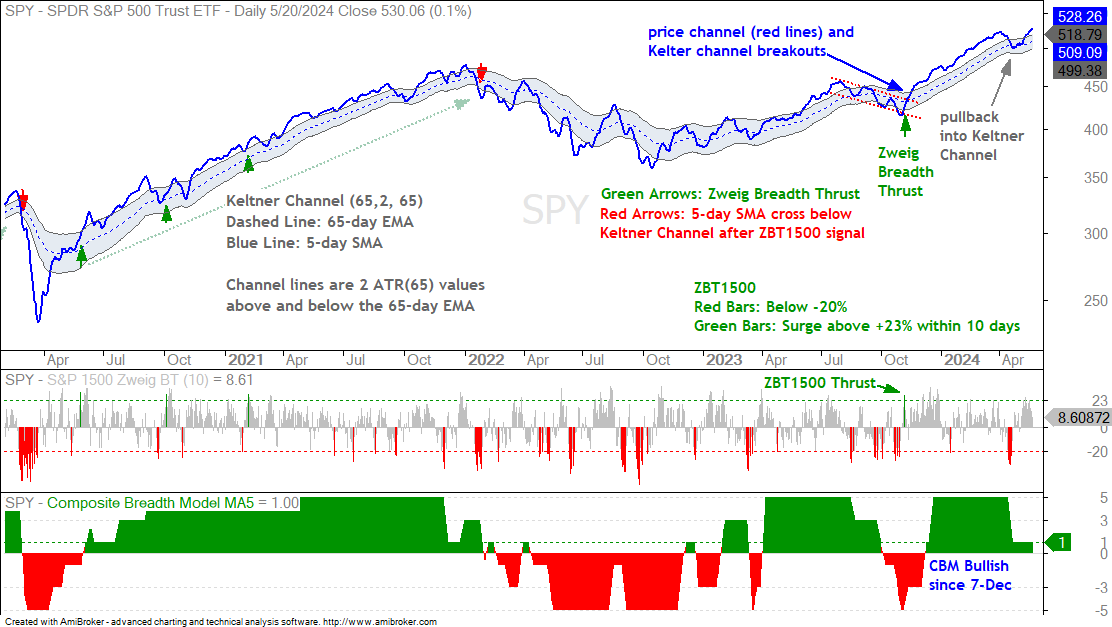
The weight of the evidence remains bullish for stocks. SPY dipped into the Keltner Channel in April and this was a pullback within an uptrend. The ETF advanced the last six weeks, moved out of the Keltner Channel and hit a new high recently. This bullish price action confirm the long-term uptrend.
The bottom window shows the 5-day SMA of the Composite Breadth Model at +1. It fell from +5 to +1 because the S&P 500 and S&P 1500 Thrust Models triggered bearish in mid April. This is testament to the strong selling pressure seen in a short time period. The S&P 500 and S&P 1500 Trend Models remain bullish and the SPX 5-day SMA is above the 200-day SMA. Thus, three of the five inputs are bullish and we remain in a bull market.
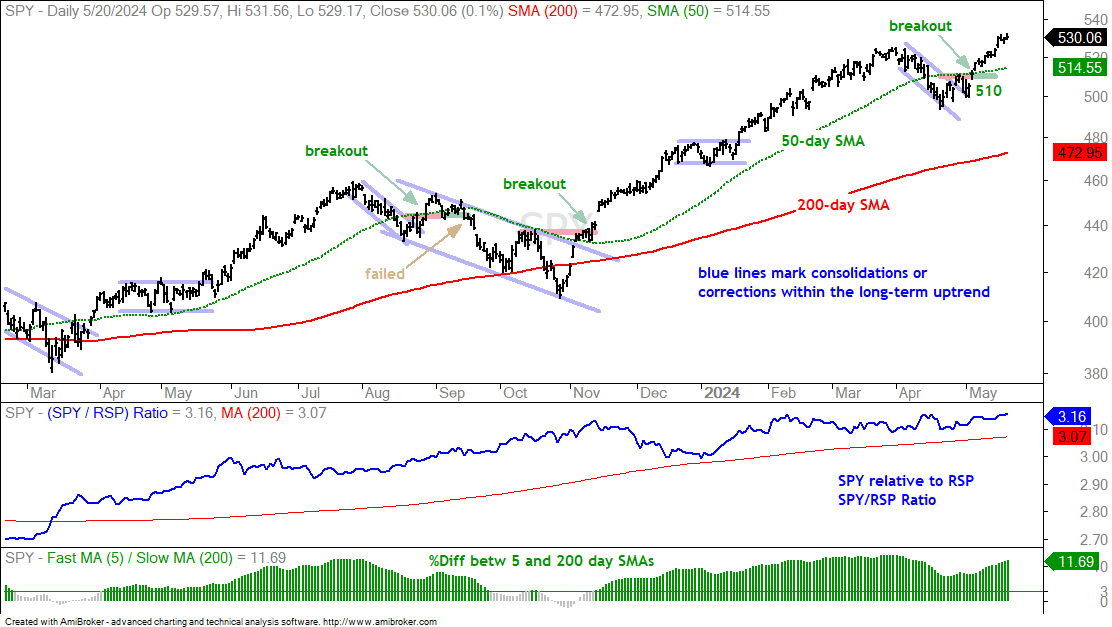
The next chart shows SPY well above its rising 200-day SMA and near a new all time high. The move above the March high (prior high) is not a “breakout”. It is simply a higher high. Uptrends are based on higher highs and higher highs are “expected” in uptrends. Prior highs are not resistance levels.
Short-term, the ETF pulled back into mid April with a falling flag pattern and broke out with a surge above 510 on May 3rd. SPY also broke the 50-day SMA on May 3rd. I compared this breakout with the falling flag breakout in late August 2023, which ultimately failed. The early May breakout did not fail as SPY followed through with further gains. SPY is in the middle of an upswing right now and there is no setup on this chart.
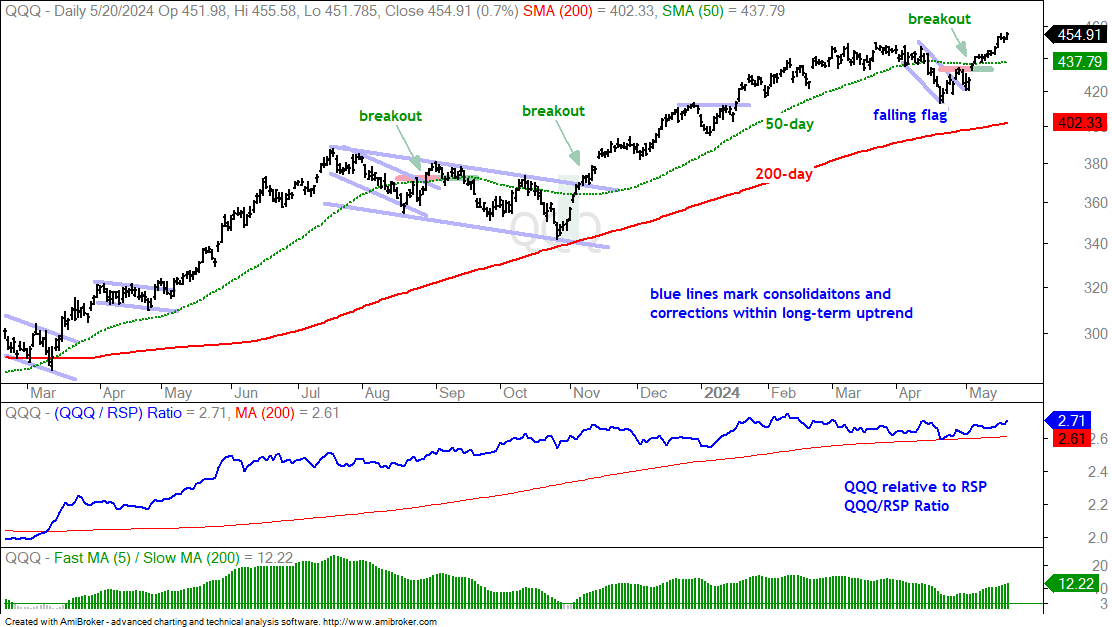
The next chart shows QQQ with similar characteristics. The ETF hit a new high in March, corrected into mid April and broke falling flag resistance on May 3rd. QQQ held this breakout and extended higher the last few weeks. The ETF notched another new high this week. QQQ is in the middle of an upswing and there is no trading setup on this chart.
Chart Analysis, Setups and Trading Ideas
The following charts show price bars with the 200-day SMA (red line), the 50-day SMA (green line), the price-relative (ITB/RSP ratio) with the 200-day SMA and the percentage difference between the 5 and 200 day SMAs. On the price chart, I am looking for tradable pullbacks within a bigger uptrend or bullish consolidation patterns. With the price-relative, I am looking for relative strength. The price-relative (ITB/RSP ratio) rises when the ETF or stock outperforms. And finally, the percentage difference between the 5 and 200 day SMA is bullish (long-term uptrend) with a move above 3% and stays bullish until a move below -3%. This basically measures the tide or long-term bias.
Software, Cloud and Semis Extend on Breakouts
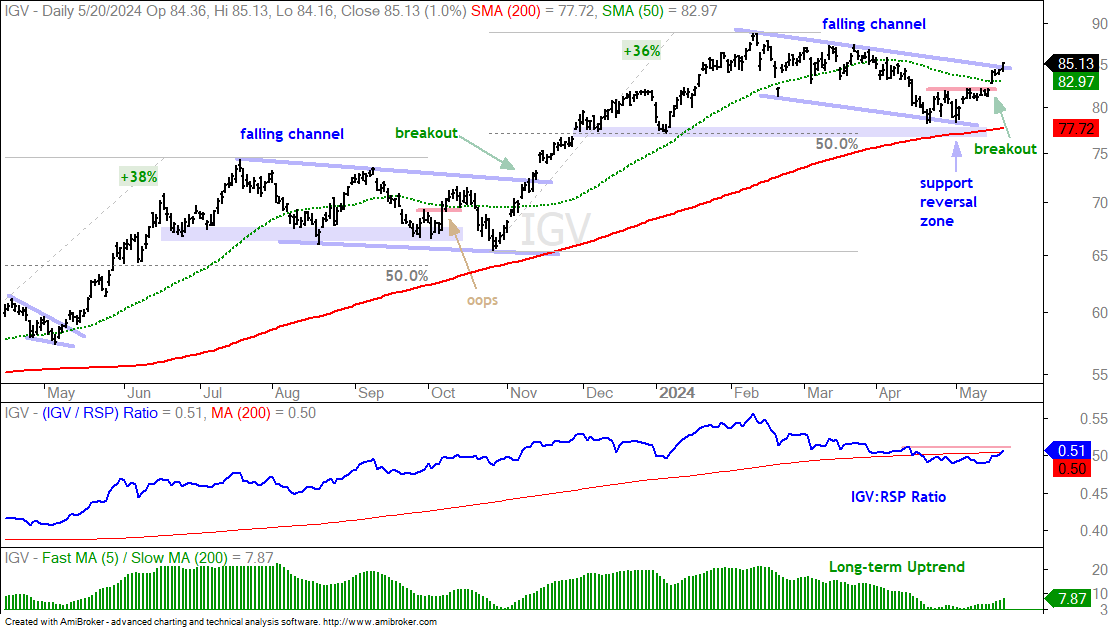
The Software ETF (IGV), Cloud Computing ETF (SKYY) and Semiconductor ETF (SOXX) have slightly different patterns, but all three are moving higher and extending after breakouts. The first chart shows IGV with a new high in February and a falling channel correction into May (~3 months). Notice that the falling channel correction from mid July to late October also lasted around 3 months. The current falling channel retraced almost 50% of the prior advance and almost tagged the rising 200-day SMA. I was watching for a breakout within this pattern over the last few weeks and we got one four days ago. This short-term breakout reverses the swing within the falling channel and increases the chances of a bigger breakout. Keep in mind that this falling channel is a correction within a bigger uptrend and a breakout would project a move to new highs. IGV broke the upper line with a strong close on Monday.
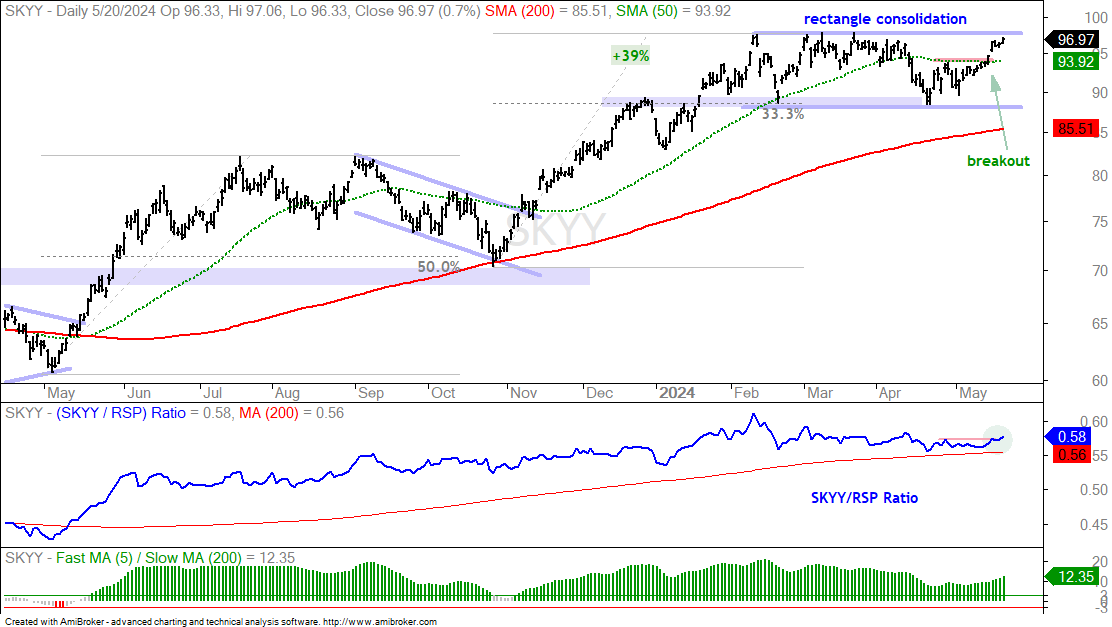
The next chart shows the Cloud Computing ETF (SKYY) with a rectangle consolidation since February. This is also a consolidation within a bigger uptrend and a bullish continuation pattern. The swing within the pattern was down from mid March to mid April. SKYY reversed this downswing with a short-term breakout five days ago. This short-term breakout increases the chances of a bigger breakout at 98, and a fresh 52-week high.
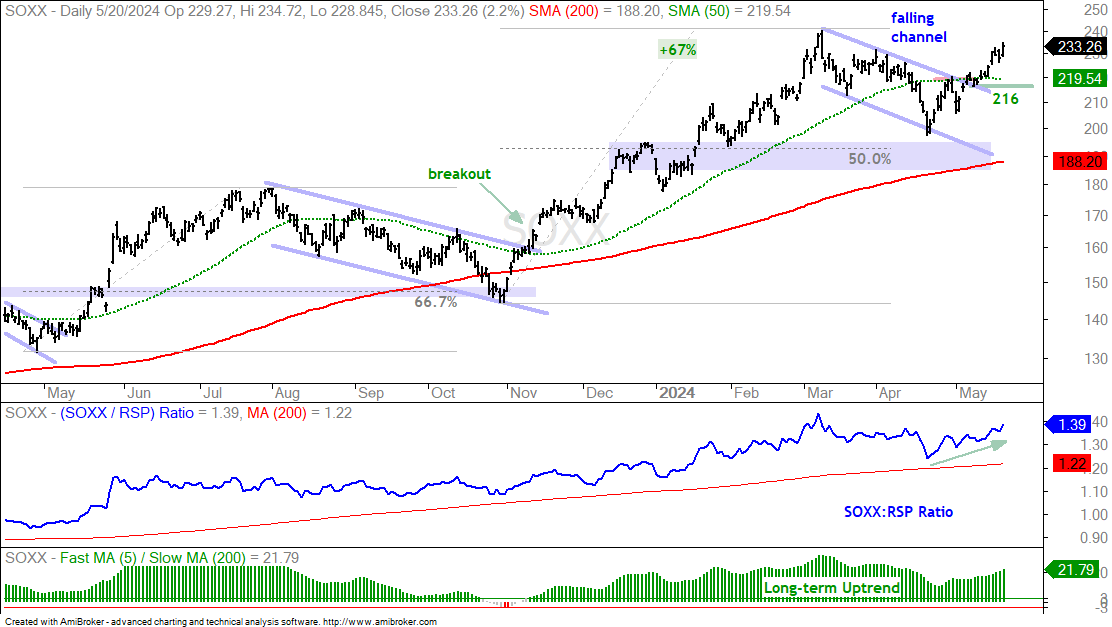
The next chart shows the Semiconductor ETF (SOXX) with a falling channel breakout on May 6th and follow through over the last two weeks. Again, SOXX hit a new high in March and corrected with a falling channel that retraced less than 50% of the prior (67%) advance. This channel breakout signals an end to the correction and a resumption of the bigger uptrend. A strong breakout should hold so a close below 216 would argue for a re-evaluation.
Cybersecurity and Fintech Join Breakout Parade
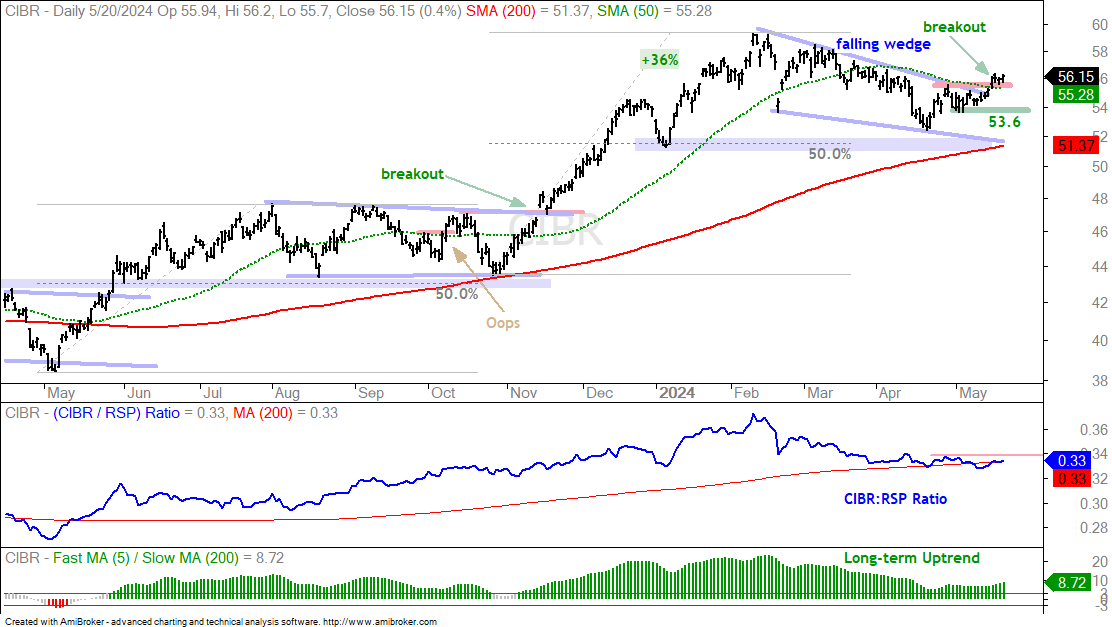
The Cybersecurity ETF (CIBR) could take a hit on the open today because Palo Alto Networks (PANW) is down sharply after hours (negative reaction to earnings). Despite the woes with PANW, CrowdStrike (CRWD) is near a 52-week high and the ETF has a breakout working. The three largest holdings are: Broadcom AVGO (6.77%), CrowdStrike (6.7%) and Palo Alto (6.49%). AVGO is also trading near a 52-week high. The chart shows CIBR with a falling wedge correction from February to May. We know the drill here. CIBR popped four days and broke wedge resistance, and the 50-day SMA. This is bullish price action that signals a continuation of the bigger uptrend. The early May lows mark re-evaluation support
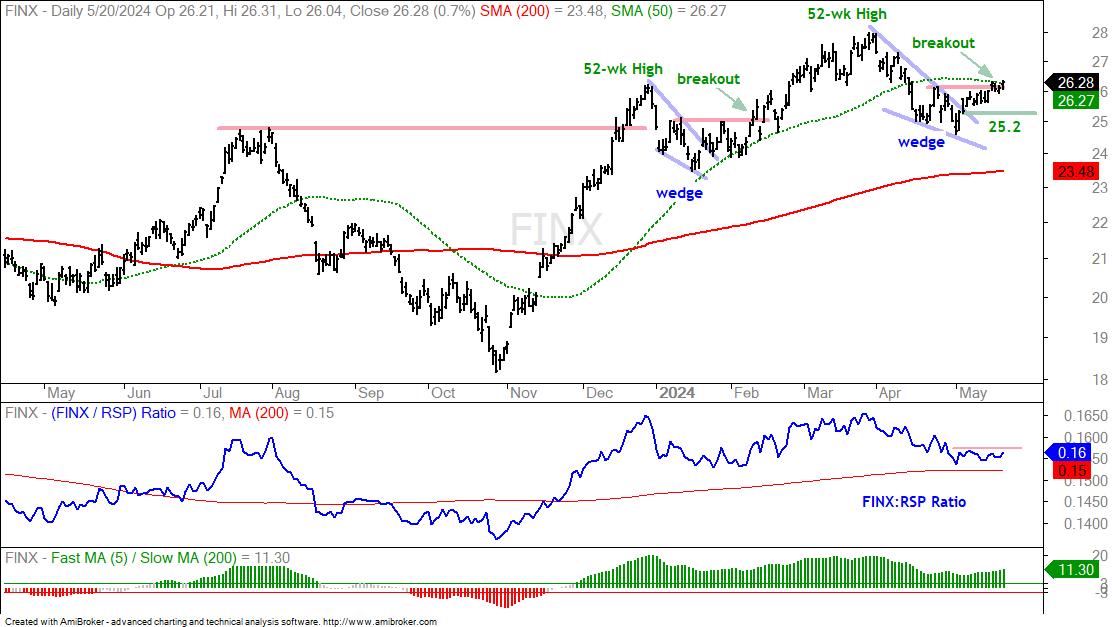
The next chart shows the FinTech ETF (FINX) with a new high in late March and a sharp pullback into mid April. A falling wedge formed and the ETF broke out with a bounce the last few weeks. Mostly recently, it broke the 23-April high (red line) and is challenging the 52-day SMA. This breakout signals an end to the corrective period and a resumption of the bigger uptrend. I am marking re-evaluation support at 25.20.
Biotech ETFs Breaking out of Bases
Biotechs have been lagging for a long time, but the three big biotech ETFs built large bases and show signs of strength. The Biotech SPDR (XBI) is a broad-based equal-weight ETF with 136 stocks. The Biotech ETF (IBB) has 216 stocks, but the top 10 account for 52%. The Biotech ETF (BBH) has just 26 stocks and the top 10 account for 69%. Overall, IBB and XBI offer more exposure to the group as a whole.
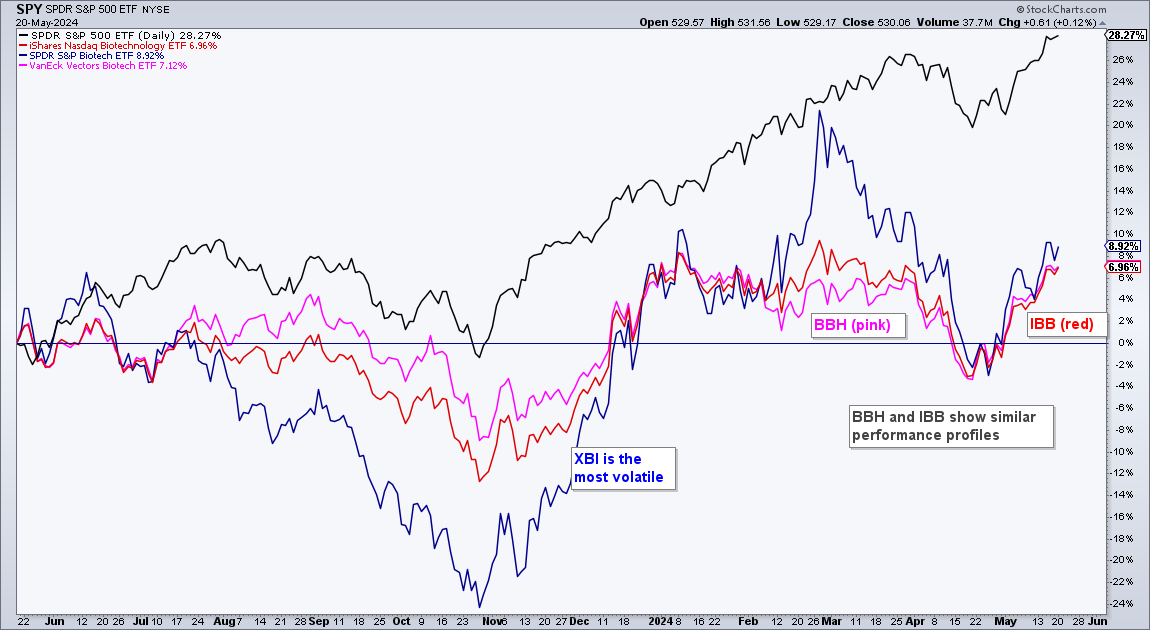
These three ETFs are up between 7 and 9 percent over the past year, whereas SPY is up 28%. The chart below shows one year performance for these three ETFs. XBI is the most volatile with the biggest downswing into October (-24%) and the biggest upswing into March (+22%). BBH and IBB track quite closely because they are driven by their large-cap holdings.
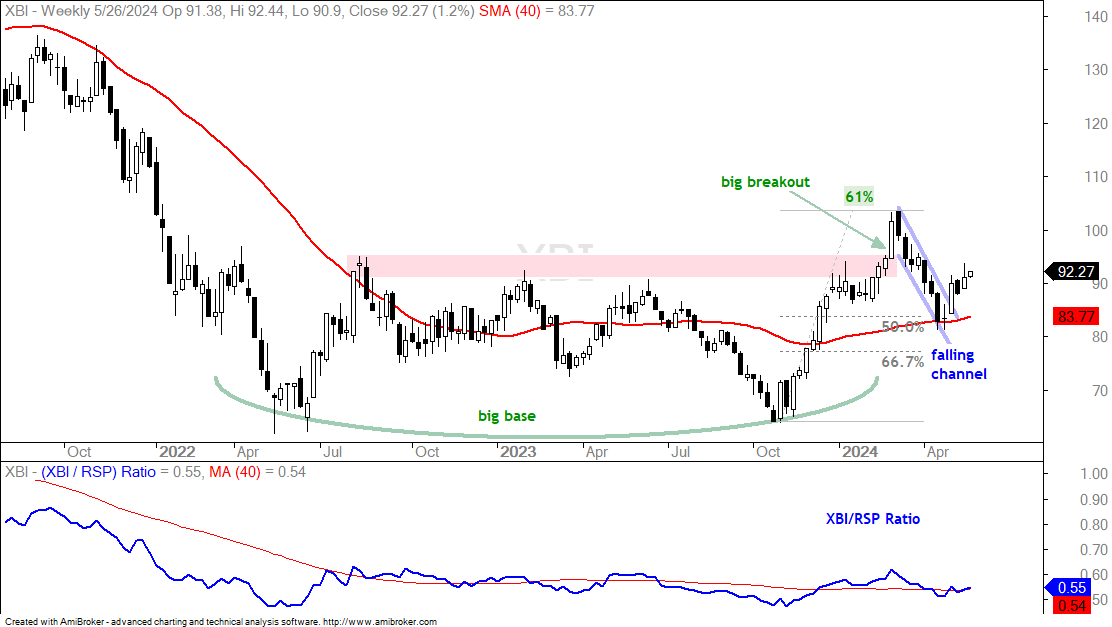
The first chart shows weekly candlesticks for the Biotech SPDR (XBI). We can see a big base from April 2022 to October 2023. XBI surged with the market from October to December, broke the resistance zone (red) and recorded a 52-week high. After this 61% advance, XBI retraced just over 50% and returned to the 40-week SMA (red line). A falling channel formed and XBI broke out with a surge three weeks ago. This breakout is bullish and signals a continuation of the October-December advance. A close below the 40-week SMA would call for a re-evaluation.
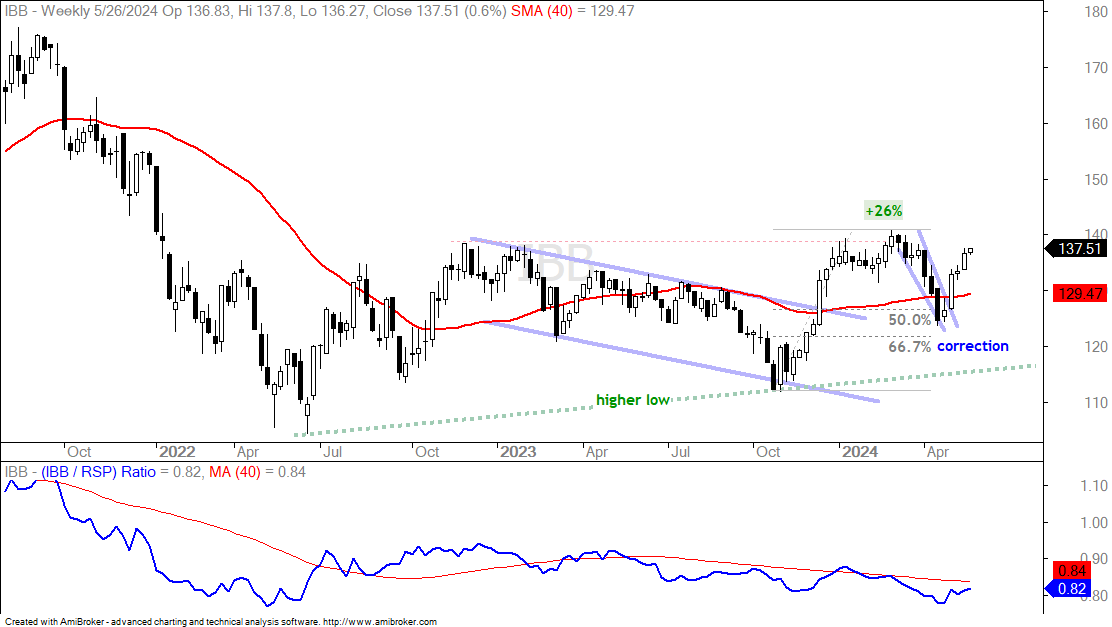
The next chart shows the Biotech ETF (IBB) surging 26% from October to March and hitting a 52-week high. Evidence points to an uptrend because IBB formed a higher low in October and a higher high in March. IBB corrected after this new high with a decline that retraced 50-67 percent of the prior advance. A sort of wedge formed and the ETF broke out with a surge the last four weeks. This breakout signaled a continuation of the bigger uptrend and projects a move to new highs. I would re-evaluate on a close below the 40-week SMA.
ADP Breaks Out of Triangle
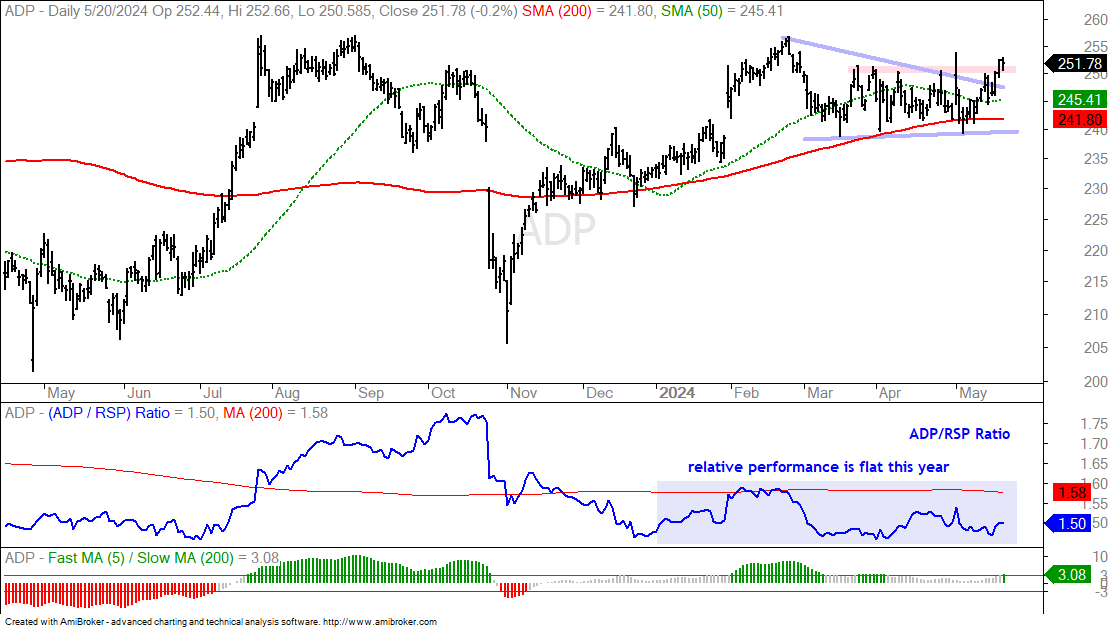
The next chart shows Automatic Data Processing (ADP) with a big advance from late October to February and a corrective period into May. A triangle formed over the last few months and this represents a rest within the bigger uptrend. ADP held the 200-day SMA during this consolidation and established support in the 240 area. Most recently, ADP surged the last two weeks and broke short-term resistance. This breakout signals a continuation of the bigger uptrend and projects a move to new highs. I would re-evaluate on a close below the 200-day SMA.
Last Week's Setups Still in Play
There are several setups from last week that are still in play. This means they have yet to break out and remain within their patterns. Most of my setups are bullish continuation patterns, such as wedges, channels, flags and triangles within a bigger uptrend. Note that Hubspot (HUBS), Square (SQ), MedPace (MEDP) and Neurocrine Biosciences (NBIX) were covered on Thursday and these setups remain in play. The Bitcoin ETF (IBIT) was also covered and it followed through on its breakout. Advanced Micro Devices (AMD) and SuperMicro Computer (SMCI) were covered last Tuesday and both broke out last week. Eli Lilly (LLY) and Merck (MRK) were also covered and they remain within their consolidation patterns. The charts below show updates for HUBS, SQ, MEDP, NBIX, LLY and MRK.
HubSpot Corrects to Support Zone
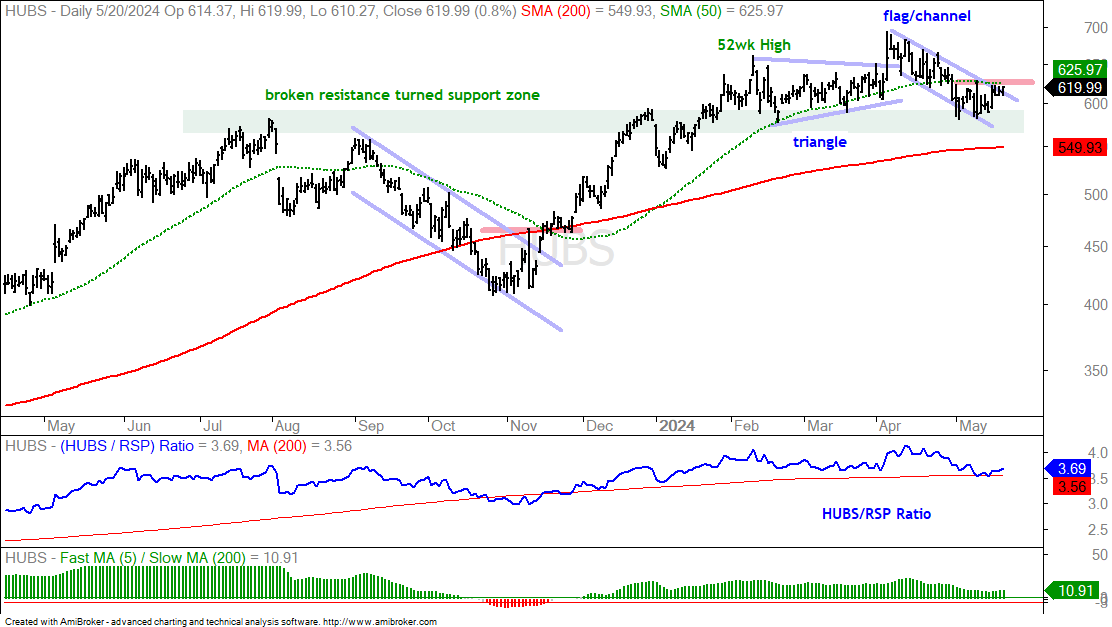
The next chart shows HubSpot (HUBS) with a triangle breakout and new high in mid April. This breakout did not hold as the stock fell back to the 600 area. Even so, this is a big support zone marked by prior resistance and the February-March lows (green shading). A falling flag/channel formed with the current pullback and I still view this as a correction within a bigger uptrend. A breakout at 626 would be bullish.
MedPace Consolidates after Hitting New High
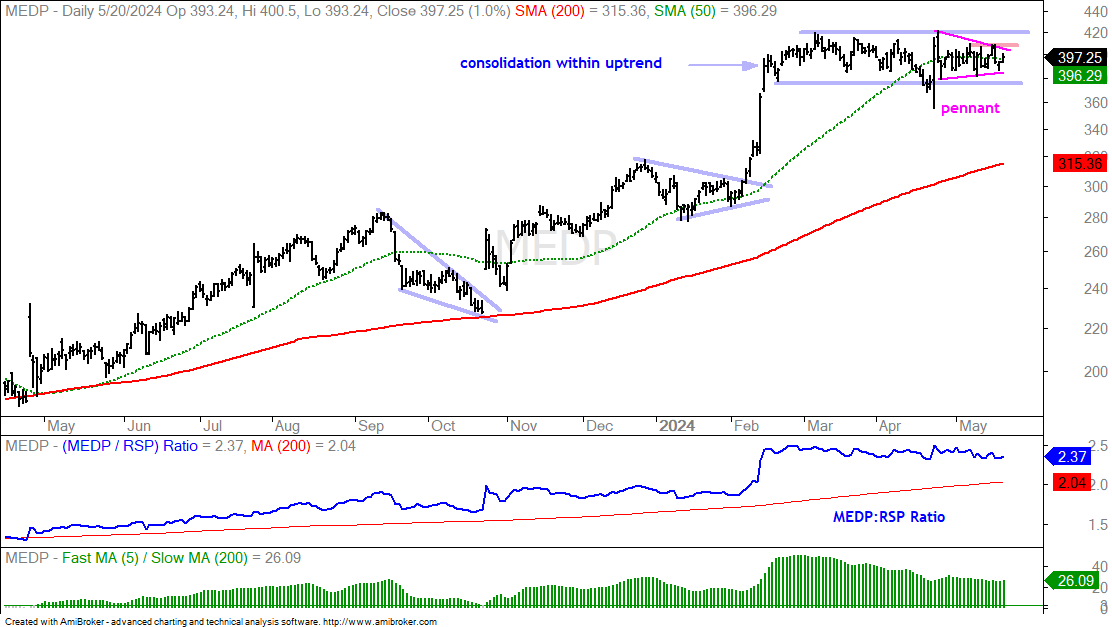
The next chart shows Medpace (MEDP) with a surge to new highs in February and a long consolidation into May. A consolidation within a bigger uptrend is typically a bullish continuation pattern. As such, a breakout would signal a continuation of the larger uptrend. Within the pattern, the stock turned volatile on April 23rd with a spike to 355 and then formed a pennant. MEDP is breaking out of this pennant and this increases the odds of a bigger consolidation breakout.
Neurocrine Biosciences Breaks out within Consolidation
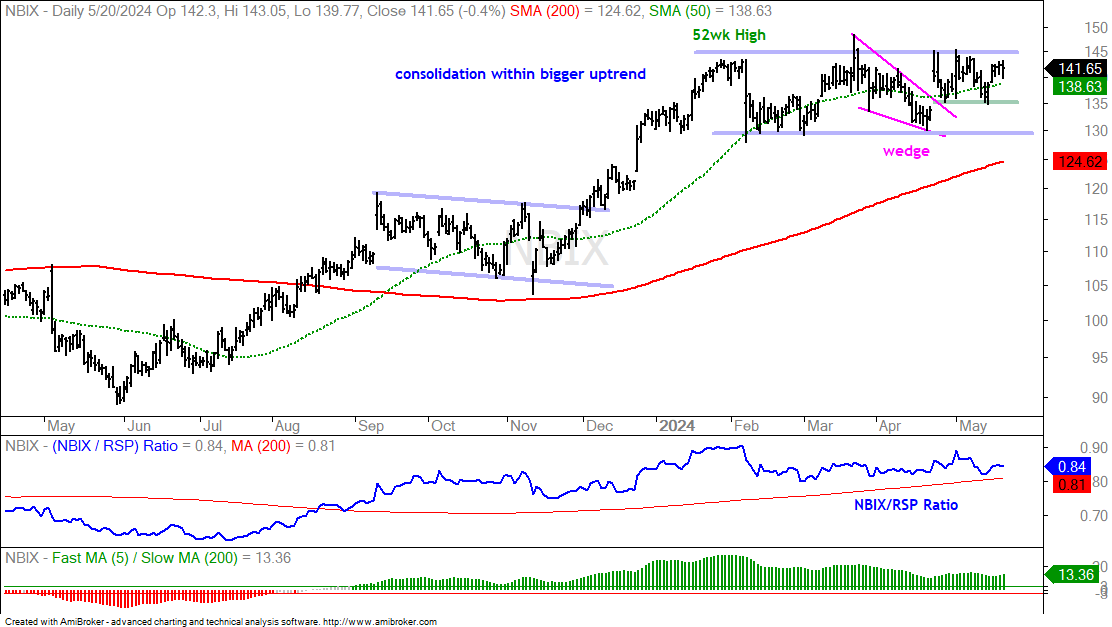
The next chart shows Neurocrine Biosciences (NBIX) sharp move higher into late January and a 52-week high. NBIX then moved into a trading range, which is a consolidation within a bigger uptrend. Within this range, the stock tagged a new high in mid March, but then fell back with the rest of the market in April. A falling wedge took shape and the stock broke out with a gap surge in late April. This is a breakout within the bigger consolidation and this increases the odds for a bigger breakout at 145. A close below 135 would negate this setup.
Square Corrects after 52-week High
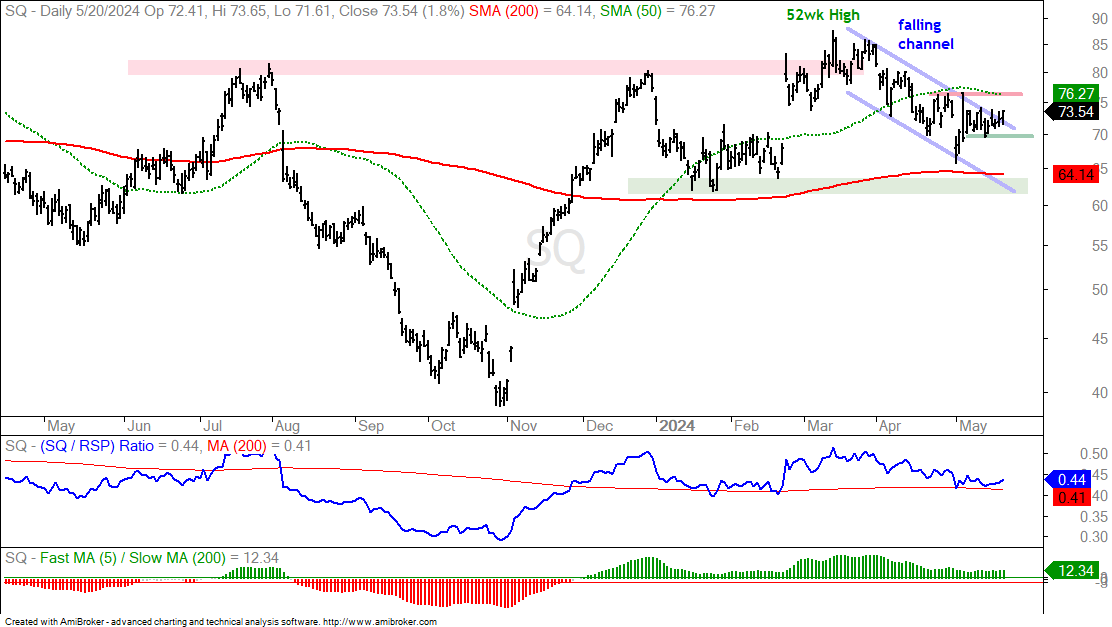
The next chart shows Square (SQ) gapping up in late February and hitting 52-week highs in mid March. This surge and breakout did not last as the stock fell back in April with a falling channel. Despite failing to holding the breakout-surge, the long-term trend is still up and this is still viewed as a correction within a bigger uptrend. SQ established resistance at 76.5 in late April and early May. A breakout here would signal a short-term trend reversal and also break the 50-day SMA. I would view this as bullish and project a move to new highs. Upon a breakout, I would mark re-evaluation support at 69.50.
Lilly and Merck Consolidate within Uptrends
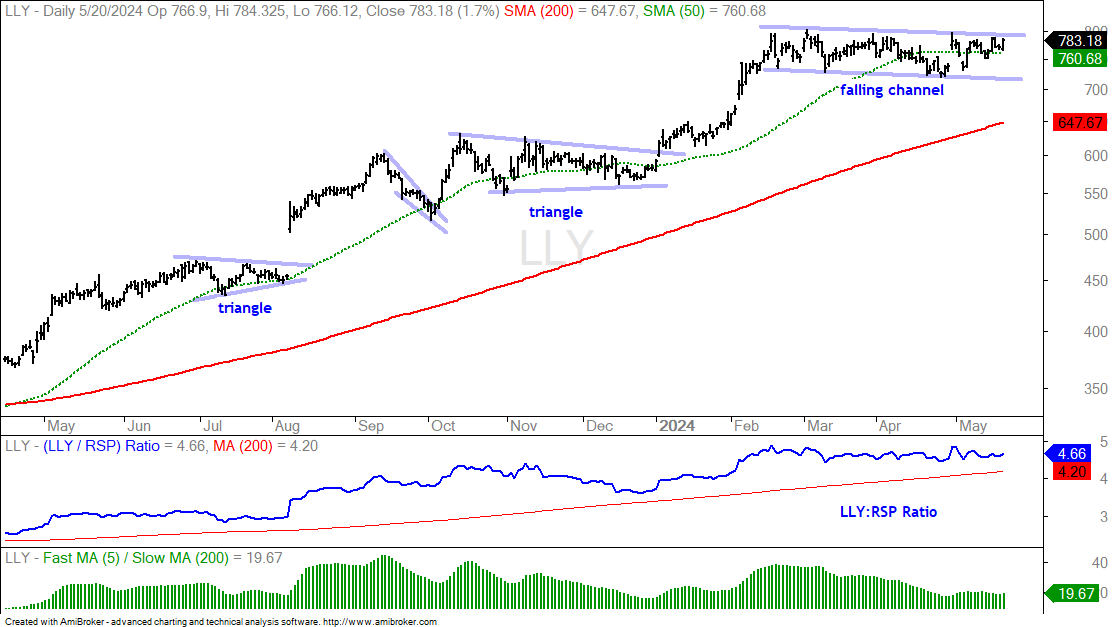
The next two stocks are key components of the Healthcare SPDR (XLV). Eli Lilly (LLY) accounts for 11.4% and is the biggest holding. Merck (MRK) accounts for 6.2% and is the fourth largest holding. Thermo Fisher (TMO), which I will also feature, accounts for 4.3% and is the sixth largest. Note that I featured XLV on May 2nd as it bounced off a Support-Reversal Zone. The first chart shows LLY with a surge to new highs in February and an extended consolidation into May. This looks like a falling channel and I consider it a bullish continuation pattern. LLY surged in late April with a gap, but did not break out. I am marking resistance at 800 and a breakout here would be bullish.
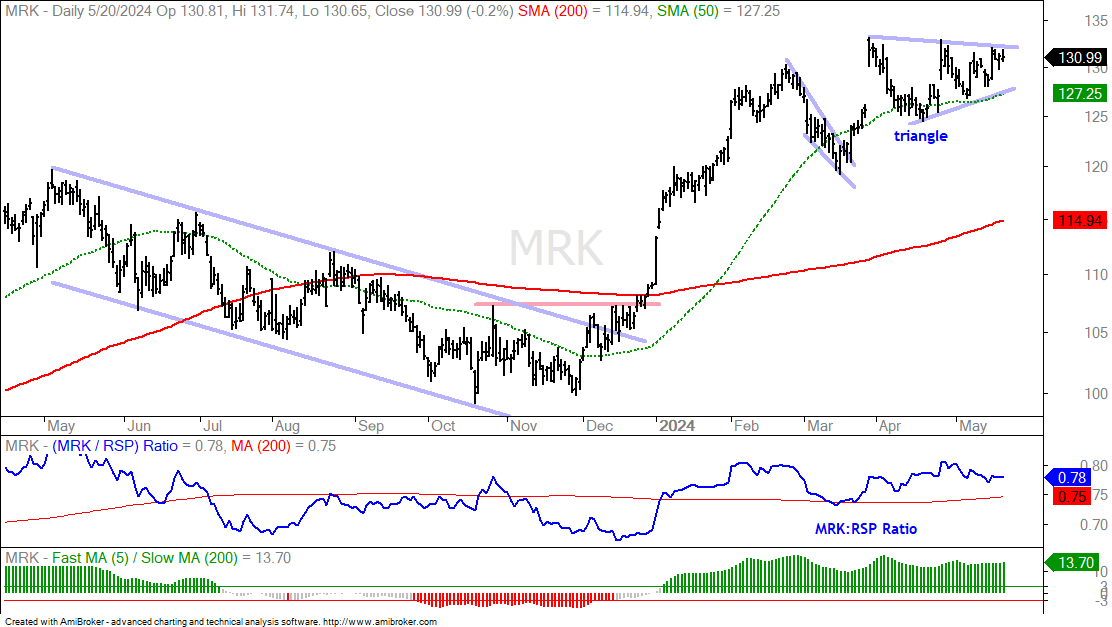
The next chart shows MRK with a gap-surge to new highs in late March and a consolidation into May. This triangle is a rest with a bigger uptrend and a bullish continuation pattern. A breakout at 132 would signal a continuation higher.