Using the ATR Trailing Stop During Extending Periods
TLT and 10yr Yield Hit Make or Break Zones
EW Consumer Discretionary Trends Lower
Home Construction ETF Fails to Hold Breakout
Northrop Grumman Goes for a Breakout
Varonis Systems Firms at Support-Reversal Zone
The next Chart Trader will be posted on Tuesday morning, May 28th.
Nvidia (NVDA) released blowout results yet again and surged some 6.5% higher in after hours trading. This move is stoking the large-cap tech and AI trade. AMD (chips), HPE (data center), DELL (data center) and TSM (chip manufacturing) are all trading higher. Once again, we are seeing tech stocks lead the market and this leadership is helping the S&P 500 SPDR (SPY). Note that Nasdaq 100 stocks account for around a third of the weighting in the S&P 500.
SPY, QQQ and the Three Moves/Conditions
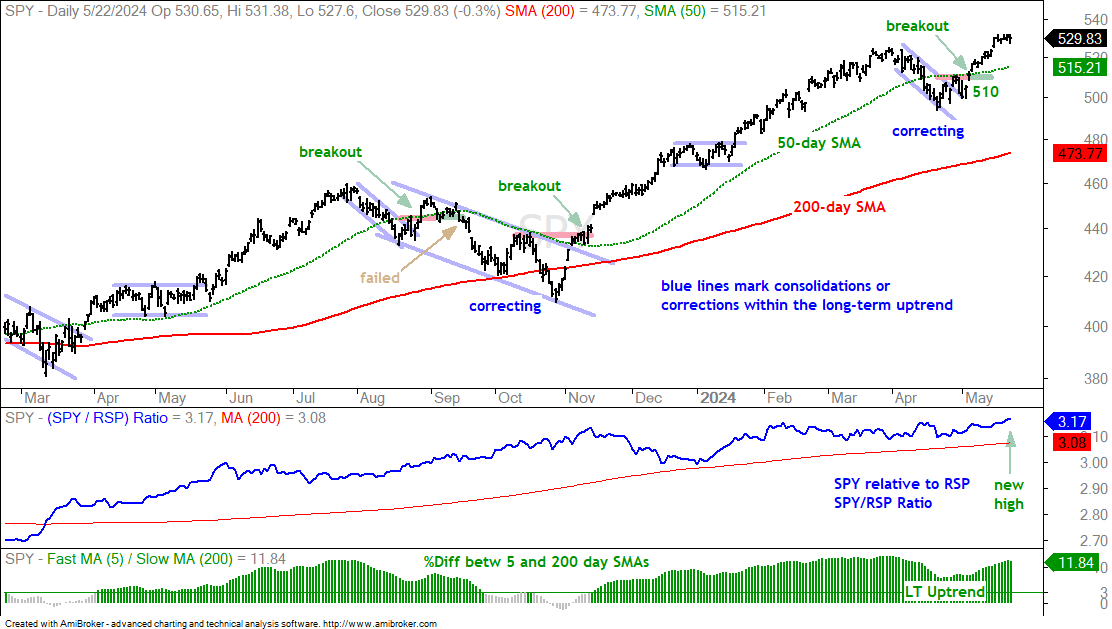
There are three types of moves/conditions on a price chart. First, price is trending up or trending down. Second, price is correcting or extending within the bigger trend. Third, price is overbought within the extension or oversold within the correction. Here is a live example with SPY. First and foremost, price is trending up. Price is above the rising 200-day SMA and the 5/200 Day Differential is bullish (bottom window). This indicator signals a long-term uptrend with a move above +3% and a long-term downtrend with a move below -3%.
The long-term trend sets our trading bias. I look for bullish setups, corrections and oversold conditions when the long-term trend is up. Bearish setups are preferred in a long-term downtrend, but I really don’t trade the downside. Within an uptrend, price is correcting with a pullback or extending with a move higher. The April pullback marks a correction within the bigger uptrend. SPY broke out at 510 and this marked the start of the extending period. We are currently in the extending period, which means there is no trading setup on the chart.
The third condition is overbought or oversold. Overbought within an uptrend does not mean much because price often becomes overbought and remains overbought as prices extend. Oversold within an uptrend, however, presents traders with an opportunity. An oversold condition occurs during a correction and paves the way for a bounce.
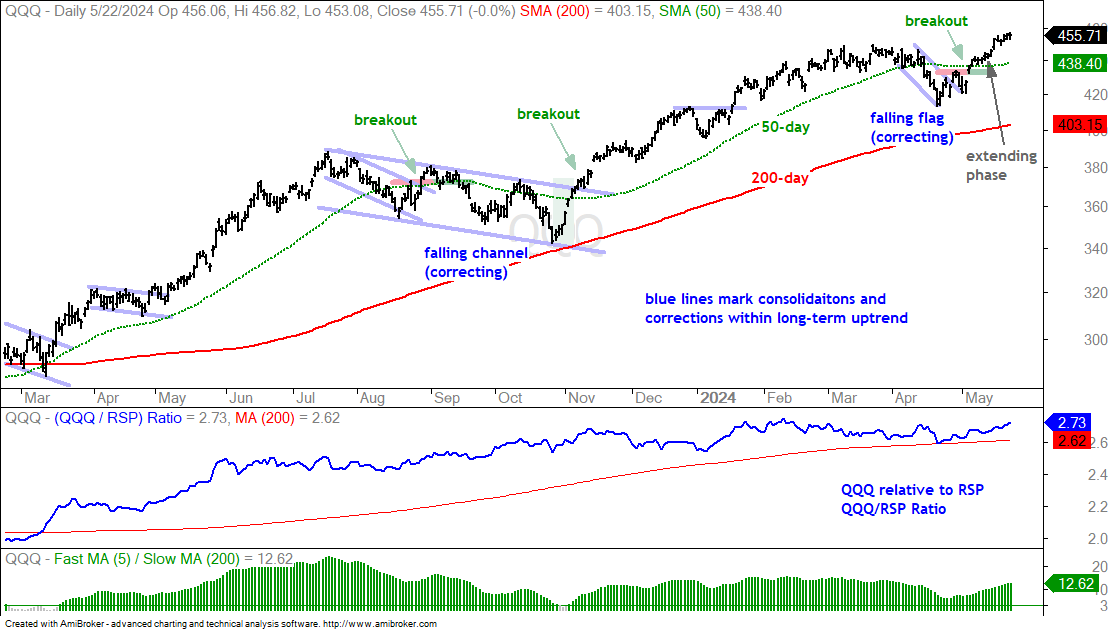
The next chart shows QQQ with similar characteristics. Long-term, price is trending up. Price corrected in April with a pullback. QQQ then broke out around 434 to reverse the short-term downtrend and signal a continuation of the bigger uptrend. Price is currently in the extending phase as QQQ hit a new high this week.
Using the ATR Trailing Stop During Extending Periods
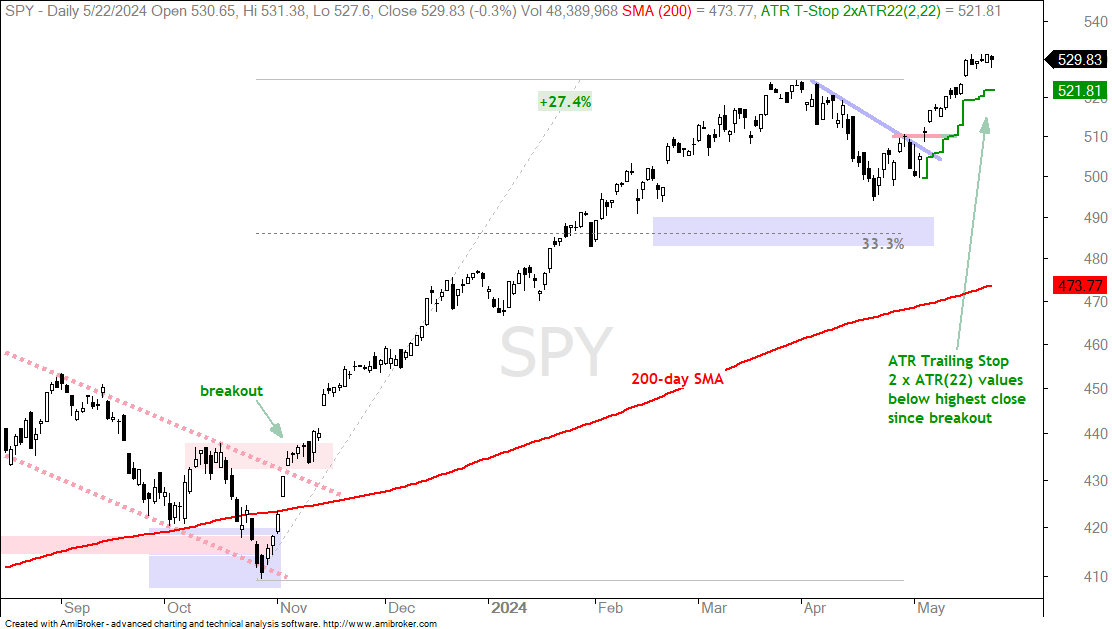
The next charts show SPY and QQQ with short-term breakouts and ATR Trailing Stops. These breakouts occurred on May 3rd so this is when the ATR Trailing Stop starts. The ATR multiplier is adjusted to place the initial stop just below the low before the breakout, which is the low on May 1st. For SPY, I used 2 for the ATR multiplier. Notice how this stop trails higher as prices extend after the breakout. ATR Trailing stops can be used during extending periods.
The next chart shows QQQ and I used 3 for the ATR multiplier. This was necessary to place the initial stop below the early May low.
Chart Analysis, Setups and Trading Ideas
The following charts show price bars with the 200-day SMA (red line), the 50-day SMA (green line), the price-relative (ITB/RSP ratio) with the 200-day SMA and the percentage difference between the 5 and 200 day SMAs. On the price chart, I am looking for tradable pullbacks within a bigger uptrend or bullish consolidation patterns. With the price-relative, I am looking for relative strength. The price-relative (ITB/RSP ratio) rises when the ETF or stock outperforms. And finally, the percentage difference between the 5 and 200 day SMA is bullish (long-term uptrend) with a move above 3% and stays bullish until a move below -3%. This basically measures the tide or long-term bias.
TLT and 10yr Yield Hit Make or Break Zones
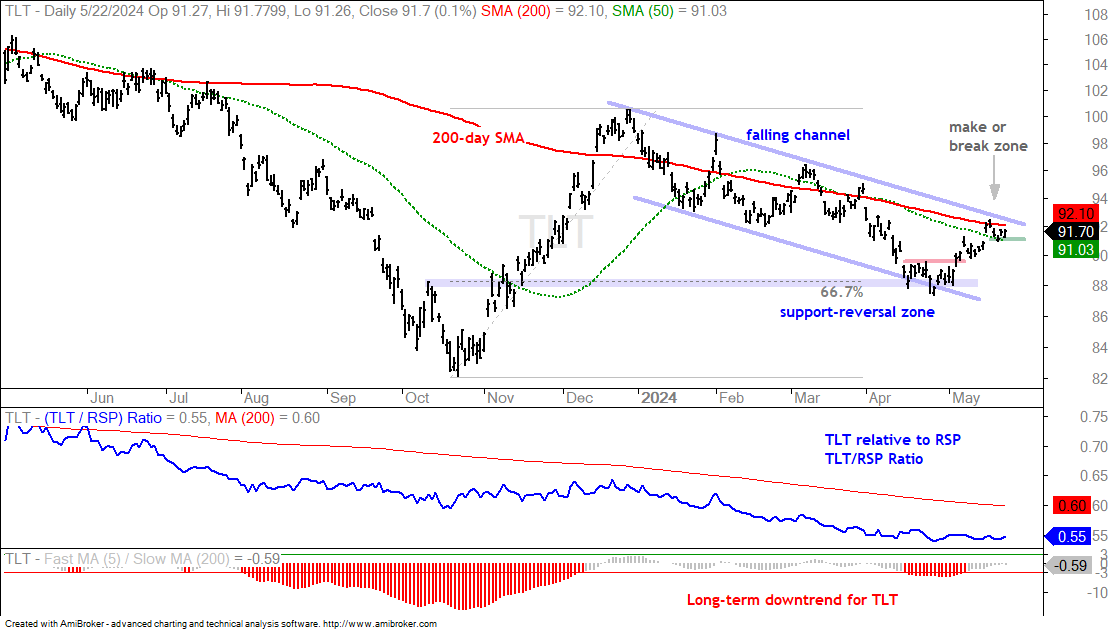
The next chart shows the 20+ Yr Treasury Bond ETF (TLT) hitting a resistance zone after a bounce in May. Overall, the long-term trend is down because the 5/200 Differential remains on a downtrend signal. The medium-term trend is also down with a falling channel this year (blue trendlines). Short-term, the trend is up as TLT advanced to the upper line of the falling channel. Also notice that the 200-day SMA (red line) is near the current close. Further strength above 93 would be bullish and signal a continuation of the October-December advance. A break below the 50-day SMA (91) would reverse the short-term upswing and keep the medium-term downtrend alive.
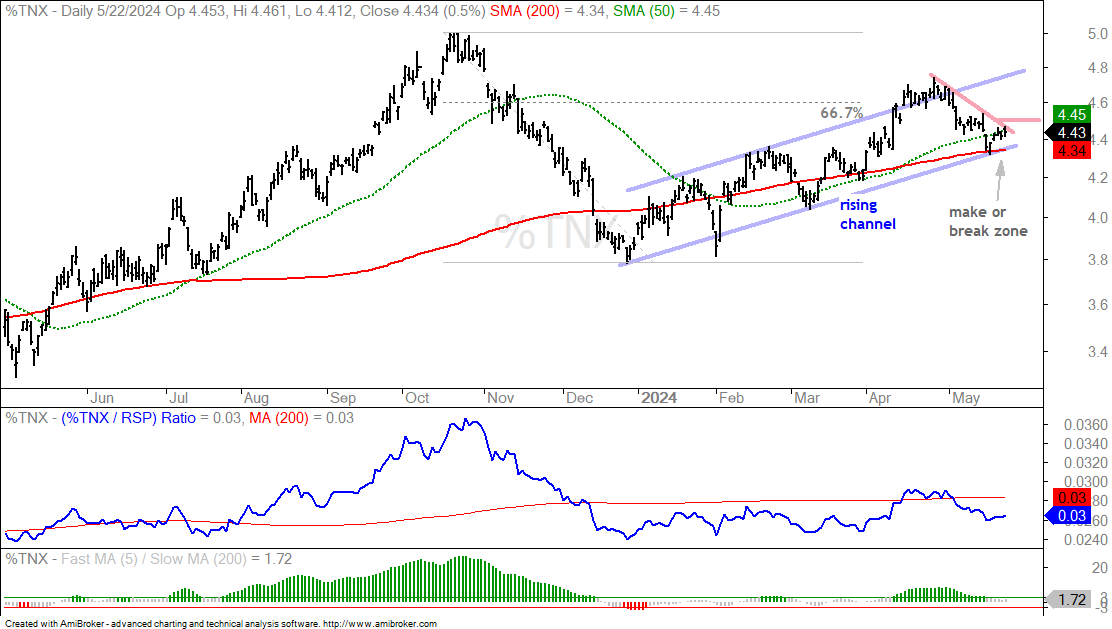
The next chart shows the 10-yr Treasury Yield with a mirror image of TLT. $TNX is rising within a rising channel and at its make or break zone. A break below the 200-day SMA (call it 4.3) would be bearish and signal a continuation of the October-December decline. This would project a move to 3.8% and could be positive for stocks. The swing within the rising channel is down with resistance marked at 4.5 (red lines). A breakout here would signal an upturn and keep the rising channel alive.
EW Consumer Discretionary Trends Lower
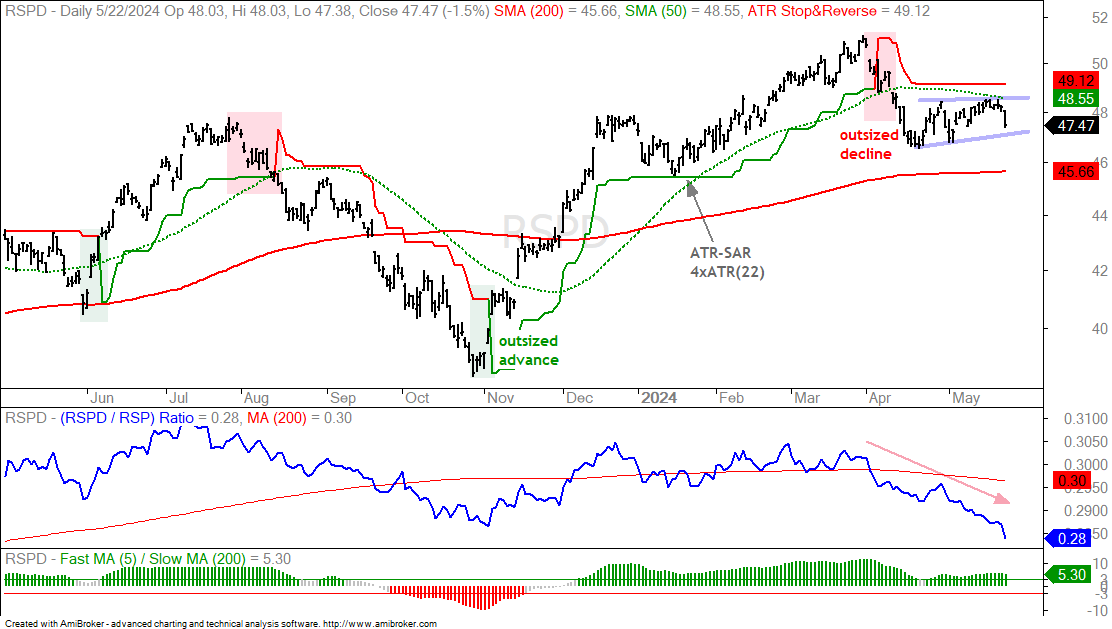
The next chart shows the Equal-weight Consumer Discretionary ETF (RSPD) breaking down in April, stalling into May and falling sharply on Wednesday. The red-green line is the ATR Stop-and-Reverse indicator. It turns green when there is a 4 ATR(22) advance (early November) and red when there is a 4 ATR(22) decline (April). A 4 ATR(22) move is considered an outsized move that can jump-start an extended trend. RSPD experience an outsized decline in April and never recovered after this move. It did not make it back above the 50-day SMA (green line). SPY and QQQ, on the other hand, recovered and broke their 50-day SMAs. RSP consolidated after the April breakdown and formed a triangle of sorts. This is a bearish continuation pattern and a break would signal a continuation of the April decline. The first indicator window shows the RSPD/RSP ratio hitting a 52-week low this week. Relative and absolute weakness in the equal-weight Consumer Discretionary sector is not a good sign for the broader market (outside of tech). This sector represents retail, housing and restaurants.
Home Construction ETF Fails to Hold Breakout
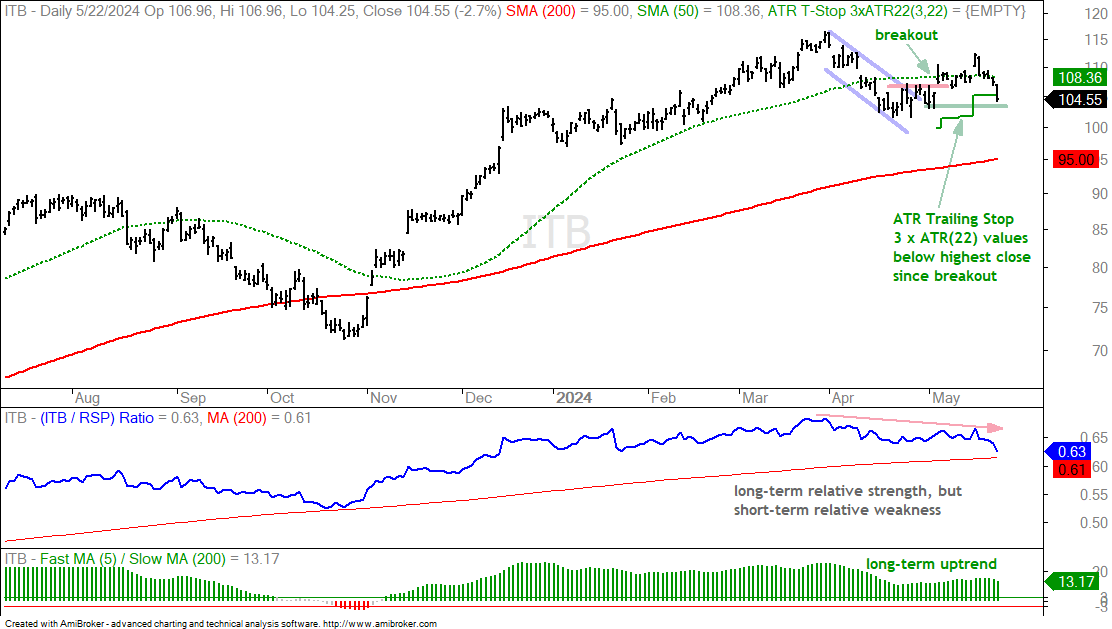
The next chart shows the Home Construction ETF (ITB) with a breakout on May 7th and a sharp move lower the last five days. I featured ITB, Lennar (LEN) and DR Horton (DHI) in the May 7th report/video as they broke short-term resistance. These breakouts are under pressure as all three fell sharply. I added the ATR Trailing Stop (3 ATR(22)) and ITB closed below this level. The inability to hold the breakout is negative, especially after the 3.7% surge on May 15th. I set the re-evaluation level at 103 on May 7th (green line). This is the low just before the breakout. A close below 103 would fully negate this breakout and argue for a test of the 200-day SMA.
Northrop Grumman Goes for a Breakout
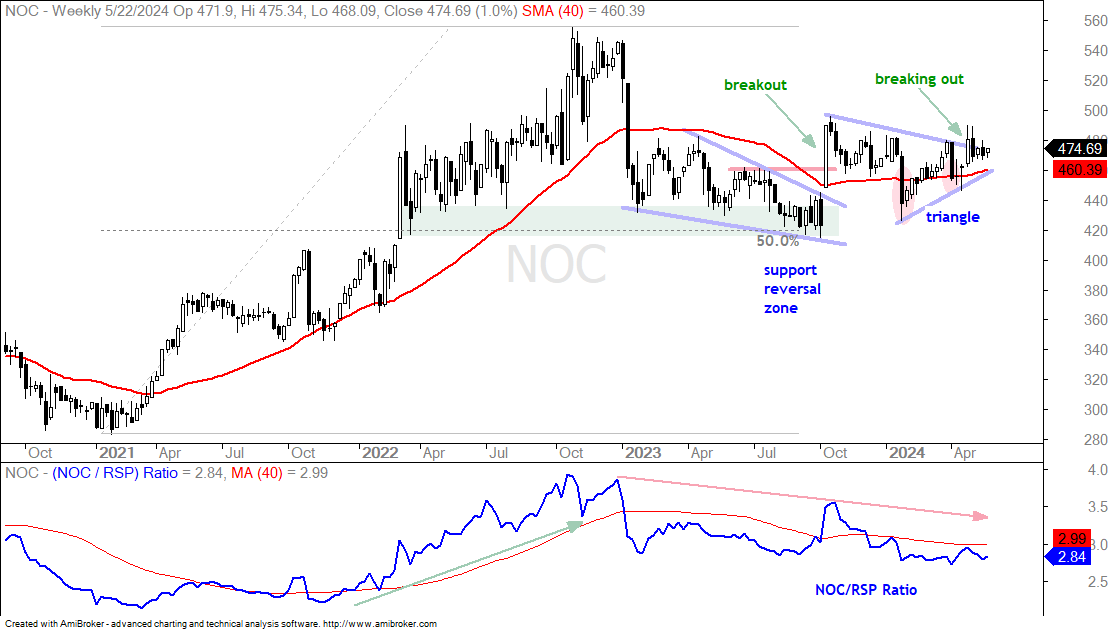
Northrop Grumman (NOC) is part of the Aerospace & Defense ETF (ITA), which is a leading group hitting new highs. The stock is lagging the group overall, but showing signs of strength as it attempts to break out of a six month consolidation. The chart below shows weekly prices with the 40-week SMA. NOC surged and broke out in October 2023. Notice how NOC surged off support from the prior lows (green shading) and 50% retracement. This was the Support-Reversal Zone.
There was no follow through to the breakout as the stock worked its way lower and then broke below its 40-week SMA in late January (red oval). This break did not last long as the stock worked its way higher the last few months. NOC again broke the 40-week SMA with a sharp decline in early April (red oval) and again quickly recovered. Buyers stepped in after these SMA breaks and this is positive. Overall, a triangle is taking shape and the stock is attempting a breakout. This argues for further strength towards the 2022 highs. I would use the rising 40-week SMA, currently 460.39, as a re-evaluation level.
Varonis Systems Firms at Support-Reversal Zone
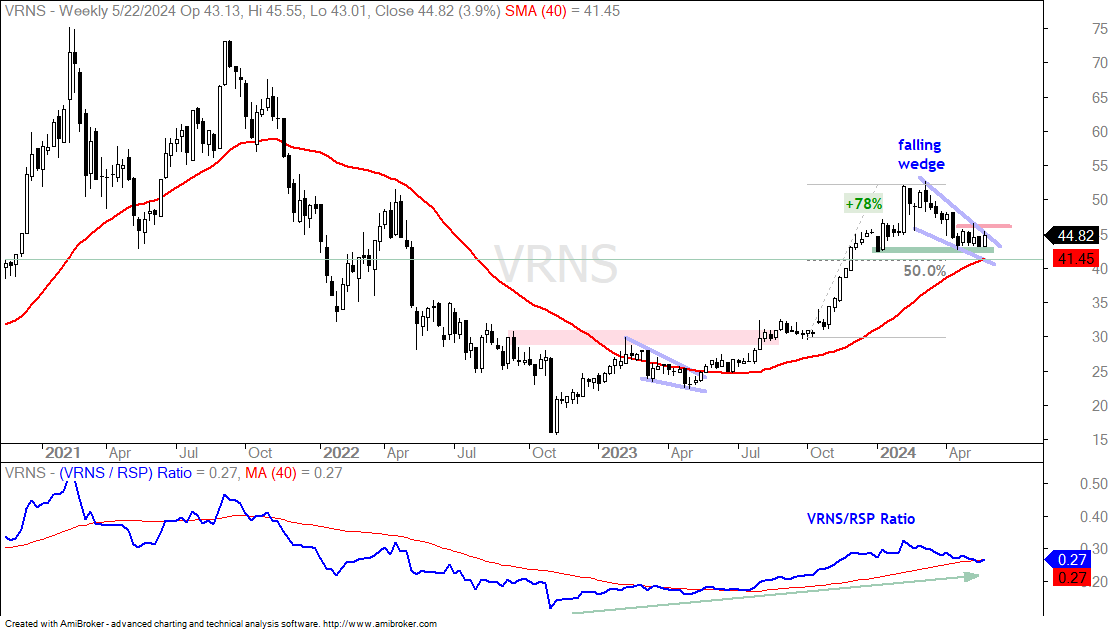
The next chart shows weekly candlesticks and the 40-week SMA for Varonis Systems (VRNS). This stock is part of the Cybersecurity ETF (CIBR), which broke out of a falling wedge pattern in mid May. VRNS led the market higher with a 78% advance from October to February. The stock then retraced almost 50% of this advance with a falling wedge. Notice that the 50% retracement and rising 40-week SMA are in the 41-42 area. Combined with support from the early January low, the stock is trading just above a Support-Reversal Zone.
Technically, the immediate trend is down as long as the wedge falls. VRSN firmed the last five weeks and I am marking resistance at 46. A breakout here would reverse the falling wedge and signal a continuation of the bigger uptrend. Upon a breakout, I would use the rising 40-week SMA as a re-evaluation level. Note that this moving average will rise as older (and lower) prices are replaced with newer (and higher) prices.