
BLOK Sports a Classic Correction Pattern and Setup
We are seeing a bullish setup in an ETF related to Bitcoin. As with IBIT, the long-term trend is up and a corrected unfold over the last few months. The pattern and retracement amount make this a classic correction. More importantly, we are seeing signs that this correction may be ending.
The chart below shows the Transformational Data Sharing ETF (BLOK) hitting new highs in January and March. The bottom window shows the percentage difference between the 5 and 200-day SMAs. This differential exceeded 3% in early November (turned green) and this signals a long-term uptrend. The long-term bias is bullish and this means corrections are opportunities.
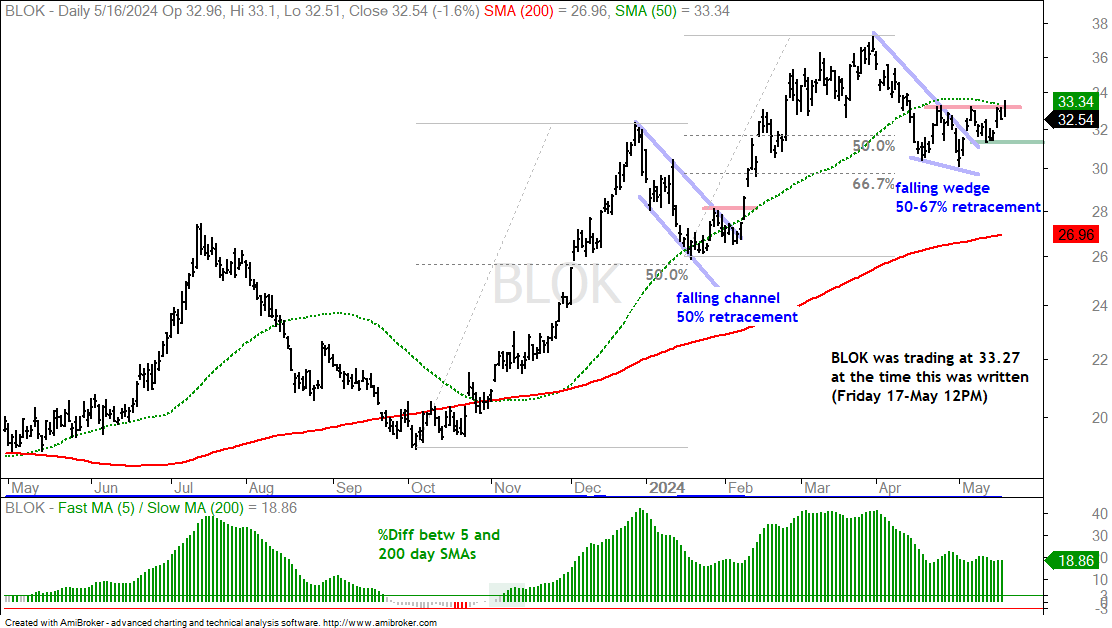
Returning to the price chart, notice the ebb and flow of this uptrend. BLOK surged from October to January and then retraced 50% with a falling channel. The mid February breakout signaled a continuation of the uptrend. BLOK hit another new high and then retraced 50-67% with a falling wedge. This is a classic correction. The ETF firmed the last few weeks and a break above the early May high would be bullish (red line). Signs of strength are emerging because the ETF broke the upper line of the falling wedge.
The chart above shows price bars with the 200-day SMA (red line), the 50-day SMA (green) and the percentage difference between the 5 and 200 day SMAs in the indicator window. On the price chart, I am looking for tradable pullbacks within a bigger uptrend or bullish consolidation patterns. The percentage difference between the 5 and 200 day SMA is bullish (long-term uptrend) with a move above 3% and stays bullish until a move below -3%. This basically measures the tide or long-term bias.