Equity ETF Report – Oversold Bounce – 11 Leaders – And Some Breakouts

The next report will be on Wednesday, March 26th. 

Stocks are in the midst of an oversold bounce, but the weight of the evidence remains bearish. Among other items, I am watching the Zweig Breadth Thrust for signs of a bullish signal that would prove my bearish stance wrong. We have yet to see a thrust signal, which means more follow through it needed.

Stocks broke down with deep declines into mid March (11-13). These deep declines led to short-term oversold conditions, which primed the pump for the current bounce. At this point, I consider this an oversold bounce, as opposed to a bullish thrust that turns the evidence bullish. We need to see strong follow through to go from oversold bounce to bullish thrust.

Overall, commodity and defensive ETFs are leading here in 2025. Today’s report focuses on the leaders that are in uptrends and showing relative strength. Many were setting up bullish in mid March and broke out over the last week or two.

Report Headlines

  • SPY Extends on Oversold Bounce
  • QQQ Leads Oversold Bounce
  • RSP Bounces off Bullish Setup Zone
  • XLK Extends on Oversold Bounce
  • Top Performing ETFs in 2025
  • XLV Maintains 2025 Upswing
  • XLF and XLC Hold Above Rising 200-day SMAs
  • AIQ Reverses Near Bullish Setup Zone   
  • CIBR Reverses Short-term Slide with Breakout  
  • KIE Works its Way Higher After Breakout
  • ITA Breaks Out
  • IBB Bounces within Wedge Pullback
  • IHI Bounces Off Rising 200-day SMA
  • AMLP Breaks Out of Small Corrective Pattern
  • IYZ Bounces off Support Zone

SPY Extends on Oversold Bounce

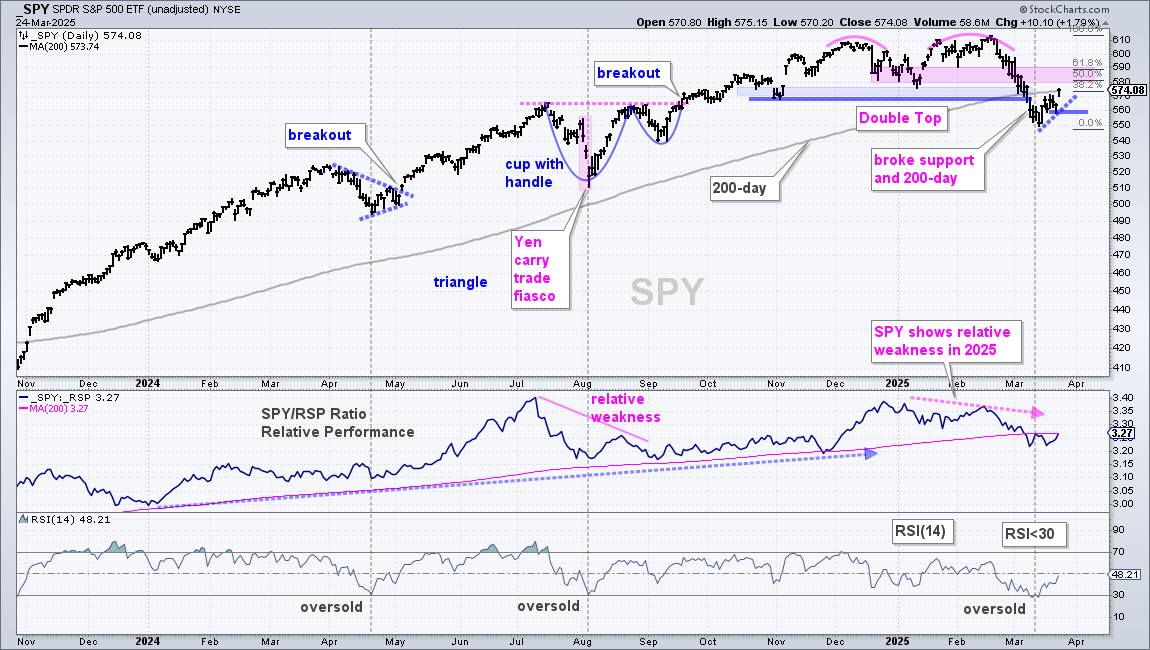
SPY broke Double Top support and the rising 200-day SMA with a sharp decline into early March. These are the breaks that broke the bull’s back as the breadth indicators turned net bearish. SPY became oversold as RSI dipped below 30 on March 11th and 13th. The S&P 500 Zweig Breadth Thrust indicator also became oversold on March 13th. Oversold conditions set the stage for a bounce, which we are seeing as SPY moved back above its 200-day SMA on Monday. I consider this an oversold bounce within a bigger downtrend because the weight of the longer term evidence is bearish. The pink shading marks prior lows (support) that turn into the next resistance zone in the 580-590 area. The 50-61.8% retracements are also in this area.

As noted last week, the 200-day SMA is often a battle zone with downside breaks occurring during periods with higher volatility. This means we could see more than one cross in the coming days/weeks. For example, SPY broke its 200-day on 21-January-2022 and then crossed this key moving average at least six more times from late January to mid April 2022. SPY broke its 200-day SMA on March 10th and closed back above it on March 24th.

QQQ Leads Oversold Bounce

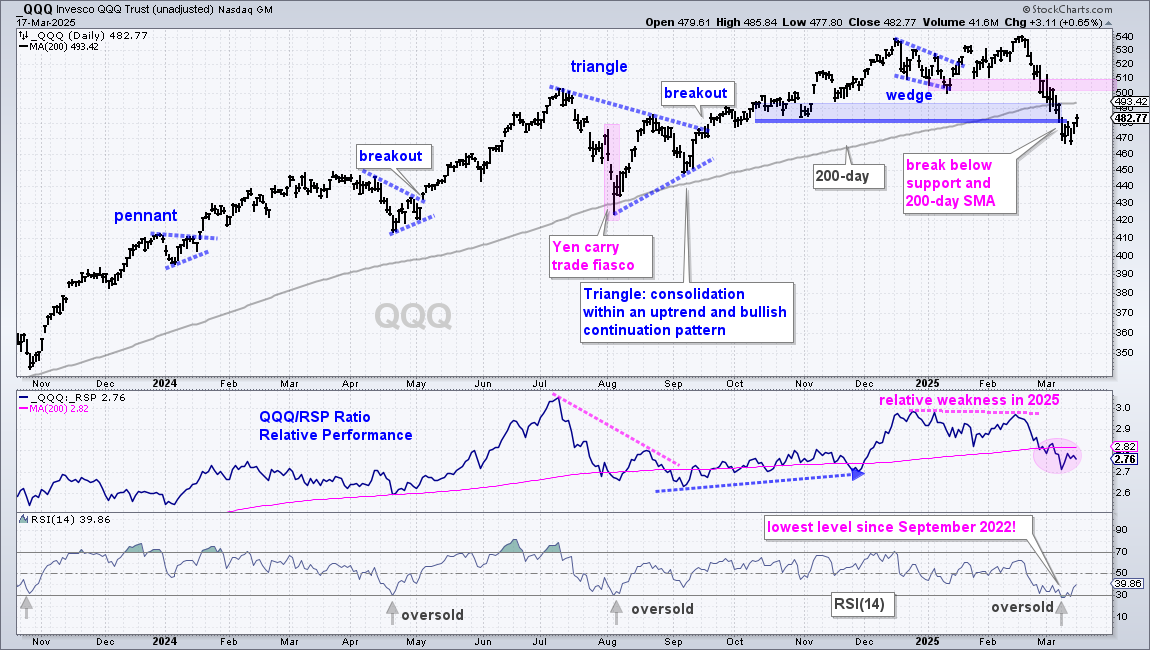
QQQ led on the way down and also on the oversold bounce. This is often the case. Names hit the hardest during a decline experience bigger oversold bounces. QQQ fell some 14% from its late February high and then surged 5% from its mid March low. Note that QQQ broke the 200-day SMA and support zone during this decline. Thus, the longer-term damage was done. Short-term, QQQ reversed its slide with a breakout at 485 and I am marking the next resistance zone in the 500-510 area. This zone stems from prior supports, which turn into resistance. The 50-61.8% retracements are also in this area.

RSP Bounces off Bullish Setup Zone

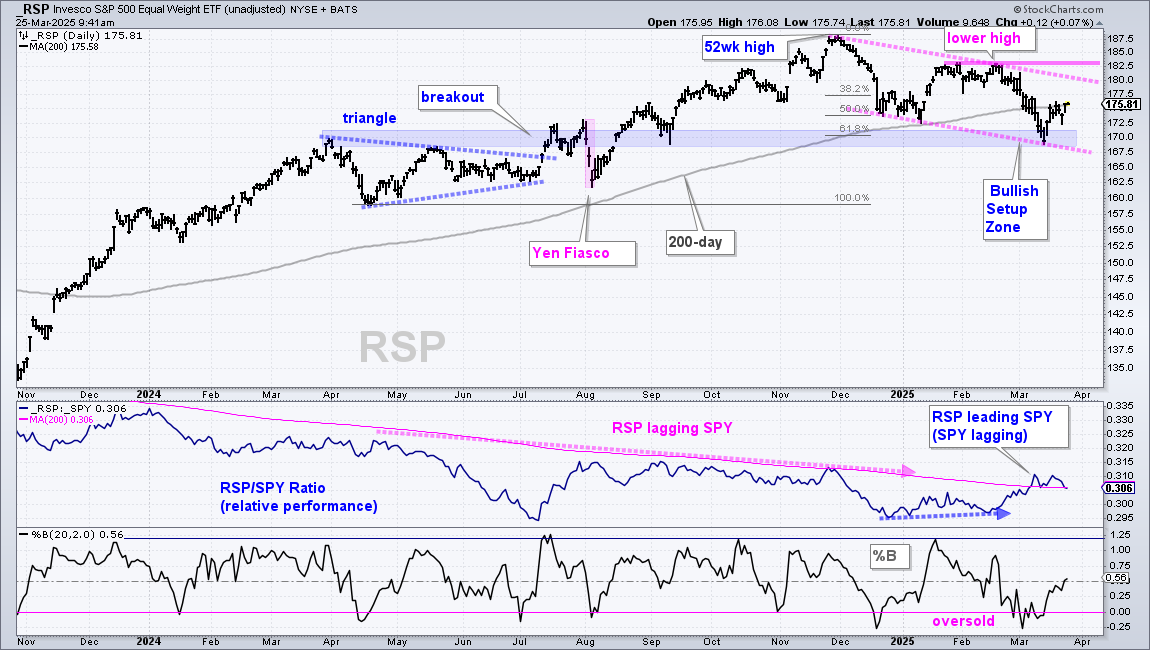
The S&P 500 EW ETF (RSP) hit the Bullish Setup Zone in mid March and got an oversold bounce with the rest of the market. Despite this bounce, the immediate trend is down with a lower high in February and a lower low in March (pink lines). A break above the February highs is needed to reverse this downtrend.

XLK Extends on Oversold Bounce

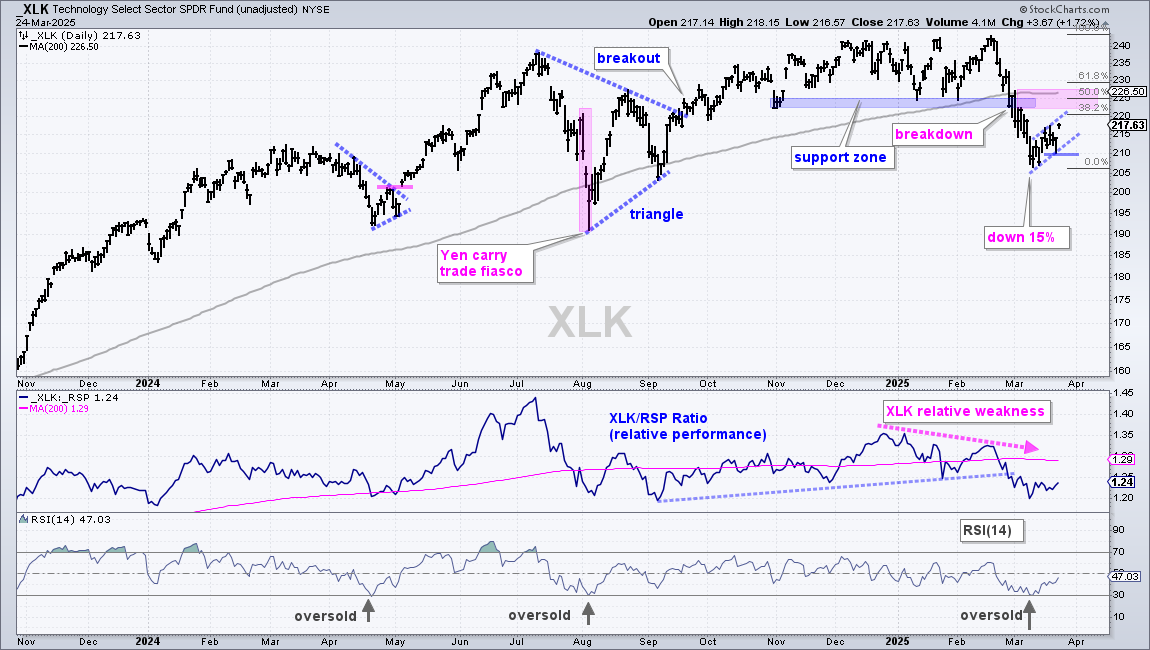
The Technology SPDR (XLK) shows a breakdown, oversold condition and bounce. This is a pretty common sequence on the charts right now. First, XLK broke support and the 200-day SMA with a 15% decline into mid March. This outsized decline reversed the long-term uptrend and XLK is now in a long-term downtrend. Second, XLK became short-term oversold with the 15% decline and was ripe for an oversold bounce. This is the double-edged sword of technical analysis: the long-term breakdown created a short-term oversold condition for a bounce. Third, XLK is getting that bounce with a 5% advance off the mid March low. Perhaps a bear flag is taking shape here with support at 210. A break here would reverse the upswing. For next resistance, we have broken support turning resistance and the 50% retracement in the 220 area (pink shading).

Top Performing ETFs in 2025

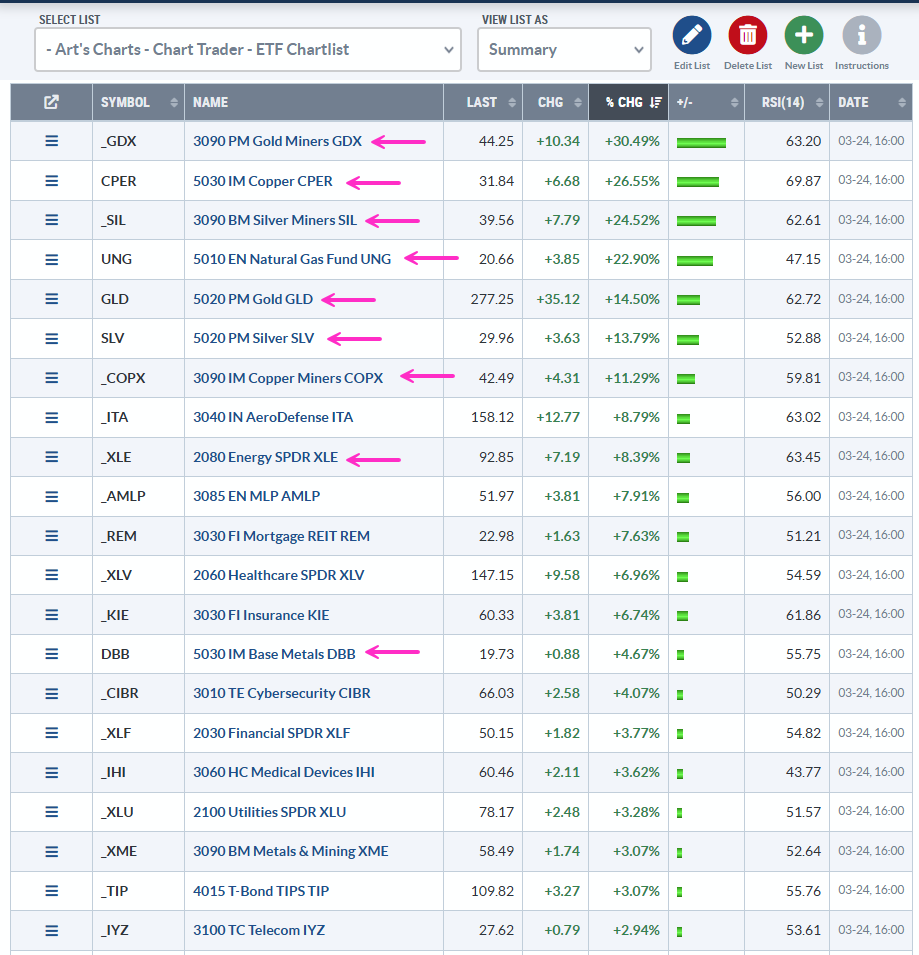
The table below shows some of the top performing ETFs year-to-date. Three themes are present. First, commodity-related ETFs are performing well. Gold Miners (GDX), Copper (CPER), Silver Miners (SIL), Gold (GLD), Silver (SLV) and Copper Miners (COPX) are in the top ten (pink arrows). Second, the leading equity ETFs are defensive and reflect risk-aversion in the stock market. These include Aerospace-Defense (ITA), MLPs (AMLP), Healthcare (XLV), Insurance (KIE), Medical Devices (IHI), Utilities (XLU) and Telecom (IYZ). Third, there is only one tech-related ETF: the Cybersecurity ETF (CIBR).

2025 leaders show a preference for hard assets and defensive stocks (risk off). This is also reflected in the Market Regime charts because the weight of the evidence is bearish for stocks. The ETFs featured below fit with the defensive theme in the market.

XLV Maintains 2025 Upswing

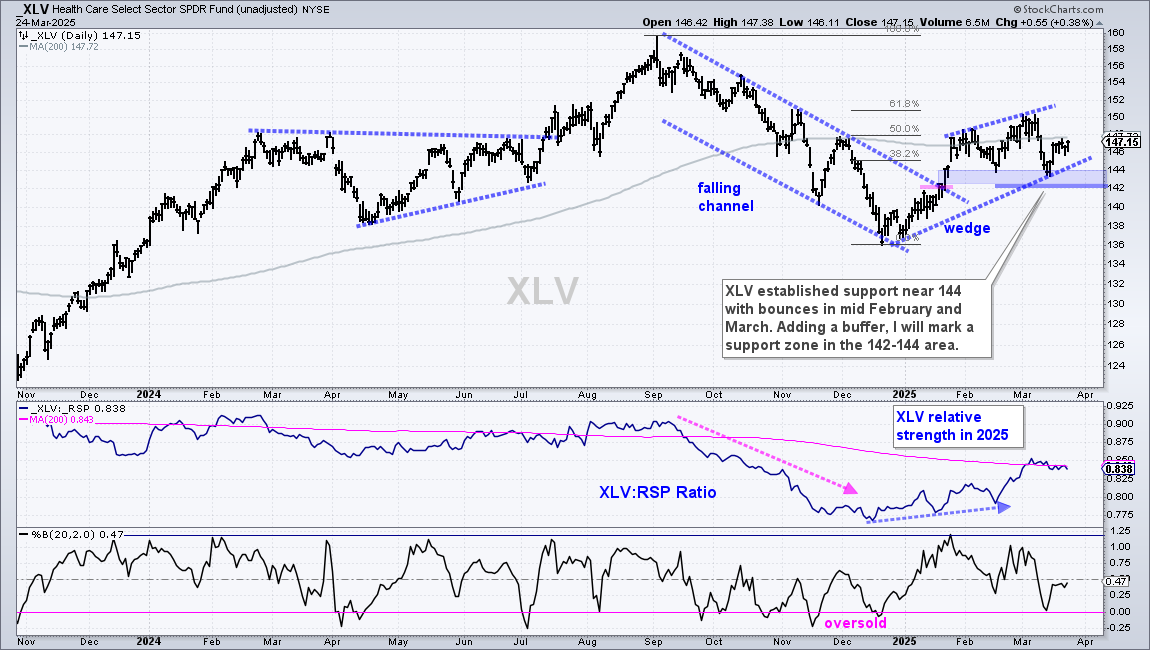
The Healthcare SPDR (XLV) is now the second strongest sector year-to-date (+6.96%) because the Energy SPDR (XLE) takes top honors (+8.39%). On the price chart, XLV broke out of a falling channel with a surge in mid January and the breakout zone is holding (blue shading). A rising wedge is taking shape this year and the trend is up as long as this wedge rises. The February-March lows mark a support zone in the 142-144 area. A close below 142 would reverse the uptrend.

XLF and XLC Hold Above Rising 200-day SMAs

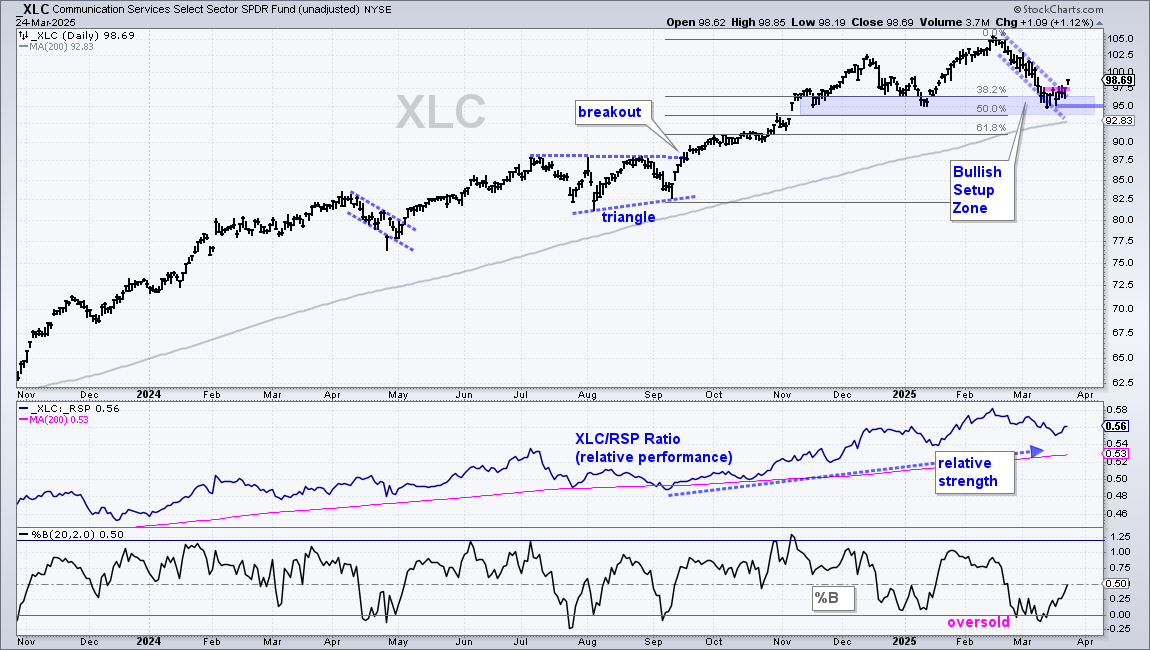
The Finance SPDR (XLF) and the Communication Services SPDR (XLC) held up better than the broader market because they did not break their 200-day SMAs. They are also in leading uptrends with new highs in February. The first chart shows XLC hitting a new high and falling back to the January lows. This decline also retraced around 50% of the September-February advance. Thus, we have a Bullish Setup Zone in the 95 area (blue shading). XLC firmed in this area and broke short-term resistance with a pop on Monday. Re-evaluation support is set at 95.   

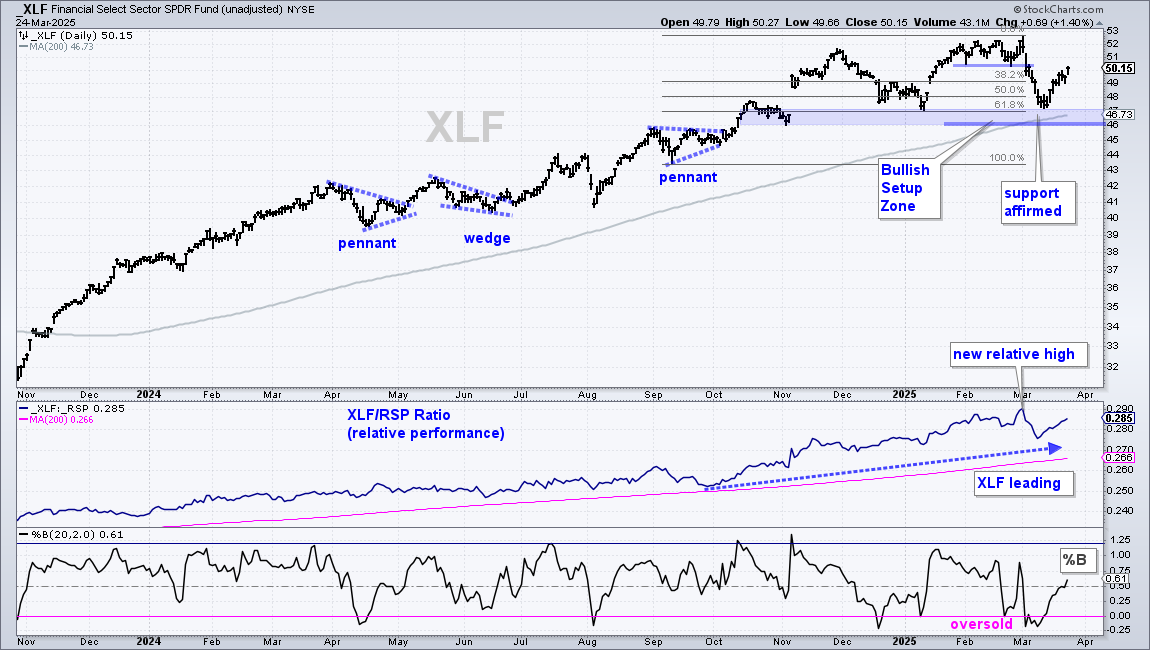
The next chart shows the Finance SPDR (XLF) tagging a new high in early March and then falling sharply into mid March. The ETF ultimately firmed at the January low and held above its rising 200-day SMA. Also note the 61.8% retracement at 47. Overall, XLF hit a Bullish Setup Zone and became oversold in early-mid March as %B dipped below zero. The bounce over the last seven days reinforces support in the 46-47 area (blue shading) and keeps the long-term uptrend alive. XLF is also leading as the price-relative (XLF/RSP ratio) hit a new high at the beginning of March and remains in an uptrend.

AIQ Reverses Near Bullish Setup Zone   

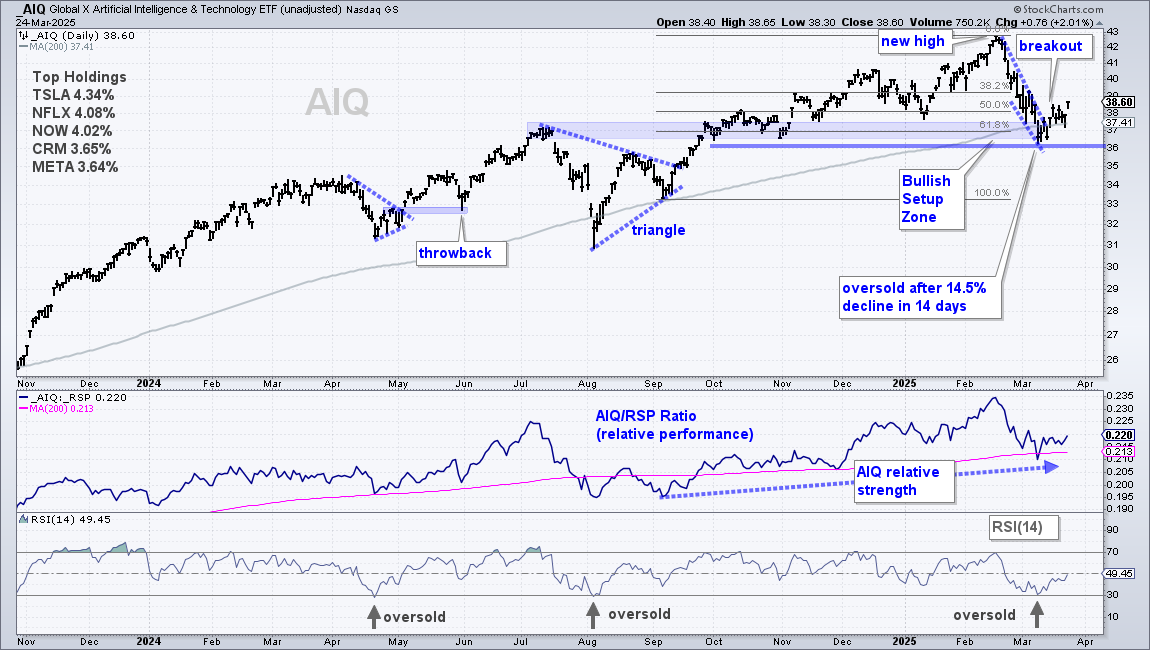
The Global AI & Tech ETF (AIQ) stood out because it held up better than the Technology SPDR this year. AIQ is flat year-to-date, while XLK is down 6.4% in 2025. Also note that AIQ a hit Bullish Setup Zone in mid March (blue shading). Broken resistance, the 200-day SMA and the 61.8% retracement mark this zone. AIQ also became oversold as RSI(14) hit the 30 area. The combination of oversold conditions and a Bullish Setup Zone gave way to an oversold bounce as AIQ broke out of a steep falling wedge. AIQ also reclaimed its rising 200-day SMA. I will mark re-evaluation support at 36.

CIBR Reverses Short-term Slide with Breakout  

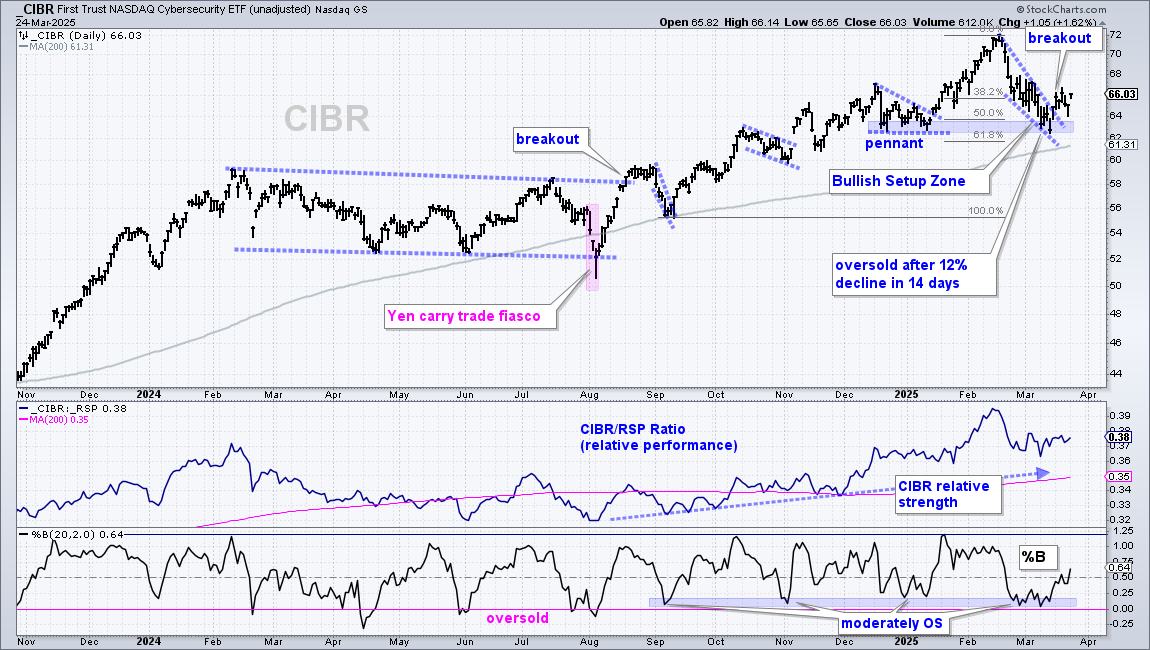
The Cybersecurity ETF (CIBR) is the strongest of the tech-related ETFs in my universe because it is the only one that held above the 200-day SMA and it sports a year-to-date gain (+4%). After hitting a new high, CIBR fell back to the January lows with a steep falling wedge. I view this as a correction within a bigger uptrend because CIBR held above the rising 200-day SMA. The ETF fell to the Bullish Setup Zone (blue shading) and reversed the short-term slide with a breakout last week. The middle window shows the price-relative (CIBR/RSP) in a long-term uptrend, which means CIBR shows relative strength.

KIE Works its Way Higher After Breakout

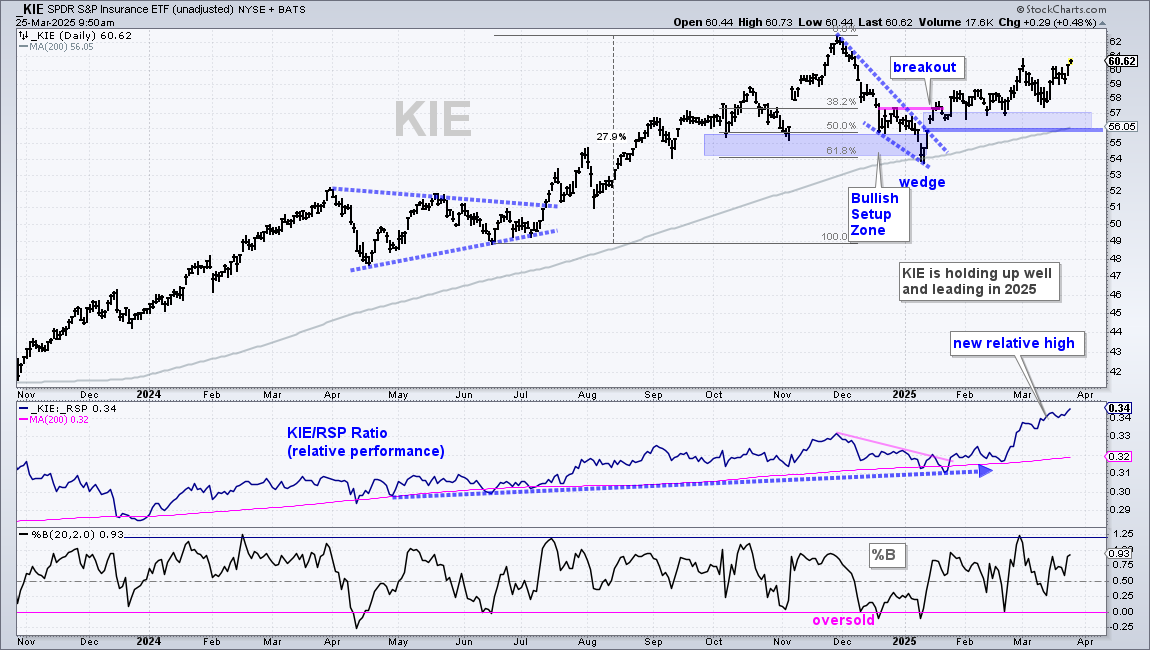
The Insurance ETF (KIE) is not the most exciting, but the ETF is in a leading uptrend as it continues to work its way higher since the mid January breakout. Keep in mind that many ETFs failed to hold their mid January breakouts. KIE held its breakout in February and showed relative strength when the broader market fell. Since this breakout, the ETF worked its way higher into March and the price-relative (KIE/RSP ratio) hit a new high. The February lows and rising 200-day SMA mark a support zone in the 56-57 area.

ITA Breaks Out

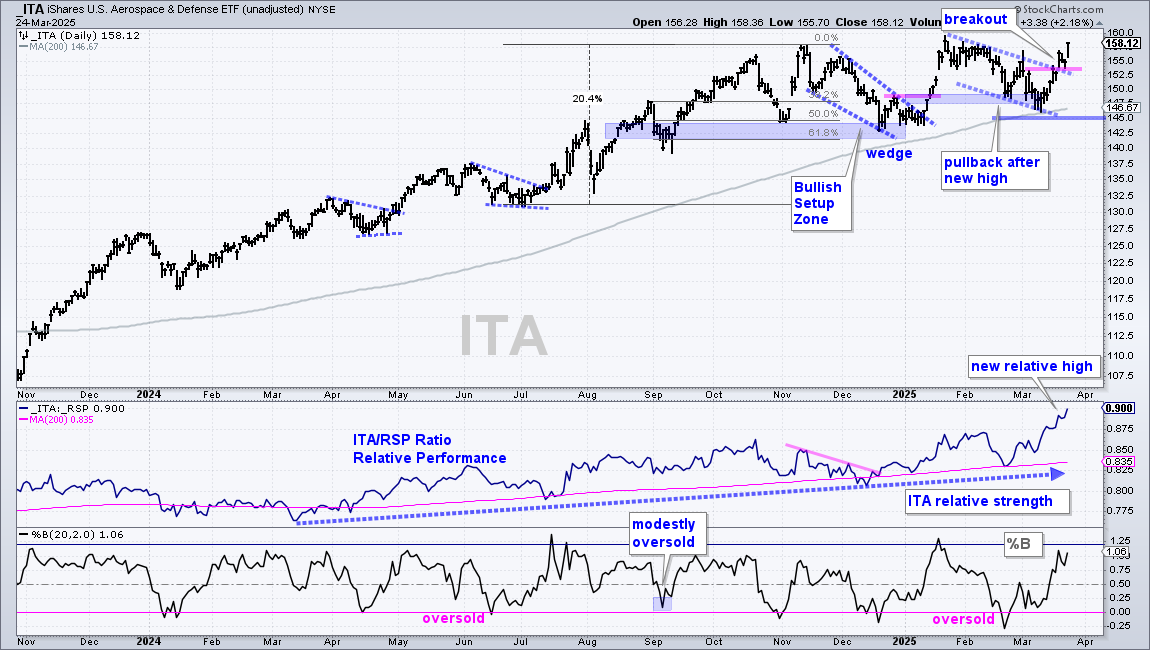
The Aerospace & Defense ETF (ITA) extended on last week’s breakout with a 2% surge on Monday and the ETF is close to another new high. ITA was already a leader with a new high in January and the price-relative hitting a new high this month. The decline into March was viewed as a pullback within the bigger uptrend. ITA broke out with a surge last week and this signals a continuation of the bigger uptrend. Re-evaluation support is set at 145.   

IBB Remains within Wedge Pullback

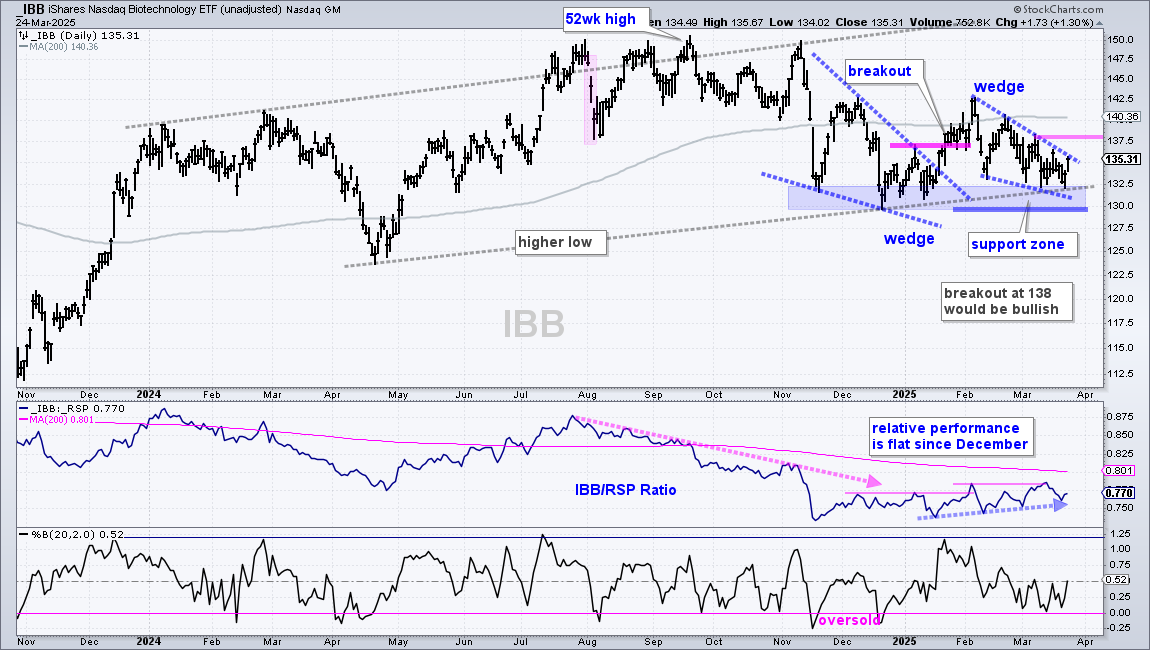
There is no change in the Biotech ETF (IBB) and it remains on my radar. Even though IBB is trading below its 200-day SMA, I can make the case for a long-term uptrend with a higher low from April to December and higher high from February to September (gray dashed lines). IBB fell in late 2024 with a falling wedge and broke out with a surge in mid January (breakout). With a pullback into March, a second wedge formed as IBB tested the support zone in the 130-132.5 area (blue shading). A breakout at 138 would be bullish and argue for a continuation of the choppy uptrend (gray dashed lines). A close below 130 would break the support zone and reverse this choppy uptrend. The middle window shows the price-relative (IBB/RSP ratio) edging higher this year as IBB slightly outperforms RSP. This is a start and a break above the 200-day SMA would show relative strength.

IHI Bounces Off Rising 200-day SMA

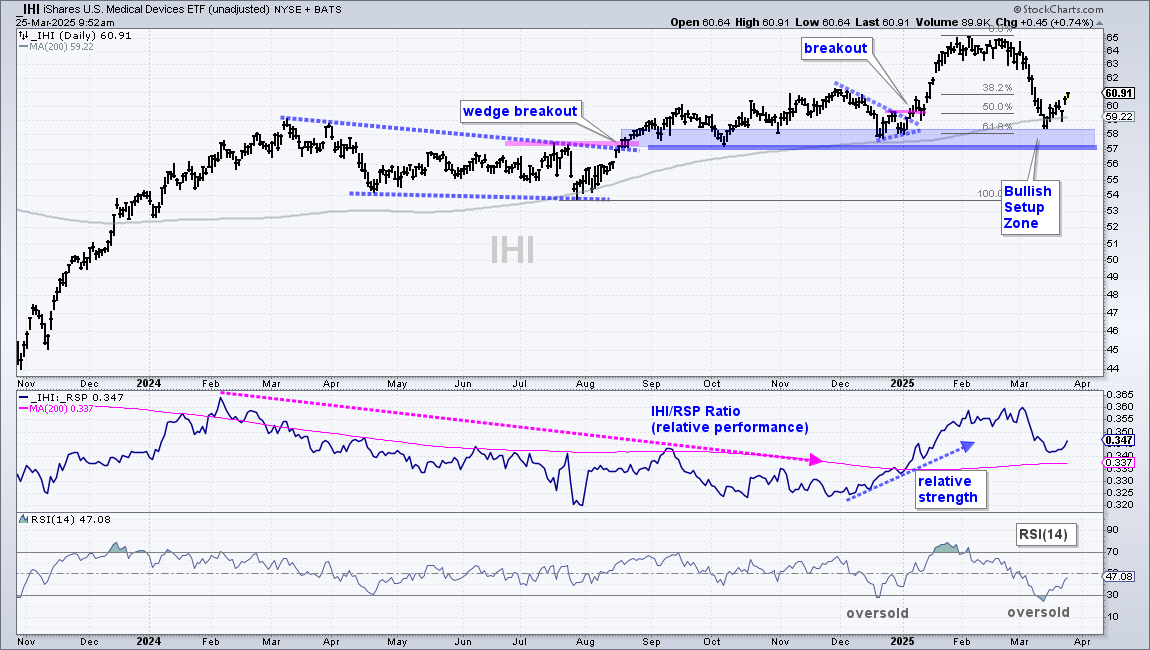
The Medical Devices ETF (IHI) remains in a long-term uptrend as IHI tagged a new high in February and fell to the rising 200-day SMA in mid March. The blue shading also marks a Bullish Setup Zone in the 57-58 area. Here we have the 61.8% retracement, broken resistance and supports from the September-December lows. RSI became oversold with a dip below 30 in mid March. The combination of oversold conditions and the Bullish Setup Zone produced an oversold bounce that recaptured the rising 200-day SMA (gray line). This bounce reinforces support in the 58 area and I will mark key support at 57.

AMLP Breaks Out of Small Corrective Pattern

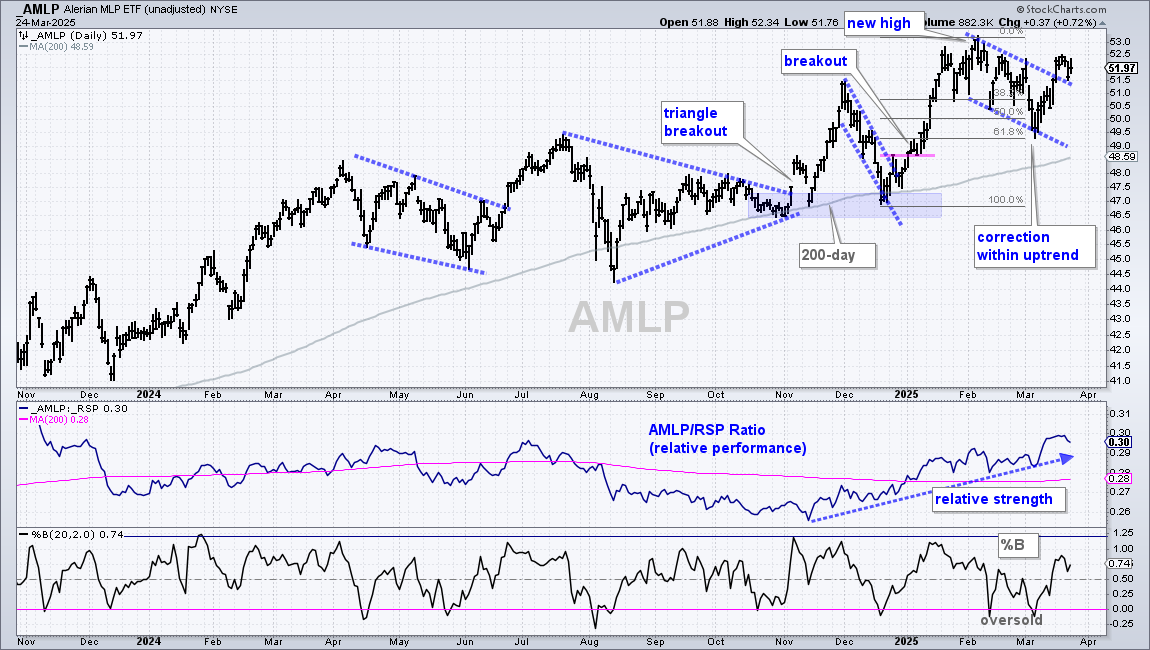
The MLP ETF (AMLP) remains in a leading uptrend with a channel breakout signaling an end to the short pullback. AMLP hit a new high in February, corrected into early March and broke out last week. Notice that this short correction reversed near the 61.8% retracement and when %B dipped below zero (oversold).  This channel is deemed a correction withing a bigger uptrend and the breakout signals a continuation higher.

IYZ Bounces off Support Zone

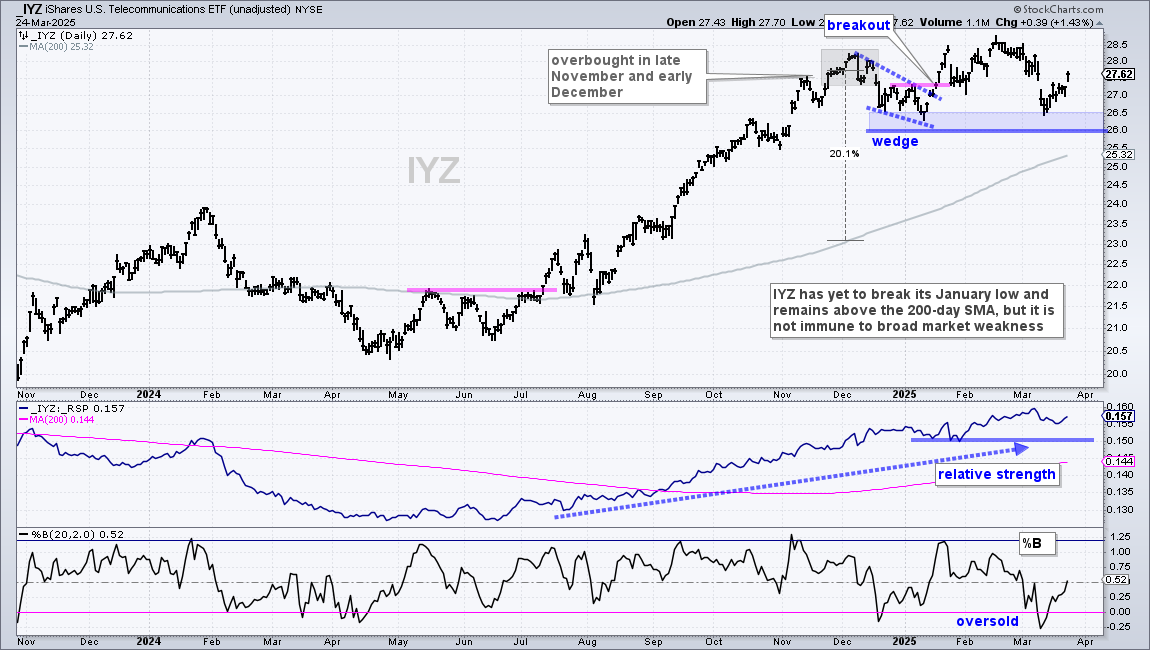
The Telecom ETF (IYZ) remains in a leading uptrend with a new high in February and a rising price-relative (IYZ/RSP ratio). Despite its leading uptrend, the ETF was hit hard in March as it fell to its January lows. These lows mark a support zone in the 26-26.5 area (blue shading). IYZ held support here with a bounce the last two days. This bounce reinforces the support zone and a close below 26 would reverse the long-term uptrend.

Send feedback to support(at)trendinvestorpro.com or use the contact form. 

Thanks for tuning in and have a great day!

Commodity, Bond & Bitcoin ETFs – Copper Hits New High – Miners Follow – TLT Breakout

Today’s report covers the commodity, bond and Bitcoin ETFs. Gold continues to lead the markets with strength transferring to the Gold Miners. The only concern is the overbought condition, which is fast approaching. Copper surged to a new high and Coppers Miners broke out. Bonds remain in an uptrend as TLT bids for a short-term breakout. Bitcoin bounces within downtrend.

Commodity, Bond & Bitcoin ETFs – Copper Hits New High – Miners Follow – TLT Breakout Read More »

Equity ETF Video – A Handful of Leaders – Finding ETFs with Relative Strength

Stocks are in the midst of an oversold bounce, but the weight of the evidence remains bearish for the stock market. This means the pickings are slim when it comes to equity ETFs. Today’s report focuses on equity ETFs that are still in long-term uptrends and showing relative strength. My short list is based on ETFs with year-to-date gains because they show absolute and relative strength this year. Note that SPY is down 4.3% year-to-date.

Equity ETF Video – A Handful of Leaders – Finding ETFs with Relative Strength Read More »
Market Regime – Weighing the Evidence using Trends, Breadth and Yield Spreads

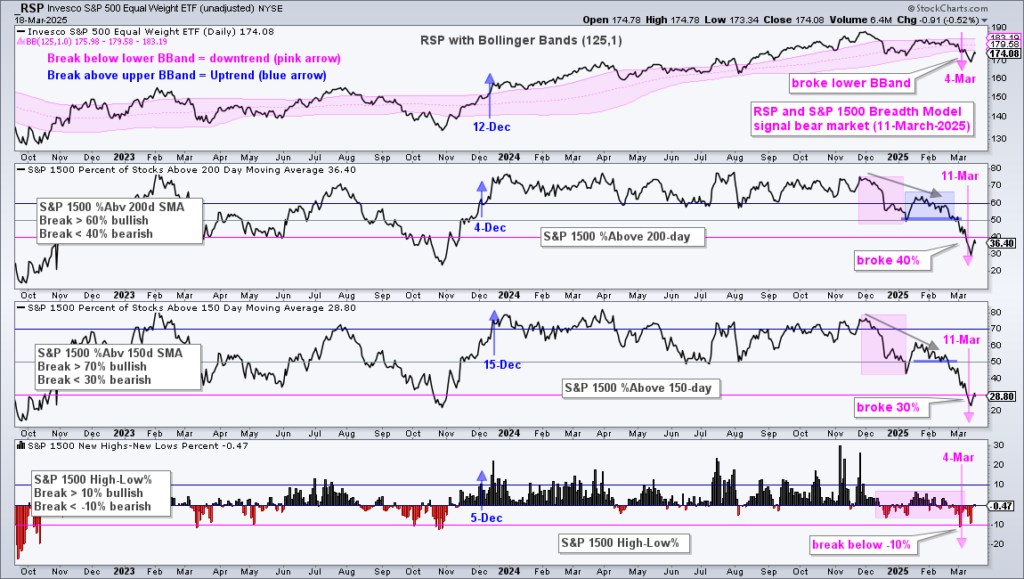
This market regime report weighs the evidence to determine the state of the stock market. Are we in a bull market or bear market? We start with the long-term trends for three major index ETFs (SPY,QQQ,RSP). Attention then turns to breadth indicators to measure the percentage of stocks in uptrends/downtrends and the percentage hitting new highs/lows. These indicators measure participation within the S&P 500, Nasdaq 100 and S&P 1500. Finally, we analyze yield spreads to see if the credit market show confidence or stress.

Market Regime – Weighing the Evidence using Trends, Breadth and Yield Spreads Read More »

Equity ETF Report – Bear Market Bounce – 11 with Leading Uptrends and Bullish Charts

Stocks are in the midst of an oversold bounce, but the weight of the evidence remains bearish for the stock market. This means the pickings are slim when it comes to equity ETFs. Today’s report focuses on equity ETFs that are still in long-term uptrends and showing relative strength. My short list is based on ETFs with year-to-date gains. SPY is down 3.23% this year. 23 of the 60 equity ETFs in

Equity ETF Report – Bear Market Bounce – 11 with Leading Uptrends and Bullish Charts Read More »

ETF Report – Metals Lead Higher – Copper Miners Firm – TLT Consolidates

Today’s report will cover the commodity, bond and Bitcoin ETFs that were featured in yesterday’s video. Precious metals are leading the commodity complex and this strength is transferring to the gold and silver miners ETFs. Industrial metals ETFs are not far behind with copper taking the lead here. Even so, copper miners remain subdued and have yet to break out. I am not covering

ETF Report – Metals Lead Higher – Copper Miners Firm – TLT Consolidates Read More »

Videos – Index, Sector & Industry Group ETFs – Commodity, Bond & Bitcoin ETFs

We have two videos on this page. First, there is a comprehensive video covering index, sector and industry group ETFs (equity ETFs). SPY and QQQ broke down, a couple sectors are holding up and a handful of industry group ETFs have yet to break their January lows. We then turn commodity ETFs, which are showing strength, as our bond ETFs. This vid conclude with the Bitcoin ETF (IBIT).

Videos – Index, Sector & Industry Group ETFs – Commodity, Bond & Bitcoin ETFs Read More »

ETF Report – SPY Breakdown – Selling Expands – Oversold ETFs – Eight Leaders

Stocks were broadsided the last three weeks with almost all equity ETFs losing ground. High-beta names are leading lower with the ARK ETFs (ARKK, ARKF, ARKG) down over 25%. Tech-related ETFs are right behind with declines ranging from 11.43% for Cybersecurity (CIBR) to 19.76% for Robotics AI (ARTY). Only four equity ETFs in my trading universe are showings

ETF Report – SPY Breakdown – Selling Expands – Oversold ETFs – Eight Leaders Read More »

Stock Report – Shaky Market – 3 Defense Stocks – Off-Price Retailer – Healthcare Leader

There are five new setups today and some updates to prior setups. We start with three stocks from the defense industry because the Aerospace & Defense ETF (ITA) is one of the leading industry group ETFs. I am also featuring a pharma stock (BMY) because the Healthcare SPDR (XLV) is showing relative strength here in 2025. And finally, we have an off-price retailer (TJX). Even though it is

Stock Report – Shaky Market – 3 Defense Stocks – Off-Price Retailer – Healthcare Leader Read More »

ETF Video – SPY/QQQ hit Moment of truth – A Clear Tech Leader – Healthcare Holds Strong

There are sizable and concerning pockets of weakness within the stock market, but SPY and QQQ are still in uptrends and testing key levels. The EW S&P 500 ETF, Technology SPDR and Industrials SPDR joined the breakdown list, along with small-caps (IJR) and mid-caps (MDY). One tech ETF stands out. We are also seeing long-term uptrends and relative strength in these eight ETFs (XLF, XLC, XLU, CIBR, IHI, AMLP, IYZ, GLD).

ETF Video – SPY/QQQ hit Moment of truth – A Clear Tech Leader – Healthcare Holds Strong Read More »

ETF Report –  Techs Lead Market Lower – CIBR and AIQ are Two of Eleven Leading ETFs

Stocks were hit hard the last two weeks with small-caps and tech stocks leading the way lower. SPY is down around 4.6% from its late February high and entering the garden-variety correction range (5-8 percent). Believe it or not, five to eight percent pullbacks are not that uncommon – but they feel a lot worse

ETF Report –  Techs Lead Market Lower – CIBR and AIQ are Two of Eleven Leading ETFs Read More »

Stock Report – Two NatGas Trades – A Leading Defense Play –  A Bullish Semiconductor

The weight of the evidence remains bullish for stocks, but this is not a bull market that lifts all boats. I am also seeing splits within sectors and industry groups. This is a selective bull market. Large-caps are holding up better in February and small-caps are lagging. The tech sector and Nasdaq 100 are also holding up relatively well, even with the swoon over the last five days.

Stock Report – Two NatGas Trades – A Leading Defense Play –  A Bullish Semiconductor Read More »

Market Regime Report/Video – SPX Breadth Holds – S&P 1500 Breadth Lags – 10yr Yield Breaks

Breadth weakened into January as the market corrected, but then rebounded into February with NDX breadth leading the way. S&P 1500 breadth remains the weakest of the three (blame small-caps and mid-caps). This week’s big shift is the breakout in the 7-10 Yr Treasury Bond ETF (IEF) and the break down in the 10-yr Treasury Yield. Lower rates may seem positive for stocks, but

Market Regime Report/Video – SPX Breadth Holds – S&P 1500 Breadth Lags – 10yr Yield Breaks Read More »

ETF Report – High Beta Names Hit – Risk-Off Names Rise – Lower Highs in Key Groups – GLD Strong

Stocks were hit hard the last three days with the high-beta names leading lower. Defensive groups (Healthcare, Staples, Utes) and bonds picked up the slack. Even though the weight of the evidence remains bullish for stocks, there are some sizable pockets of weakness with lower highs forming in key groups (banks, industrials, software, infrastructure), as well as fresh new lows in housing ETFs. Gold is holding strong, but Bitcoin is under pressure as part of the risk-on trade.

ETF Report – High Beta Names Hit – Risk-Off Names Rise – Lower Highs in Key Groups – GLD Strong Read More »

Stock Report – Two Cybersecurity Setups – Mag7 Stock Hits Bullish Setup Zone – 5 More

Today’s report features five new setups and three setups from the prior week. The Cybersecurity ETF (CIBR) is perhaps the strongest group in the market right now and we are covering two stocks from this group. We also have a data center REIT setting up as well as a Mag7 stock hitting a Bullish Setup Zone.

Stock Report – Two Cybersecurity Setups – Mag7 Stock Hits Bullish Setup Zone – 5 More Read More »

Market Regime Report/Video – NDX Breadth Leads – S&P 1500 Lags – 10y Yield Battles Breakout

The weight of the evidence continues to support a bull market in stocks. All three major index ETFs are in long-term uptrends and all nine breadth indicators are on bull signals (%Above 200-day SMA, %Above 150-day SMA, High-Low Percent). The breadth indicators weakened into January as the market corrected, but then rebounded into February with Nasdaq 100 breadth

Market Regime Report/Video – NDX Breadth Leads – S&P 1500 Lags – 10y Yield Battles Breakout Read More »

ETF Video – XLK New High – AI and Cybersecurity Lead – XLI & PAVE Turn Up – Bitcoin Gets Quiet

Don’t look now, but tech is back with XLK joining QQQ in the new high parade. We are also seeing new highs in ETFs related to Cybersecurity and AI, as well as breakout extensions in Software (IGV) and Cloud (SKYY). Semis continue to lag, but we will take a second look at the SMH chart with a longer timeframe. Elsewhere, ETFs related to industrials are turning back up, defense ETFs pulled back after new highs and the banking ETFs are holding their breakouts.

ETF Video – XLK New High – AI and Cybersecurity Lead – XLI & PAVE Turn Up – Bitcoin Gets Quiet Read More »

ETF Report – QQQ Leads – MAGS Sets Up – Aero/Defense Pulls Back – Industrials Attempts Breakout

The weight of the evidence remains bullish for stocks (bull market). Large-caps (SPY, QQQ) are leading equal-weights, mid-caps and small-caps (RSP, MDY, IWM). QQQ is leading SPY because the former recorded a fresh 52-wk high last week. Several tech-related ETFs are leading the market with bullish setups forming in MAGS and CLOU. I am also watching the flag breakout in Industrials SPDR and setups in four related ETFs (Aerospace & Defense and Infrastructure).

ETF Report – QQQ Leads – MAGS Sets Up – Aero/Defense Pulls Back – Industrials Attempts Breakout Read More »

Scroll to Top