
The next report will be on Wednesday, March 12th.
Report Headlines
- SPY/QQQ Get Oversold Bounces after Breakdowns
- RSP Bounces off Bullish Setup Zone
- XLK Gets Oversold Bounce after Breakdown
- XLV and a Support Level that was Too Tight
- ETFs Holding Up in 2025 and Since the Breakdown
- XLU Maintains Uptrend and Shows Relative Strength
- AIQ Bounces Off Bullish Setup Zone
- CIBR Reverses Off Bullish Setup Zone
- KIE Surges and Extends on Breakout
- ITA Bids to Reverse Pullback
- IBB Bounces within Wedge Pullback
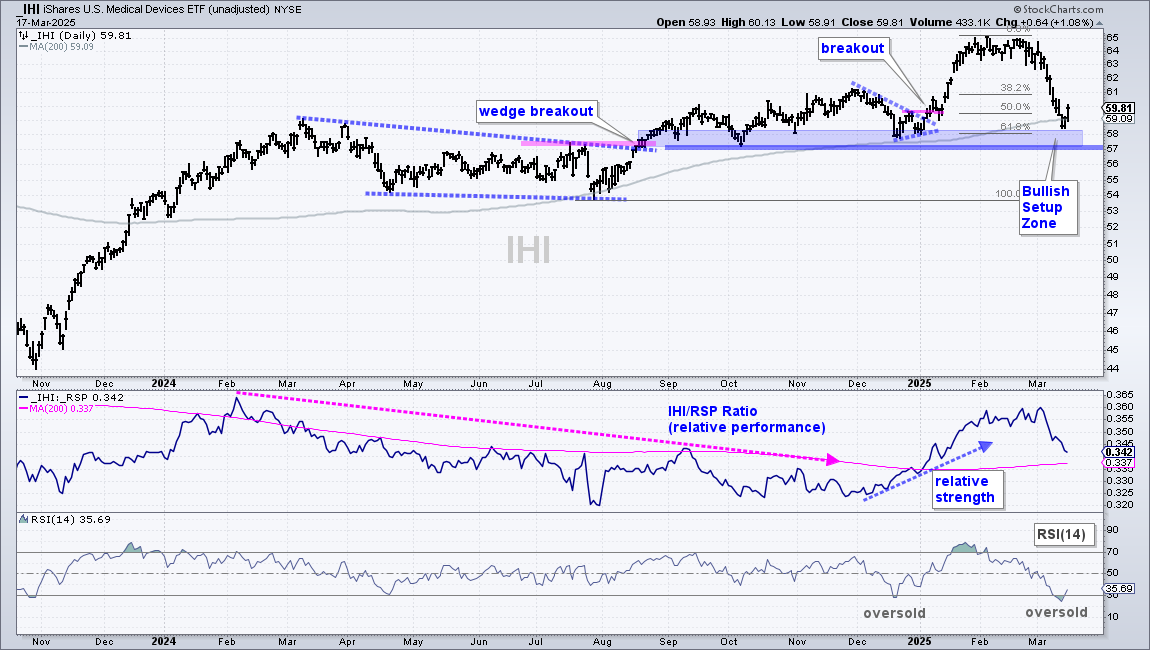
- IHI Bounces Off Rising 200-day SMA
- AMLP Breaks Out of Small Corrective Pattern
- IYZ Bounces off Support Zone
Stocks are in the midst of an oversold bounce, but the weight of the evidence remains bearish for the stock market. This means the pickings are slim when it comes to equity ETFs. Today’s report focuses on equity ETFs that are still in long-term uptrends and showing relative strength. My short list is based on ETFs with year-to-date gains. SPY is down 3.23% this year. 23 of the 60 equity ETFs in my focus list (38%) are up year-to-date and holding up better than the broader market. Today’s report features 11 equity ETFs.
The weight of the evidence is bearish for the stock market for three reasons:
First, SPY, QQQ and the S&P 500 EW ETF (RSP) broke support and their 200-day SMAs with sharp declines in March. These three also broke their lower Bollinger Bands (125,1) to reverse their uptrends. It is clearly negative to see long-term downtrends in these key index ETFs.
Second, the majority of stocks in the S&P 500, Nasdaq 100 and S&P 1500 are trading below their 200 and 150 day SMAs (long-term downtrends). This makes it difficult to pick winners among stocks and equity ETFs. Some stocks and groups will buck the bear, but risk remains above average for stocks.
Third, Junk and BBB yields spreads widened sharply and hit their highest levels since September. Stress levels are rising in the credit markets and this is negative for stocks.
The bull market clearly lost its footing with the March break down. This means the stock market is in correction mode at best – or on the cusp of a bear market at worst. Once a signal triggers, we do not know how long it will last or how far prices will extend. The signal will remain in place until it is proven otherwise with a counter signal. This is classic Dow Theory.
Short-term, stocks became quite oversold last week with several indicators hitting extremes. RSI dipped below 30 for SPY, QQQ and RSP. The Total Put/Call Ratio ($CPC) surged above 1, which means put volume exceeded call volume (extreme fear). The Zweig Breadth Thrust for S&P 500 AD Percent ($SPXADP) dipped below -20% to become oversold. These oversold conditions led to a bounce the last two days. With the weight of the evidence bearish, I would consider this a bear market bounce.
I will post a report on the Zweig Breadth Thrust later today.
SPY Gets Oversold Bounce after Breakdown
SPY is in a long-term downtrend and shows relative weakness. SPY broke long-term support and the 200-day SMA with a sharp decline into early March. Though not shown, SPY also broke the lower Bollinger Band (125,1) to reverse its long-term uptrend. Thus, SPY is in a long-term downtrend. The middle window shows the SPY/RSP ratio breaking down as large-caps underperform the S&P 500 EW ETF (RSP). Short-term, the ETF became oversold as RSI dipped below 30 last week and bounced over the last two days. At this point, I consider this an oversold bounce after a breakdown, and would mark first resistance in the 580-590 area (pink shading).
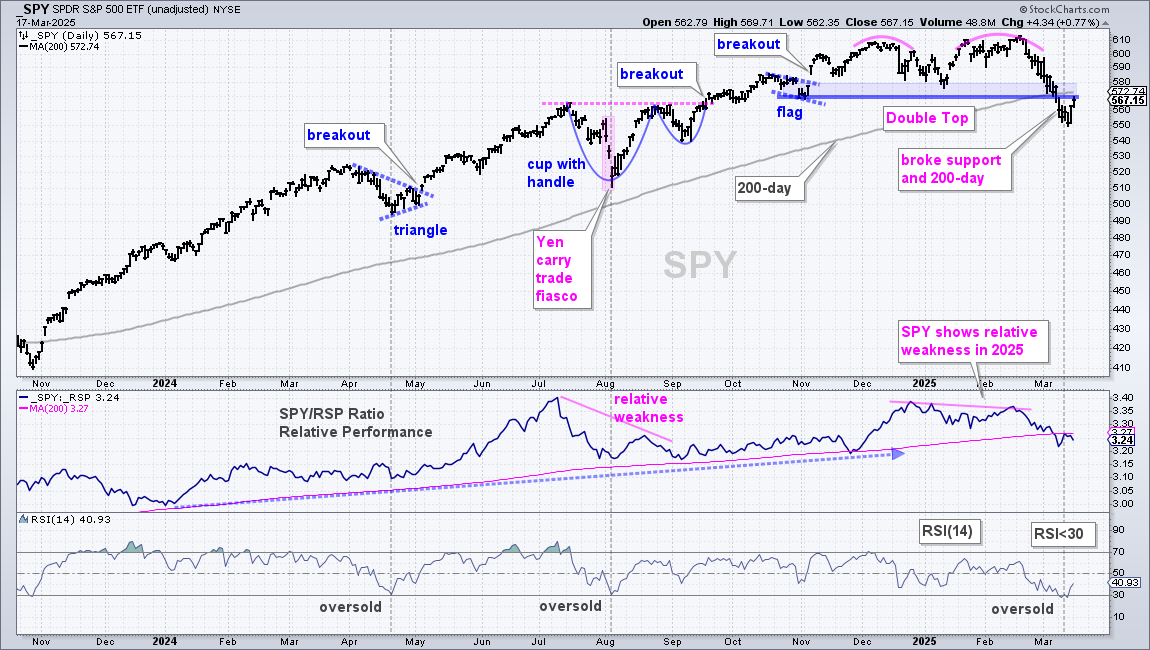
The 200-day SMA is often a battle zone with downside breaks occurring during periods with higher volatility. This means we could see more than one cross in the coming days/weeks. For example, SPY broke its 200-day on 21-January-2022 and then crossed this key moving average at least six more times from late January to mid April 2022. SPY broke its 200-day SMA on March 10th and the two day bounce is fast approaching the underside of the 200-day SMA.
QQQ Gets Oversold Bounce after Breakdown
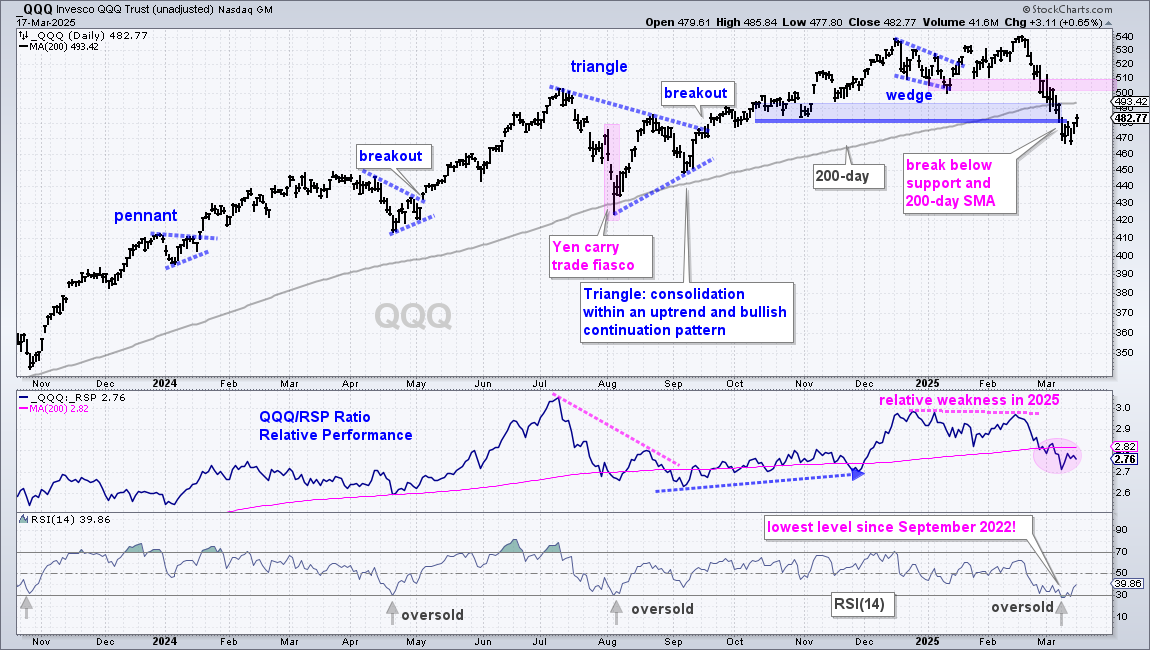
QQQ also broke the 200-day SMA, support zone and lower Bollinger Band (125,1) with a sharp decline into March. The Bollinger Bands are not shown on the chart. This is the straw that broke the bulls back and reversed the long-term uptrend. Short-term, QQQ became oversold last week as RSI dipped below 30 for the first time since late 2023. This oversold condition is giving way to a bounce that could extend to the 500-510 area. Here we have broken supports turning into resistance (pink shading).
RSP Bounces off Bullish Setup Zone
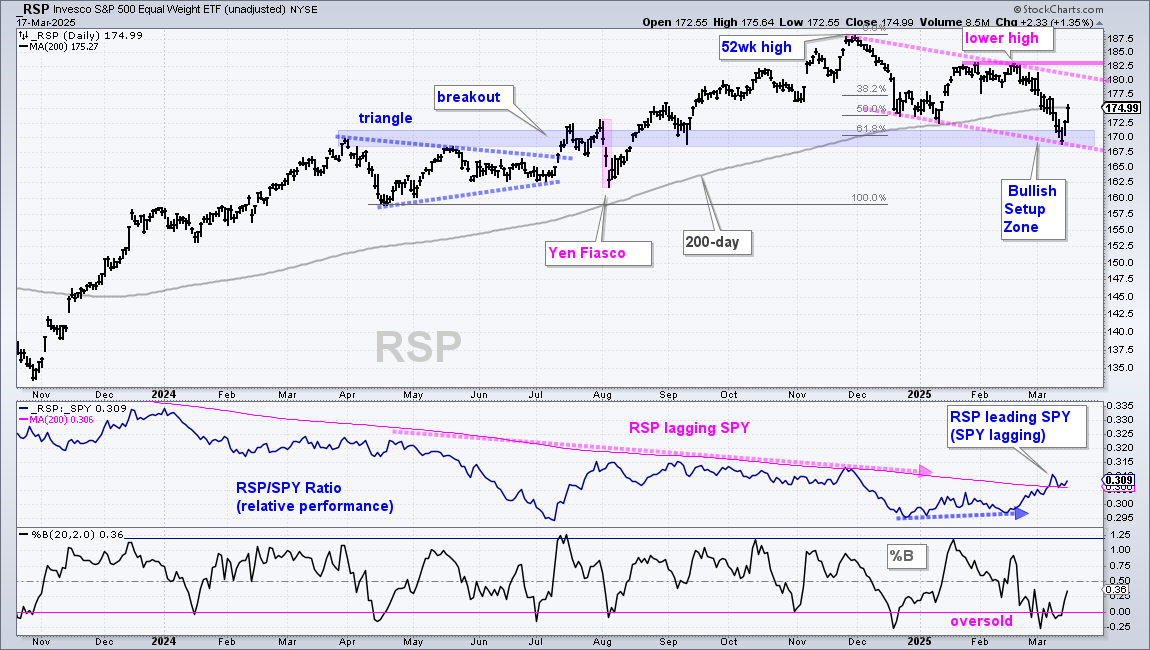
The S&P 500 EW ETF (RSP) is holding up better than SPY and QQQ for two reasons. First, it is back at its 200-day SMA already. Second, the price-relative (RSP/SPY ratio) is rising in 2025 and above its 200-day SMA. I could argue that the falling channel since December is a correction after the April-November advance, but the breadth models are bearish and RSP broke the lower Bollinger Band (125,1) to reverse its uptrend (not shown). Thus, I think this is a downtrend until proven otherwise. Falling channel resistance is marked at 183 and a breakout is needed to reverse the downtrend. Short-term, RSP hit the Bullish Setup Zone last week and bounced the last two days. With the weight of the evidence bearish, this is considered a bear market bounce and we could see resistance in the 177.5-180 area.
XLK Gets Oversold Bounce after Breakdown
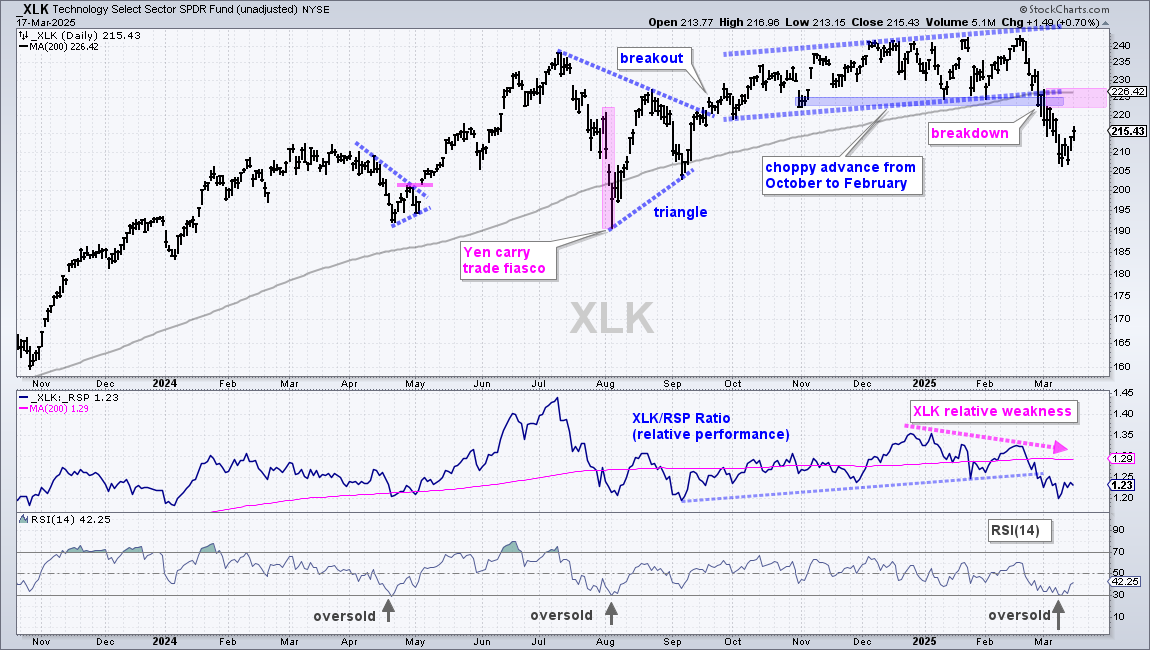
The Technology SPDR (XLK) broke the rising channel line, 200-day SMA and January low with a decline into March. This decline reverses and uptrend that was in place since the mid September breakout. XLK also shows relative weakness as the XLK/RSP ratio formed a lower high in February and broke its January low. Short-term, XLK became oversold as RSI(14) fell to 30 last week (gray arrow). This oversold condition gave way to a bounce the last two days, but I consider this a bounce within a bigger downtrend. Broken support turns first resistance so this bounce could fail in the 225 area (pink shading).
ETFs Holding Up in 2025 and Since the Breakdown
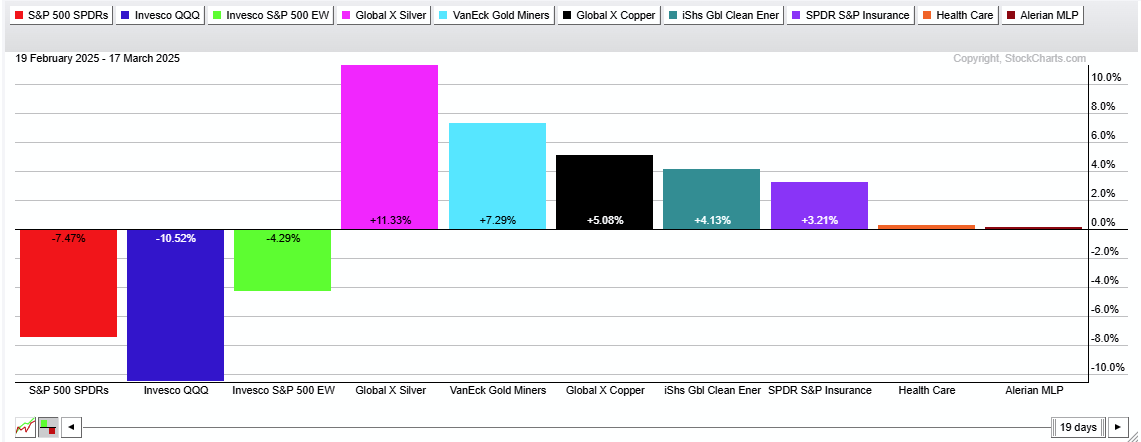
SPY is down 3.23% year-to-date and down 7.5% from its February high. ETFs with smaller losses show relative strength. ETFs with gains show absolute strength and relative strength. The next two lists show ETFs with year-to-date gains, ETFs with gains since February 19th. Overall, we are seeing strength in commodity-related names and defensive groups.
Stock ETFs with gains year-to-date: GDX, SIL, COPX, REM, AMLP, XLV, XLE, KIE, ITA, XLU, ICLN, CIBR, XLB, IYR, IBB, XLP, IHI, XME, IYZ, XLF, TAN, XLI, XLC
Stock ETFs with gains since February 19th: SIL, GDX, COPX, ICLN, KIE, XLV, AMLP
XLV and a Support Level that was Too Tight
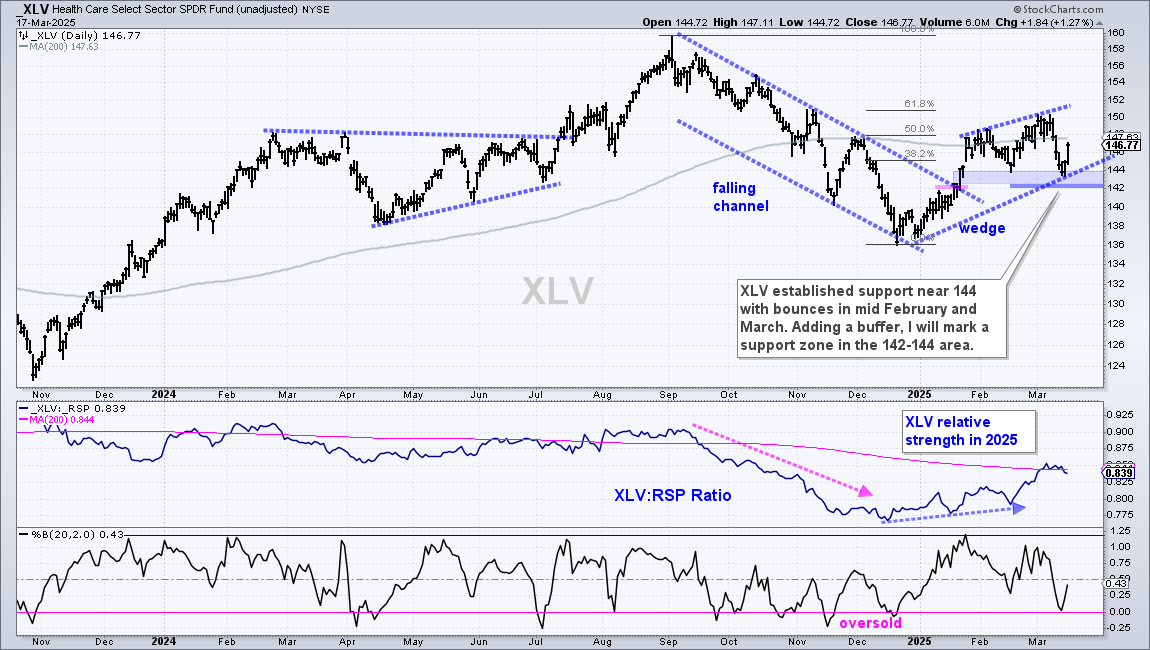
Marking support levels with ETFs is a challenge because there are dozens of moving parts (component stocks). Each stock has its own support/resistance level, and these levels may not jibe with the ETF. I marked rising wedge support at 144 for XLV last week and the ETF closed below this level on Thursday (143.83). This break did not last long as the ETF immediately rebounded with a 2% gain in two days. A bearish rising wedge is still possible here, but the bulls are in charge this year. XLV is still the strongest sector year-to-date (+6.69%) and is up a fraction (+.25%) since SPY peaked (19-Feb). SPY, for reference is down 7.5% since February 19th. This year’s trend is up as long as the wedge rises. With two bounces and a buffer, I will mark the re-evaluation level at 142.
XLU Maintains Uptrend and Shows Relative Strength
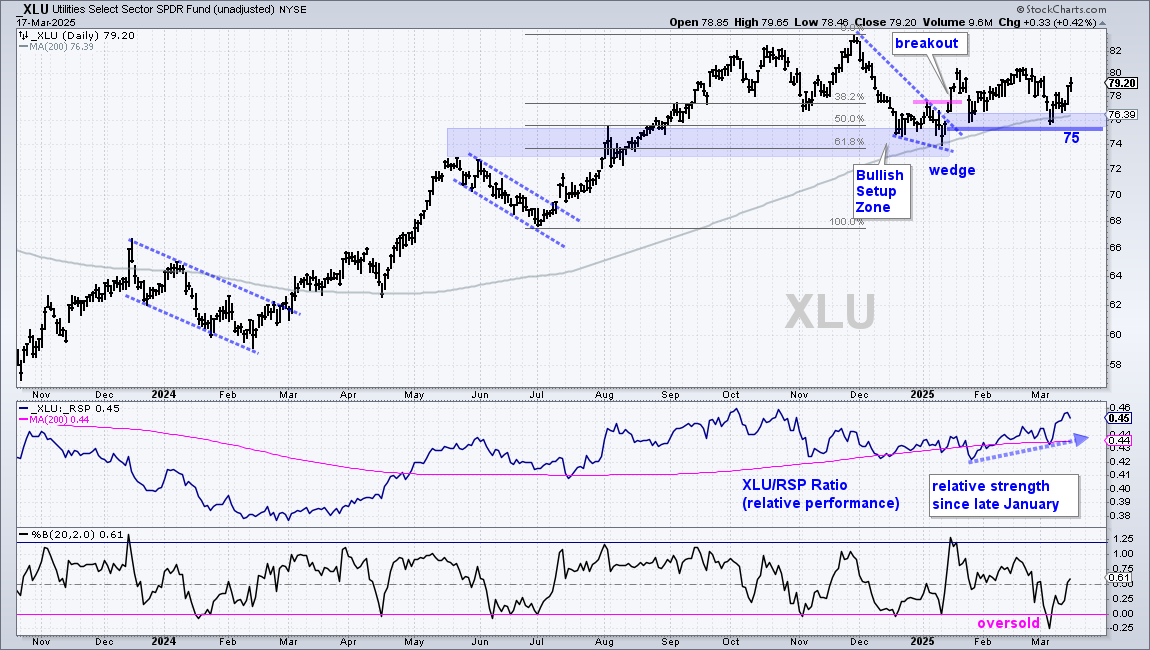
The Utilities SPDR (XLU) is holding up better than the broader market and even holding its wedge breakout. Even though XLU has yet to extend on this breakout, the signal remains and the ETF shows relative strength. XLU bounced twice in the 76 area (blue shading) and remains above the rising 200-day SMA. I see a support zone in the 75-77 area and will mark support at 75. The middle window shows the price-relative turning up in February and moving higher into March as XLU shows relative strength.
AIQ Bounces Off Bullish Setup Zone
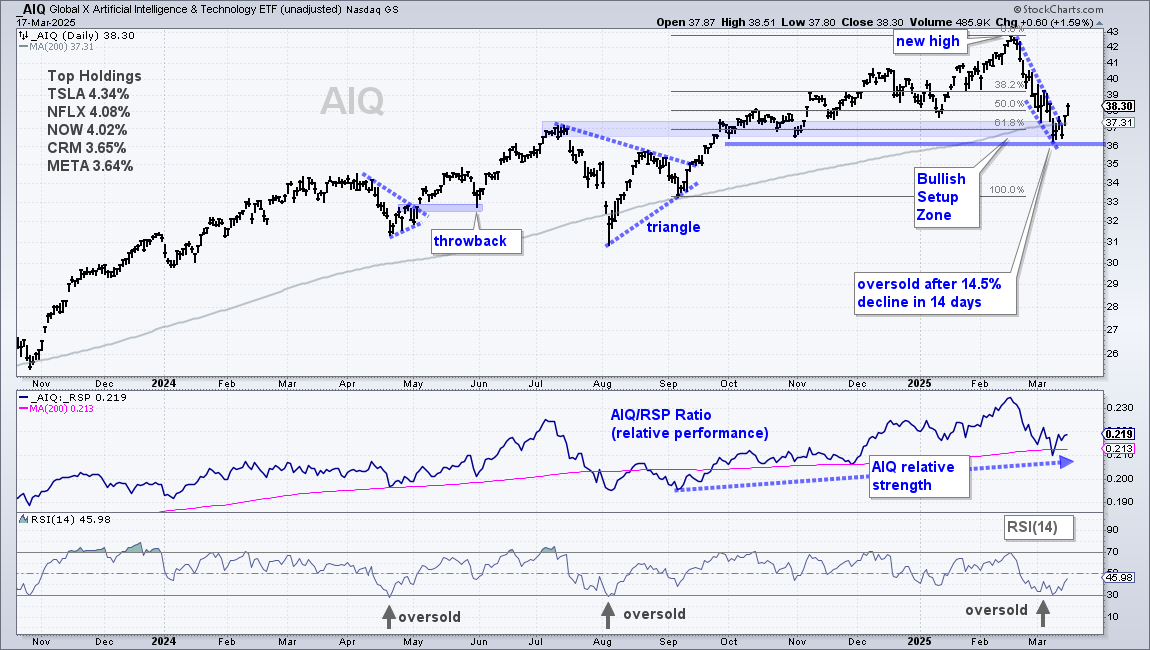
There is not much to like within the Technology sector, but the Global AI & Tech ETF (AIQ) stood out because it fell to a Bullish Setup Zone (blue shading) and became oversold. Broken resistance, the 200-day SMA and the 61.8% retracement mark this zone. Bullish Setup Zones are areas to watch for firming and short-term reversal. AIQ also became oversold as RSI(14) hit the 30 area. The combination of oversold conditions and a Bullish Setup Zone gave way to an oversold bounce the last two days. AIQ broke out of a steep falling wedge to reverse the short-term downswing. I will mark key support at 36.
CIBR Reverses Off Bullish Setup Zone
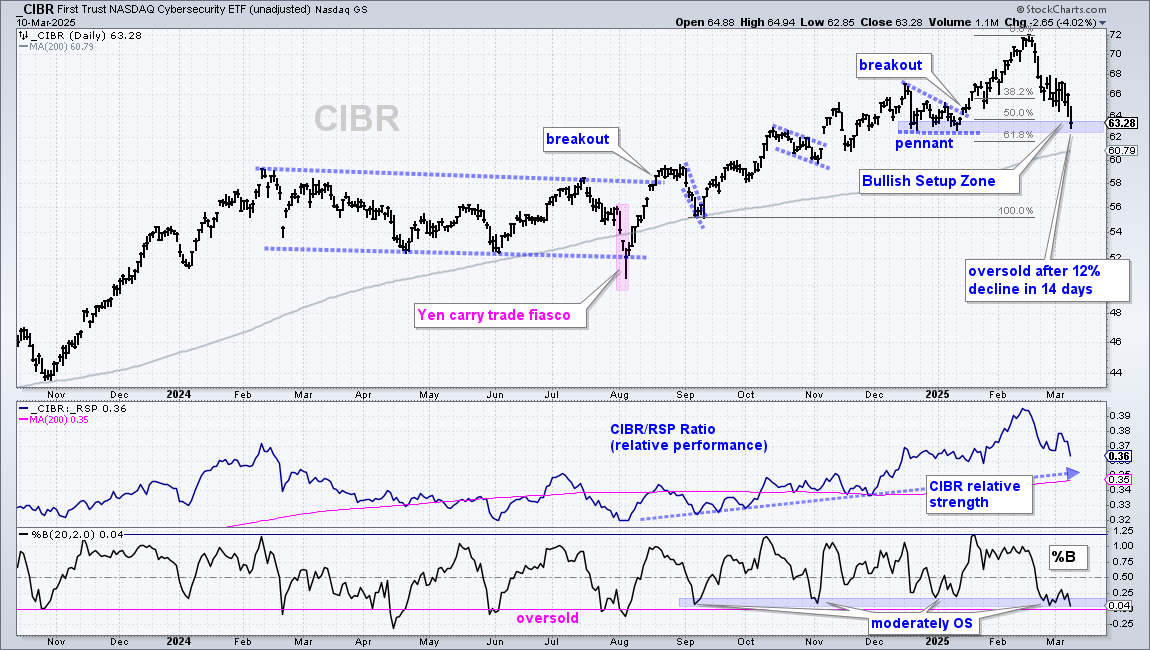
The Cybersecurity ETF (CIBR) is the strongest of the tech-related ETFs in my universe because it is the only one that did not break the 200-day SMA and it sports a year-to-date gain (+3.7%). Last week I noted that CIBR was trading in a Bullish Setup Zone marked by the December-January lows (support) and the 50-61.8 percent retracement zone. CIBR was also moderately oversold with Percent-B (20,2) just above zero. This means the close was just above the lower Bollinger Band (20,2). A falling wedge formed on the price chart and CIBR reversed this short-term slide with a breakout the last two days. The middle window shows the price-relative rising since August and trading well above its rising 200-day SMA (relative strength).
KIE Surges and Extends on Breakout
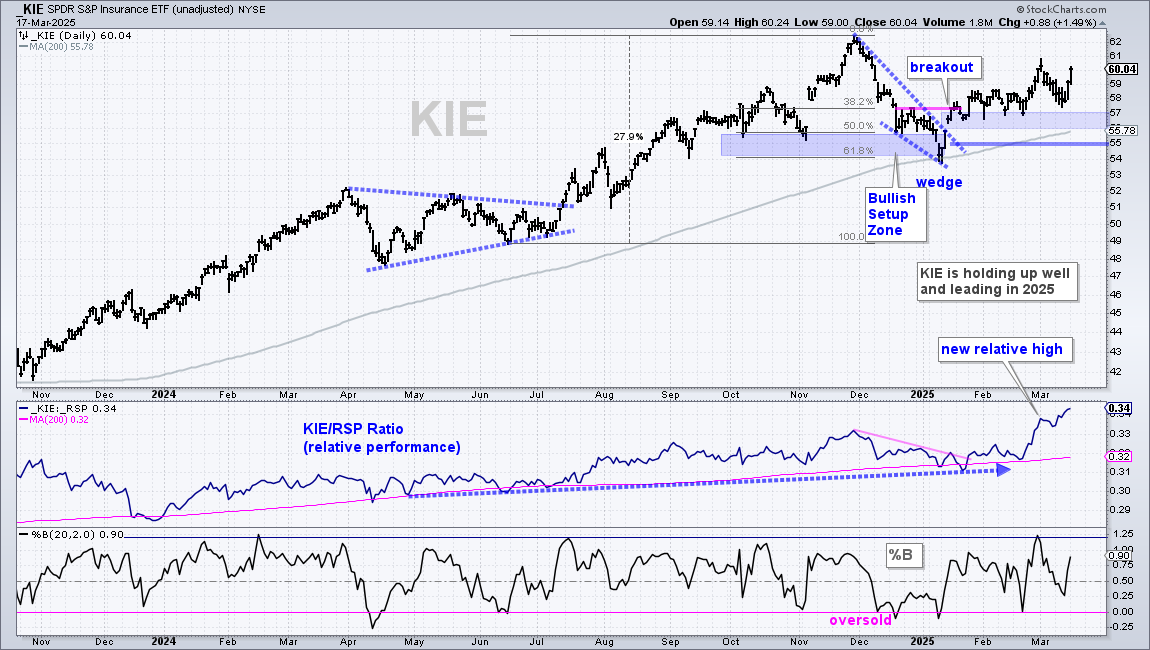
The Insurance ETF (KIE) remains with a wedge breakout in mid January and upswing since this breakout. The breakout zone in the 56-57 area turned into support and held throughout February. SPY peaked on February 19th, but KIE held strong and is one of a handful of ETFs showing gains since the market peaked. Thus, the ETF shows absolute and relative strength. KIE is also leading the rebound over the last two days with a 3.89% bounce. The breakout zone and 200-day SMA mark support areas to watch. Adding a buffer, I will set key support at 55 and re-evaluate on a close below this level.
ITA Bids to Reverse Pullback
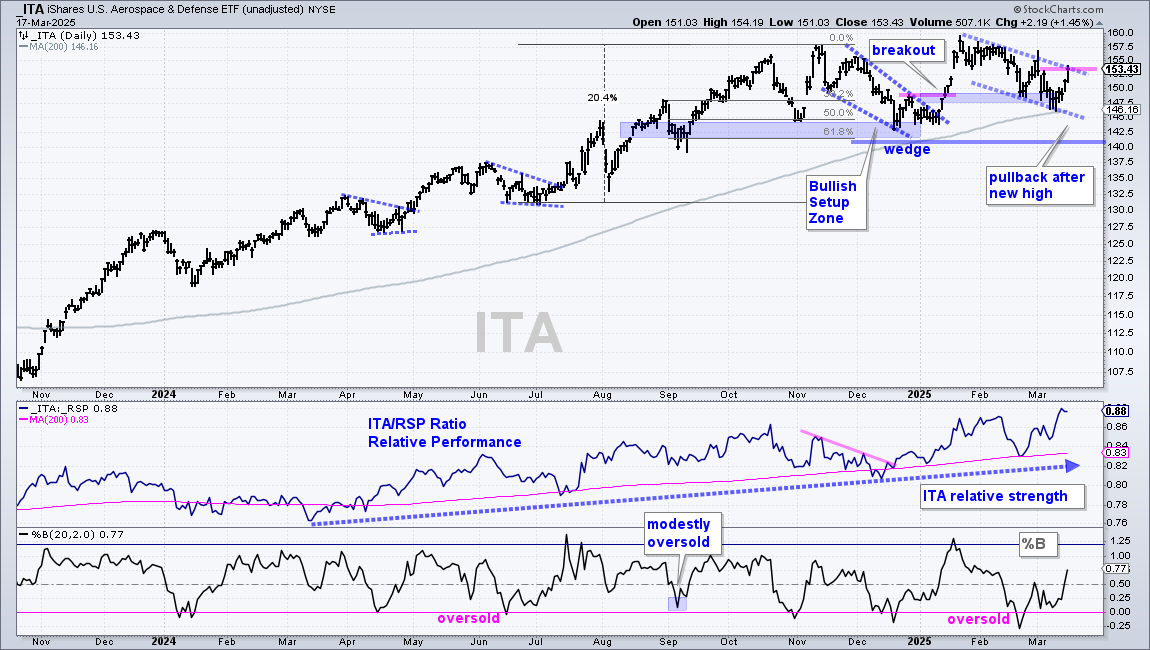
The Aerospace & Defense ETF (ITA) remains in a long-term uptrend and shows relative strength. Short-term, the ETF hit a new high in mid January and pulled back to the rising 200-day SMA in early March. I view this pullback as a correction within a bigger uptrend. The blue dashed lines mark a small falling channel and the ETF is making a breakout bid with a four day surge (+3.5%). A breakout would signal a continuation higher and open the door to new highs. For now, I will use the December low to mark key support at 140. The middle window shows the price-relative (ITA/RSP ratio) hitting a new high in March as ITA continues to show relative strength.
IBB Bounces within Wedge Pullback
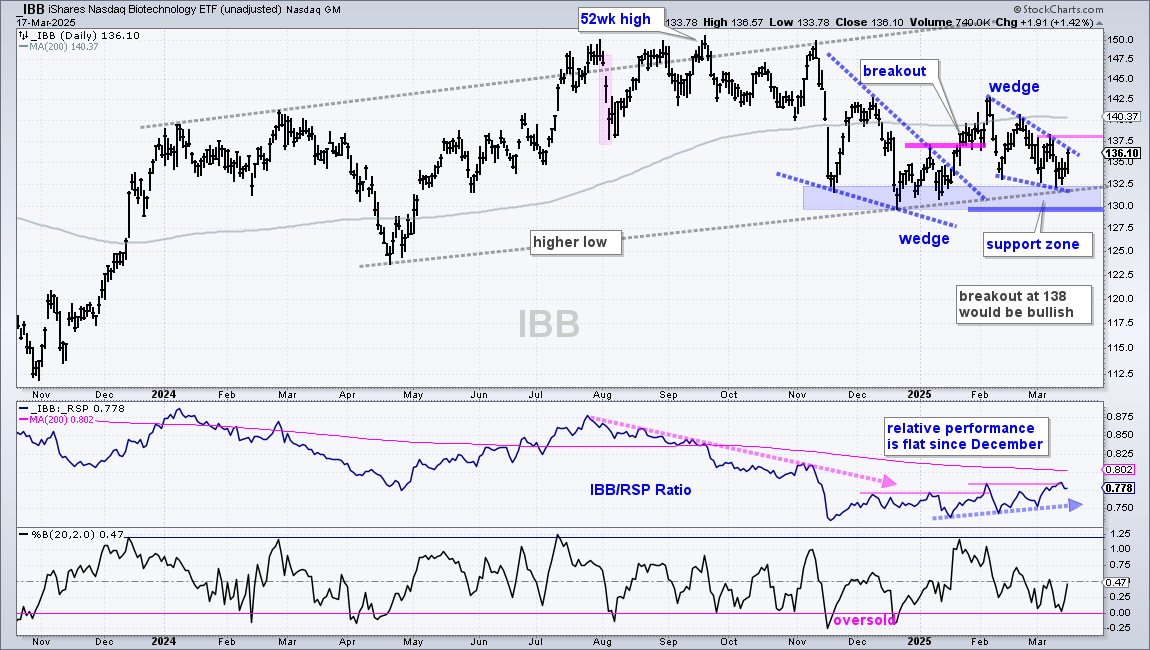
The Biotech ETF (IBB) is showing relative and absolute strength year-to-date with a 3% gain in 2025. Even though IBB is trading below its 200-day SMA, I can make the case for a long-term uptrend with a higher low from April to December and higher high from February to September (52-week high). IBB fell in late 2024 with a falling wedge and broke out with a surge in mid January (breakout). With a pullback into March, a second wedge formed as IBB tested the support zone in the 130-132.5 area (blue shading). A breakout at 138 would be bullish and argue for a continuation of the choppy uptrend (gray dashed lines). A close below 130 would break the support zone and reverse this choppy uptrend. The middle window shows the price-relative (IBB/RSP ratio) edging higher this year as IBB slightly outperforms RSP. This is a start and a break above the 200-day SMA would show relative strength.
IHI Bounces Off Rising 200-day SMA
Despite a 6.4% decline this month and brief break of the 200-day SMA, the Medical Devices ETF (IHI) remains in a long-term uptrend. This decline should serve as a warning that even defensive stocks and equity ETFs are not immune to broad market declines. Also note that the top three stocks account for around 45% of the ETF (ABT, ISRG, BSX), which makes it very top heavy. On the price chart, IHI tagged a new high in February and fell to the rising 200-day SMA last week. There is also a Bullish Setup Zone in the 57-58 area (blue shading). Here we have the 61.8% retracement, broken resistance and supports from the September-December lows. RSI also became oversold with a dip below 30 last week. The combination of oversold conditions and the Bullish Setup Zone produced an oversold bounce the last two days. This bounce also reinforces support in the 58 area and I will mark key support at 57.
AMLP Breaks Out of Small Corrective Pattern
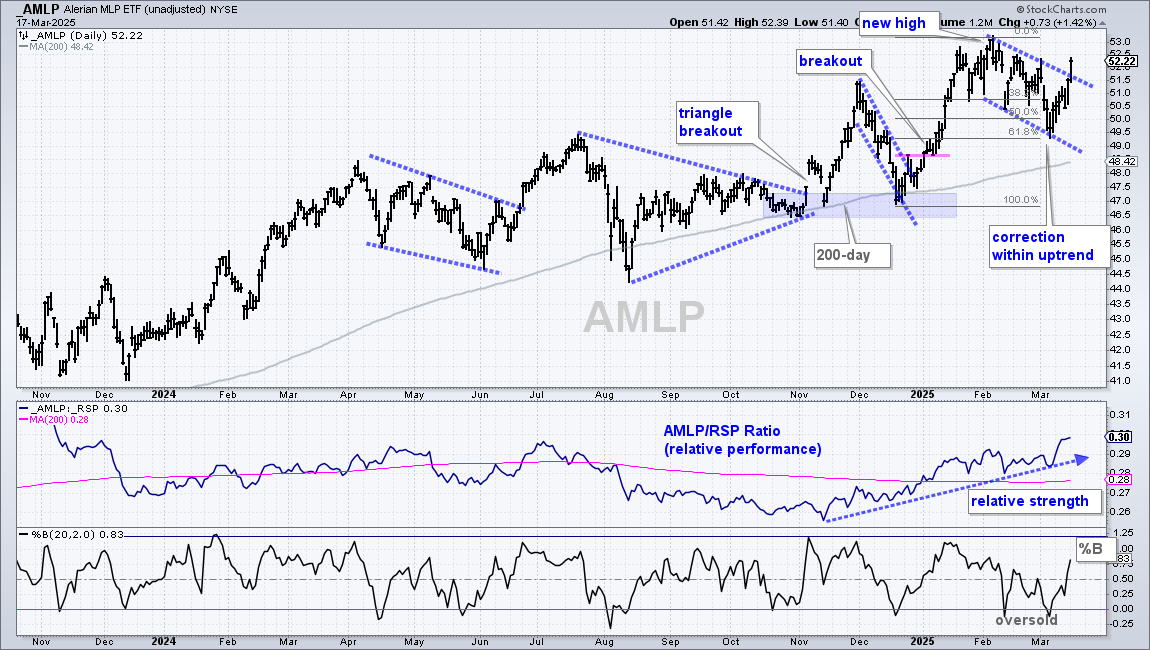
The MLP ETF (AMLP) remains in a leading uptrend with a new high in February, a pullback into March and a breakout surge the last five days. First, AMPL hit a new high in February and remains well above the rising 200-day SMA. Second, the price-relative turned up in late November and hit a multi-month high this week. Overall, we have a long-term uptrend and relative strength. Short-term, the ETF pulled back into early March with a small falling channel that retraced 61.8% of the December-February advance. AMLP also became oversold in early March as %B dipped below zero. As noted last week, there was a bullish setup with the falling channel, retracement and oversold condition. AMLP broke out and this opens the door to new highs.
IYZ Bounces off Support Zone
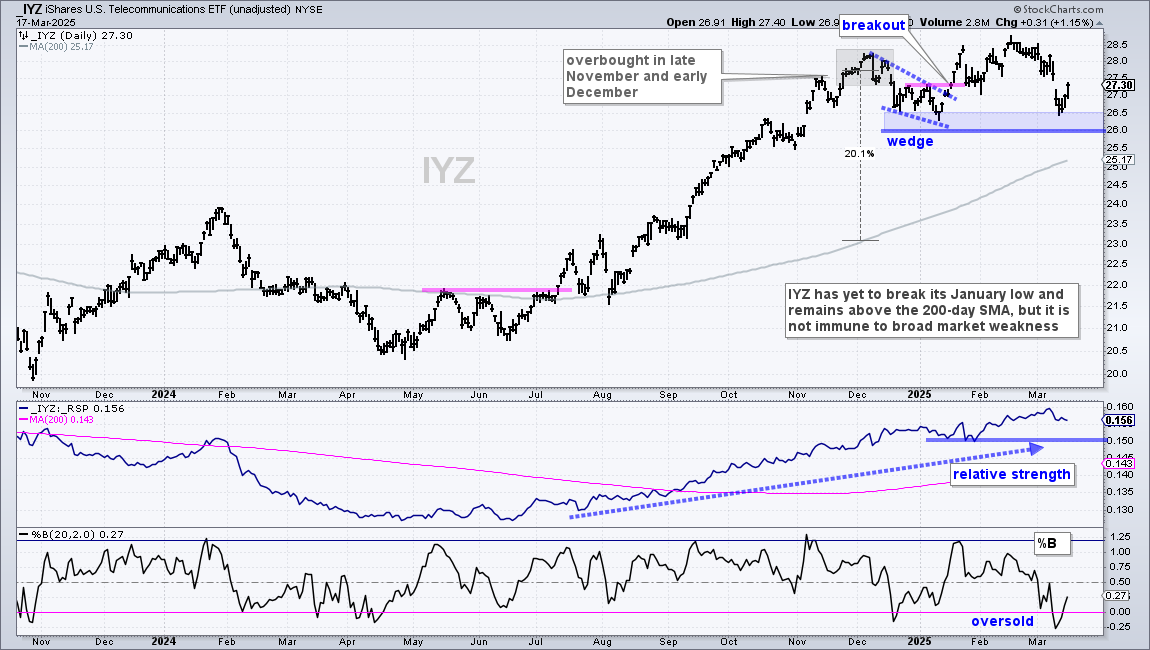
The Telecom ETF (IYZ) remains in a leading uptrend with a new high in February and a rising price-relative (IYZ/RSP ratio). Despite its leading uptrend, the ETF was hit hard in March as it fell to its January lows. These lows mark a support zone in the 26-26.5 area (blue shading). IYZ held support here with a bounce the last two days. This bounce reinforces the support zone and a close below 26 would reverse the long-term uptrend.
Send feedback to support(at)trendinvestorpro.com or use the contact form.