Market Regime – Breadth Improves – Yields Spreads Narrow – 10Yr Yield Falls

This Market Regime Page is updated every Wednesday. 
An alert will be sent should conditions change between updates

Report Headlines

  • Zweig Breadth Thrust Remains Active (bullish)
  • 5/200 1% Cross for SPY Remains Active (bullish)
  • S&P 500 Breadth Improves, but Remains Majority Bearish
  • QQQ  and Nasdaq 100 Breadth are Majority Bullish
  • S&P 1500 Breadth Improves, but Remains Majority Bearish
  • Yield Spreads show No Stress in Credit Markets
  • Fed is Behind the Curve and On Hold
  • 10-yr Yield Extends Lower after Break Down

Breadth Improves within the S&P 500 and S&P 1500

The majority of indicators remain bearish, but breadth continues to improve. First, the S&P 500 EW ETF joined SPY and QQQ with a close above the upper Bollinger Band (125,1) this week. Second, the percentage of S&P 500 stocks above their 200-day SMA exceeded 60% for the first time since February. Third, the other breadth indicators in the S&P 500 and S&P 1500 surged the last five days. Further strength would flip more of these indicators bullish. Stay tuned…

Elsewhere, the Zweig Breadth Thrust remains active since April 24th and the SPY 5/200 %Differential exceeded 1% on May 12th. Yield spreads continue to narrow and show no signs of stress. The 10yr T-Yield extended its decline, which is helping small-caps, mid-caps and cyclical groups.

Technical Event Timeline

Zweig Breadth Thrust Remains Active

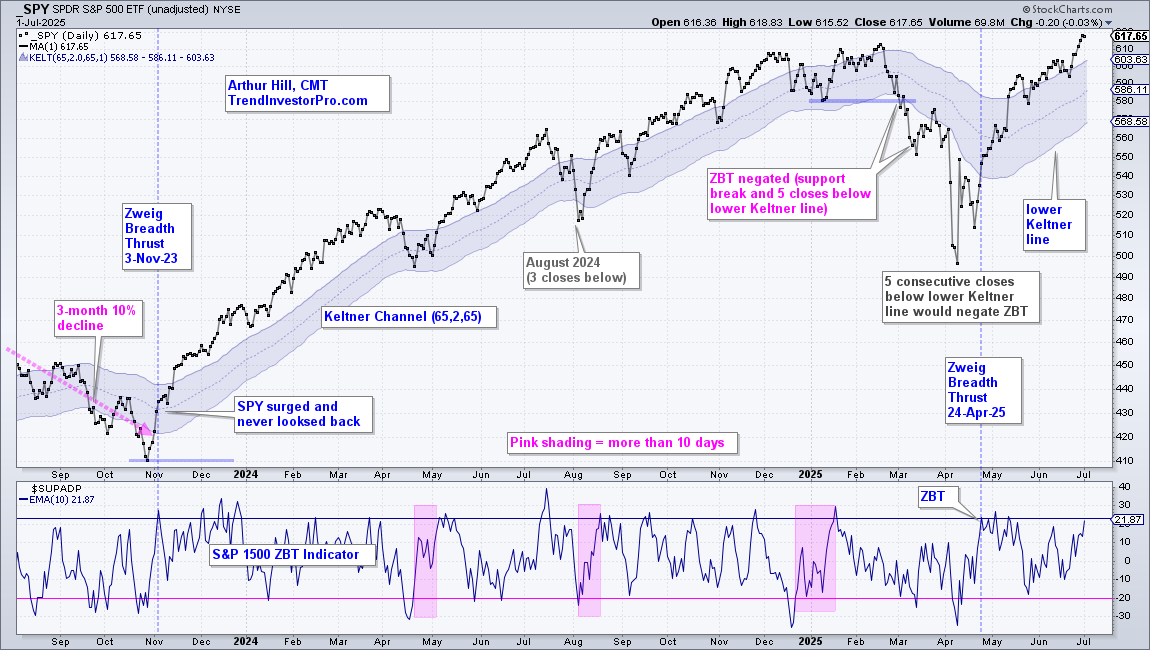
A Zweig Breadth Thrust triggered on April 24th and SPY also moved above the lower Keltner line (65,2,65). As laid out in this strategy report, the breadth thrust is bullish as long as SPY holds the lower Keltner line. Five consecutive closes below the lower Keltner line would negate the Zweig Breadth Thrust.  
5/200 1% Cross Remains Active (bullish)

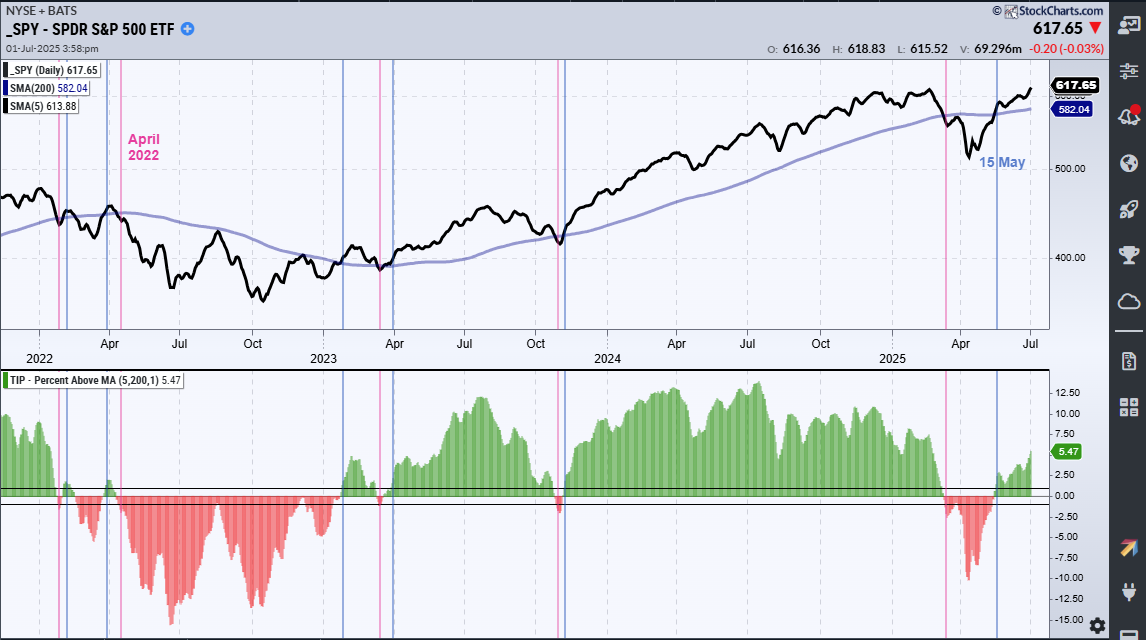
The chart below show SPY with the 5-day SMA, the 200-day SMA and the Percentage difference between the two in the indicator window (Percent above MA(5,200,1). A bullish signal triggers when Percent above MA crosses above +1% (blue lines) and the bearish signal triggers with a cross below -1% (pink lines). As with all trend-following indicators and moving average crosses, there will be whipsaws (bad signals) and extended trends (good signals). The 5-day moved more than 1% above the 200-day SMA for a bullish trend signal on May 15th. This signal remains valid until the 5-day is more than 1% below the 200-day SMA. See this research report on the 5/200 day SMA cross for SPY, QQQ, MDY and IJR.
This indicator is one of eleven in the TIP Indicator Edge plugin for StockCharts ACP.

S&P 500 Breadth Improves, but Remains Majority Bearish

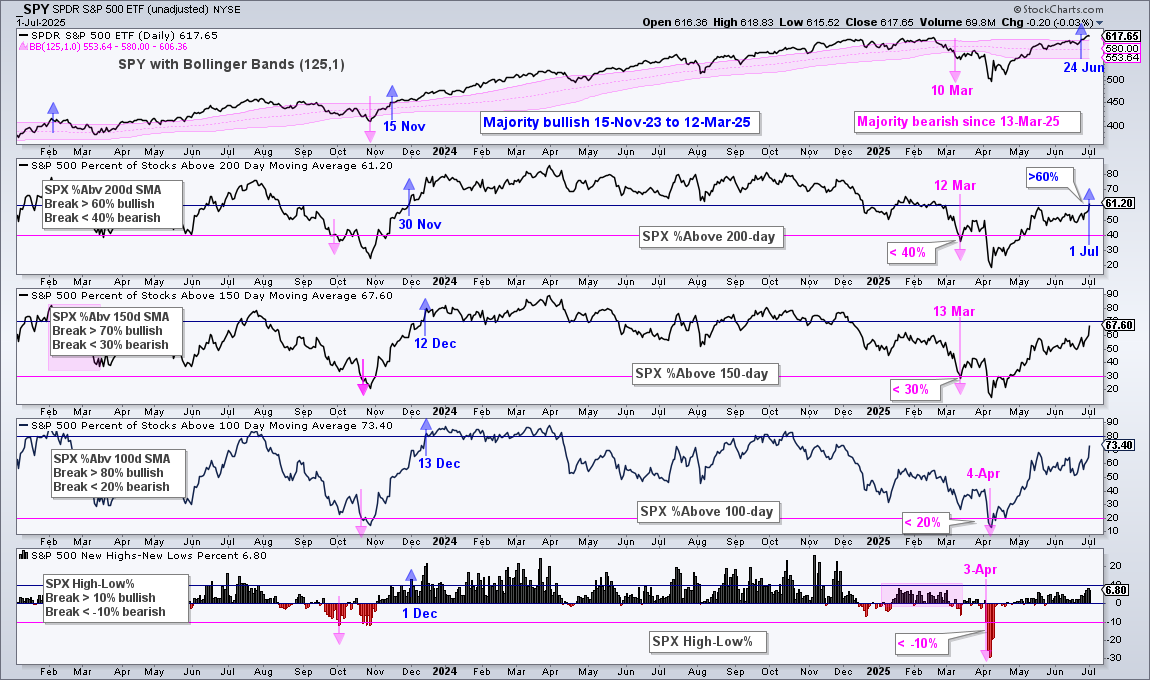
Breadth improved over the last five days as SPX %Above 200-day SMA surged above 60% (61.20%). Previously, SPY broke above the upper Bollinger Band to signal a long-term uptrend on June 24th. Two of the five indicators are bullish, which means only one more bullish signal is needed to turn the group net bullish. Here are the three to watch. SPX %Above 150-day SMA surged to 67.6% and needs to clear 70%. SPX %Above 100-day SMA surged to 73.40% and needs to clear 80%. SPX High-Low Percent surged to 6.8% and needs to clear 10%. See the blue/pink arrows and dates for signals.
About the Major index ETFs and Breadth Signals

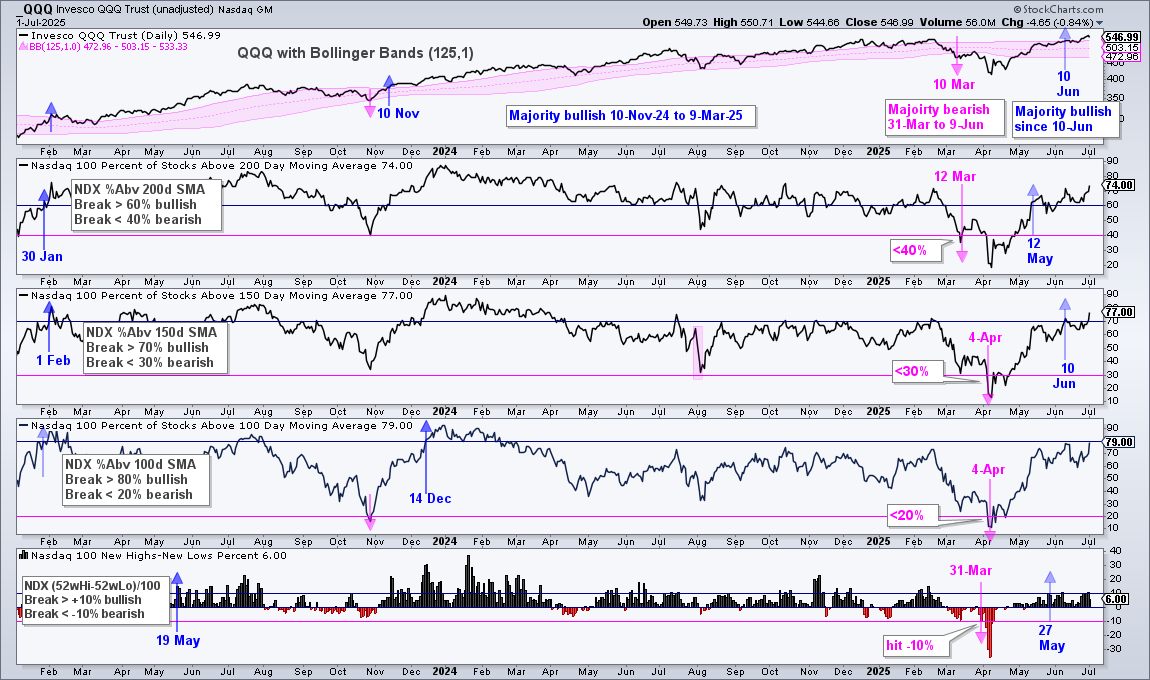
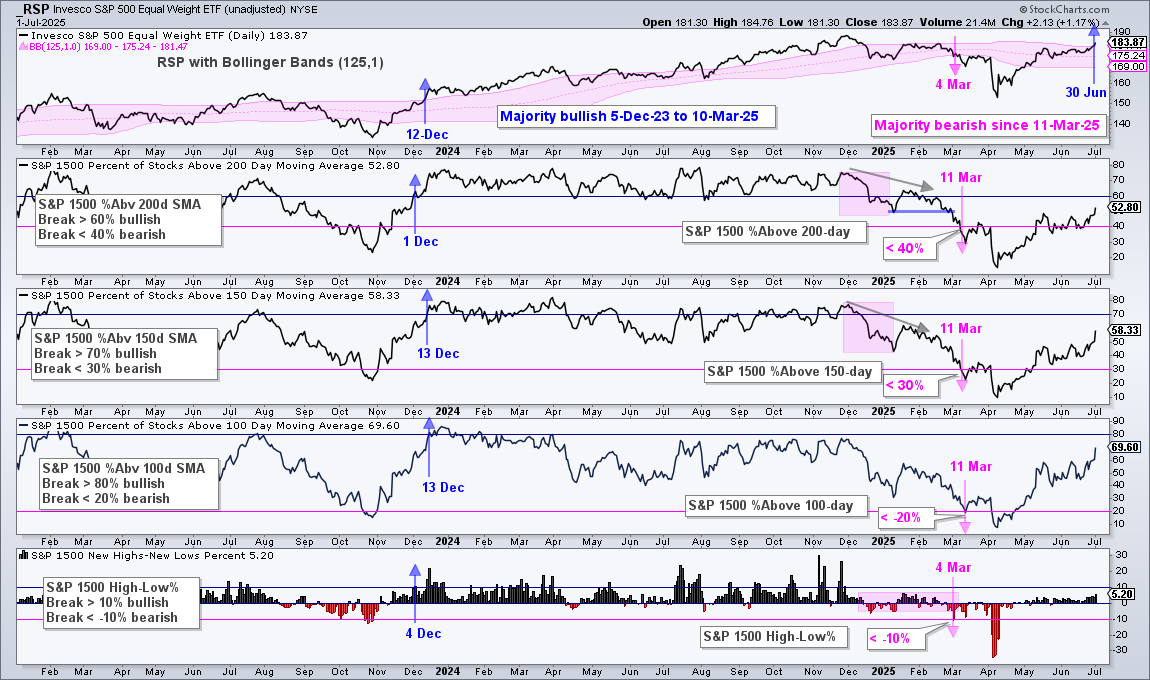
The top window on each breadth chart shows the corresponding major index ETF with Bollinger Bands (125,1). An uptrend signals when the ETF breaks above the upper Bollinger Band and a downtrend signals with a break below the lower band. The index ETFs are the S&P 500 SPDR (SPY), Nasdaq 100 ETF (QQQ) and S&P 500 EW ETF (RSP).

Each index has four breadth indicators. SPY uses S&P 500 breadth, QQQ uses Nasdaq 100 breadth and RSP uses S&P 1500 breadth.

  • The percentage of stocks above the 200-day SMA triggers bullish with a move above 60% and bearish with a move below 40%.
  • The percentage of stocks above their 150-day SMAs triggers bullish with a move above 70% and bearish with a move below 30%.
  • The percentage of stocks above their 100-day SMAs triggers bullish with a move above 80% and bearish with a move below 20%.
  • High-Low Percent triggers bullish with a move above +10% and bearish with a move below -10%. High-Low Percent is the percentage of stocks making 52-week highs less the percentage making 52-week lows.

These bullish/bearish signal thresholds are designed to identify significant changes in the stock market (bull market or bear market). As trend-following signals, they will lag and there will be whipsaws. Long-term, these signals keep us on the right side of the market. The idea is to be invested during bull markets (risk-on) and in cash during bear markets (risk-off).

QQQ  and Nasdaq 100 Breadth are Majority Bullish

The majority of indicators, four of five, are bullish as Nasdaq 100 stocks continue to lead the market. QQQ is trading near a new high. Over 70% of Nasdaq 100 stocks are above their 200, 150 and 100 day SMAs. NDX High-Low Percent is dragging its feet at bit at +6%, but has been positive since mid May. This means new highs outnumber new lows and this is bullish.
S&P 1500 Breadth Improves, but Remains Majority Bearish

RSP price and S&P 1500 breadth also improved, but the majority of indicators remain bearish. Most recently, RSP broke the upper Bollinger Band on June 30th for a bullish trend signal. S&P 1500 %Above 200-day and %Above 150-day moved above 50% for the first time since February. S&P 1500 %Above 100 surged to 69.60% and High-Low Percent hit +5.2%. These are strong improvements and further follow through would lead to bullish signals. See the blue/pink arrows and dates for signals.
Yield Spreads show No Stress

The chart below shows SPY, the Junk Bond Spread ($$HYIOAS) and the BBB Bond Spread ($$BBBOAS). The Junk Spread and the BBB spread fell back to their March levels in mid May and worked their way lower the last two months. Both are below their 200-day SMAs. This narrowing shows confidence in the credit markets and is bullish for stocks. The pink lines mark levels to watch for an upturn (widening) that would be negative for stocks (3.5 on the Junk Spread and 1.25 on the BBB spread).   
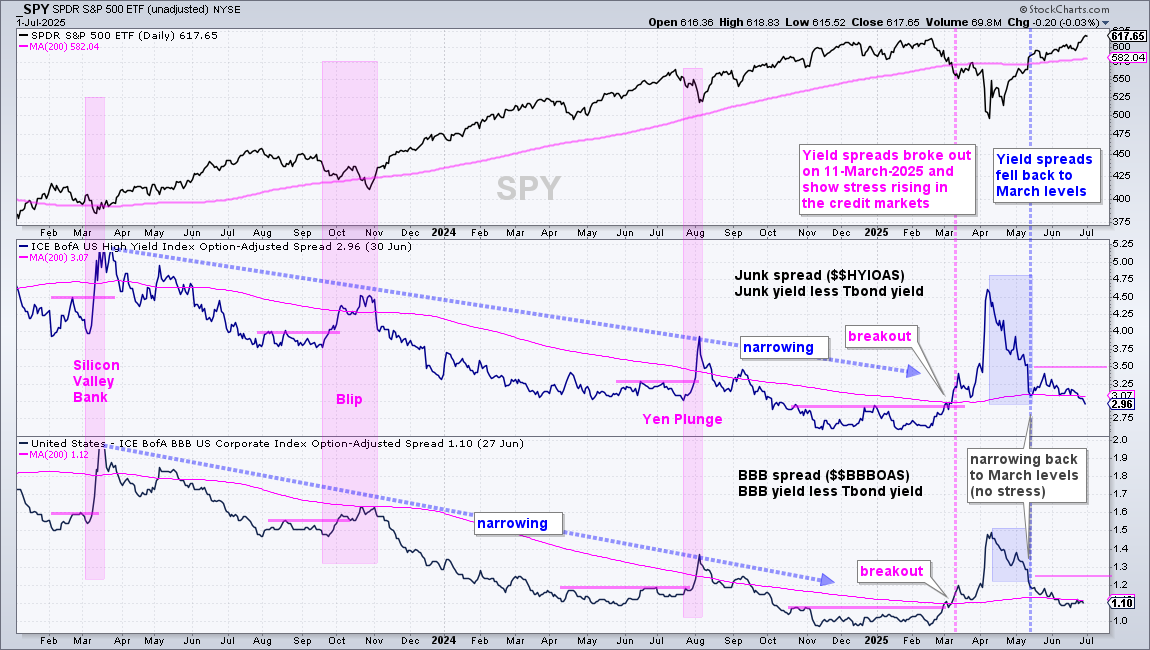
The yield spread is the difference between the Junk Bond Yield or BBB Bond Yield and a comparable Treasury Bond Yield. Junk and BBB bonds represent risk assets, while Treasuries represent relative safe-havens. The spread is the risk premium for holding the riskier assets. Narrow/narrowing spreads show confidence and this is bullish for stocks. Wide/widening spreads show stress and this is negative for stocks.

Fed on Hold and Behind

The top window shows the Fed Funds Target Rate ($$FEDTGT) and the 2-yr Treasury Yield ($UST2Y). $UST2Y typically leads the Fed Funds Rate. Notice how $UST2Y turned up in late 2021, well ahead of the tightening cycle. Also notice how it turned down in summer 2024, ahead of the easing cycle. $UST2Y remains below the Fed Funds Target Rate and this suggests that the Fed is behind the curve. The middle window shows the 3-month Treasury Yield ($UST3M), which also tends to lead the Fed. $UST3M has been range bound between 4 and 4.5 percent for 2025, which means the Fed is on hold. A break from this range will provide the next directional clue for the Fed. 
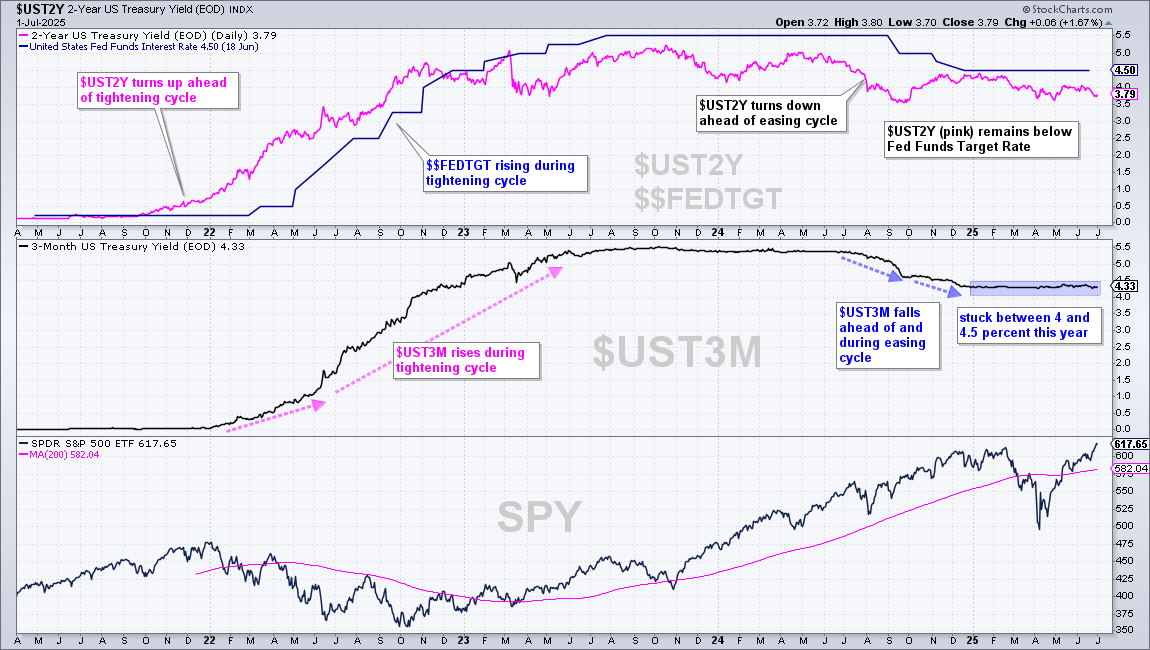
Several factors influence short-term Treasury yields, but they are still closely aligned with Fed policy and often lead the Fed. This means the yield often peaks (troughs) and turns down (up) before the Fed starts to lower (raise) rates. We use the 3-month Treasury yield to identify current Fed policy and anticipate the next Fed move

10-yr Yield Extends on Break Down

The next chart shows the 10-yr Treasury Yield ($UST10Y) as a line plot to filter out some of the noise. First, there is a long-term downward bias with a lower high and lower low sequence over the last two years (pink dashed lines). Second, $UST10Y broke down in February and fell to 4% in April. Third, the April-May bounce to 4.6% formed a rising wedge and lower high, making this a counter-trend bounce. $UST10Y broke down last week with a move below 4.35%. Re-evaluation resistance is at 4.55 (June high plus a buffer).
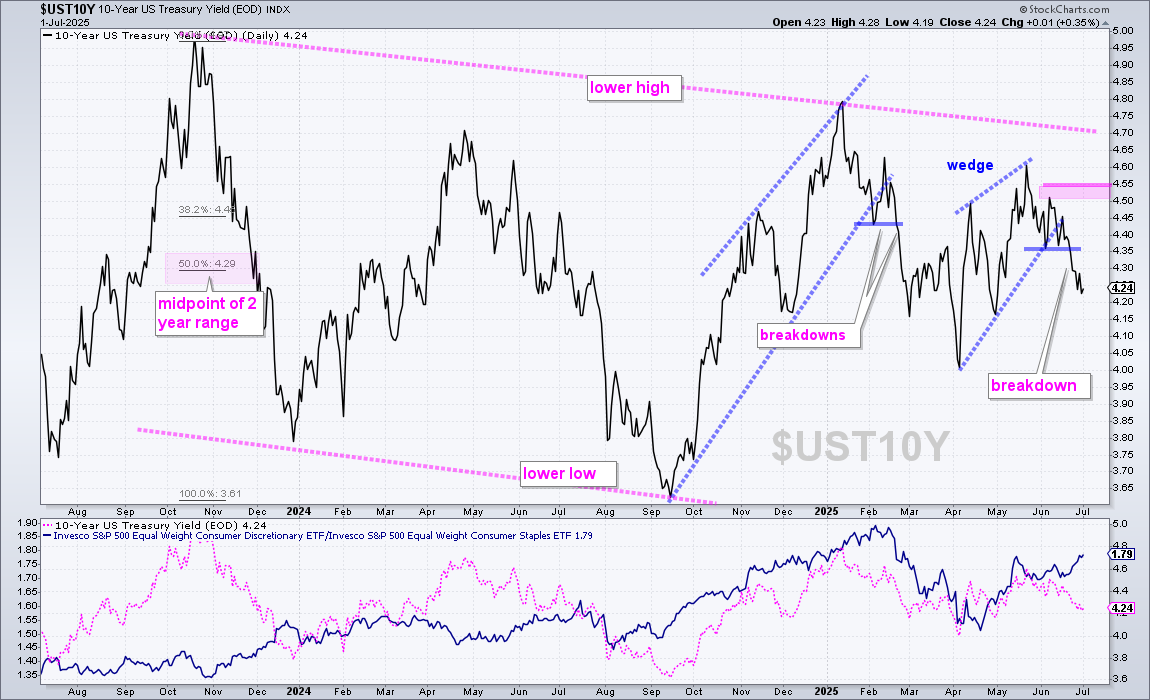
The 10-yr Treasury Yield is the most important benchmark for long-term rates and mortgages. The bottom window in the chart above shows $UST10Y with the EW Consumer Discretionary ETF (RSPD). Several factors influence long-term Treasury yields: growth expectations, inflation expectations, government debt levels, tariffs and foreign bond holders. The 10-yr Treasury Yield typically falls when the economic outlook dims and/or inflation expectations rise. Conversely, the yield typically rises when the economic outlook is bright and/or inflation expectations fall.

Thanks for tuning in and have a great day!

ETF Report – Tech ETFs Extend on Market Leading Rally – More Flag/Pennant Breakouts

Large-caps and tech stocks continue to lead the market with SPY and QQQ notching new highs. The Technology SPDR, Communication Services SPDR and Industrials SPDR also hit new highs, and the Finance SPDR is not far off. The leaders consolidated in late May and broke out in early June. We then saw consolidations form in the next

ETF Report – Tech ETFs Extend on Market Leading Rally – More Flag/Pennant Breakouts Read More »

Market-ETF Report – Bonds Break Out – Metals Remain Strong – Lithium and Bitcoin Set Up

ETFs related to commodities, bonds and crypto continue to feature prominently in the top twenty. In fact, 10 of the top 20 are related to these three groups. In a bull market, we typically see 15 or more equity ETFs in the top 20. This is because bull markets lift most equity-related boats. The table below highlights ten ETFs related to commodities, bonds and crypto (blue shading). Strength in these alternatives means

Market-ETF Report – Bonds Break Out – Metals Remain Strong – Lithium and Bitcoin Set Up Read More »

Market-ETF Video – Another Gap-Surge – Tech ETFs Lead – Commodities Pull Back

Stocks moved sharply higher the last two days with SPY surging 2% and gapping up on Tuesday. The Technology SPDR is leading the sector SPDRs with a gap-surge to new highs this week. Communication Services and Industrials are not far behind. Today’s video will follow up on the pennant/flag breakouts from early June and the Chandelier Exits. We also highlight some other flag/pennant formations. Elsewhere, commodity-related ETFs are pulling back and the Bitcoin ETF formed a bull flag. The 10-yr Treasury Yield broke down as the 7-10Yr TBond ETF broke out.

Market-ETF Video – Another Gap-Surge – Tech ETFs Lead – Commodities Pull Back Read More »

Market Regime Charts – NDX Stocks Lead – Spreads Show no Stress – 10Yr Breaks Down

The weight of the evidence remains mixed. Of the 15 signals on the first three charts, five are bullish and ten are bearish. SPY and QQQ are in long-term uptrends and Nasdaq 100 breadth is net bullish, but S&P 500 and S&P 1500 breadth remain bearish. Mid-caps and small-caps are still dragging their feet. A Zweig Breadth Thrust triggered on April 24

Market Regime Charts – NDX Stocks Lead – Spreads Show no Stress – 10Yr Breaks Down Read More »

Market-ETF Report – Cyclical Groups Bounce – More Pennants/Flags Take Shape

Stocks shrugged off the events in the Middle East and rallied on Monday. Small-caps, Consumer Discretionary, Home Construction, Banks, Infrastructure and Transports led the way higher. These are largely cyclical groups and relative strength suggest that the advance may be broadening. It is still early days, but I am seeing lots of pennants forming from mid May to June. Breakouts would

Market-ETF Report – Cyclical Groups Bounce – More Pennants/Flags Take Shape Read More »

Market-ETF Report – Commodity and Crypto Related ETFs in the Leadership Group

Commodity, crypto and a few bond related ETFs are leading. Our ETF Ranking shows that 10 of the top 20 are related to these alternatives. Equity ETFs make up the other ten, but equity alternatives remain, well, serious alternatives. In particular, metals-related ETFs continue strong (gold, silver, platinum, uranium). The Platinum ETF (PLTM), however, looks dangerously

Market-ETF Report – Commodity and Crypto Related ETFs in the Leadership Group Read More »

Market-ETF Video – Divergences Emerge – Pennants and Stops – Metals Lead

Nasdaq 100 stocks and QQQ are leading, but the weight of the evidence remains mixed for the broader market. After a big advance since early April, a pullback could be brewing as short-term bearish divergences take shape in S&P 500 breadth. We will cover the key breadth indicators, support levels for SPY/QQQ and the pennant breakouts in tech-related ETFs. Commodities remain strong with metals leading the way.

Market-ETF Video – Divergences Emerge – Pennants and Stops – Metals Lead Read More »

Market-ETF Report – Tech-ETFs Extend on Breakouts – XLK Hits New High – Banks Lag

Tech-related ETFs are leading in June as several broke out of pennants and extended higher. Today’s report will update these breakouts and their trailing stops. Despite continued strength in tech, I am seeing short-term underperformance emerge in mid-caps, finance, banks and consumer discretionary. These four are lagging the last 20 days because their respective ETFs have yet to clear their May highs.

Market-ETF Report – Tech-ETFs Extend on Breakouts – XLK Hits New High – Banks Lag Read More »

Market-ETF Report – Commodity and Crypto Related ETFs in the Leadership Group

Non-equity ETFs continue to perform well and feature in the top twenty. These include commodity, bond and crypto ETFs. This list expands when we include equity ETFs related to commodities, such as the Gold Miners ETF (GDX). GDX is part of the equity group because its components are stocks and stocks represent companies. This also applies to SIL, URA and BLOK. These ETFs are composed of stocks, not the underlying asset.

Market-ETF Report – Commodity and Crypto Related ETFs in the Leadership Group Read More »

Market-ETF Video – Pennant Breakouts and Trailing Stops – NDX Stocks and Metals Lead

SPY and QQQ continued to lead the broader market higher, but MDY and IJR caught a bid with pennant breakouts this week. In fact, there are lots of pennant breakouts, especially in leading tech-related ETFs. We will cover these breakouts and show suggestions for trailing stops. Industrial and precious metals are leading the market with huge moves the last few weeks. Crypto is also perking up as IBIT breaks a flag line.

Market-ETF Video – Pennant Breakouts and Trailing Stops – NDX Stocks and Metals Lead Read More »

Market Regime – QQQ and NDX Breadth Lead Market – Small/Mid Caps Continue to Lag

QQQ and Nasdaq 100 stocks continue to lead the market since the April low. QQQ extended higher and crossed the upper Bollinger Band on Wednesday for an uptrend signal. A breadth indicator also flipped bullish, which means the Nasdaq 100 indicator group is now net bullish (four of five). There are three indicator groups totaling 15 indicators. All indicators covering the S&P 500 and

Market Regime – QQQ and NDX Breadth Lead Market – Small/Mid Caps Continue to Lag Read More »

Market-ETF Report – Trailing Stops for Pennants – Utes, Staples and Insurance

SPY and QQQ continue to lead the market with leading breakouts in mid May. Small-caps surged over the last five days, but the S&P SmallCap 600 SPDR (IJR) remains below its falling 200-day SMA. IJR is also showing relative weakness. Despite strength and leadership in large-caps and large-cap techs, many are looking quite

Market-ETF Report – Trailing Stops for Pennants – Utes, Staples and Insurance Read More »

Market-ETF Report – Gold Miners Lead Gold – PALL Holds Upswing – ETHA Goes High and Tight

Despite the stock market surge from early April to early June, only a handful of stock ETFs are outperforming alternative asset ETFs. Commodity and crypto related ETFs account for twelve of the twenty year-to-date leaders in the all-weather ETF list, which has 74 ETFs. The year-to-date percentage change (YTD %Chg) is perfect for measuring performance because is encompasses the stock market

Market-ETF Report – Gold Miners Lead Gold – PALL Holds Upswing – ETHA Goes High and Tight Read More »

Market-ETF Video – NDX Stocks Lead – Flag/Pennant Breakouts – Commodities Still Leading

The broader market remains mixed with fewer than 50% of S&P 1500 stocks in long-term uptrends. Strength is concentrated in large-caps and large-cap tech stocks (Nasdaq 100). Several tech ETFs formed flag/pennant patterns the last two weeks and broke out. In an interesting twist, we are also seeing strength in Consumer Staples and Utilities, two defensive groups. Commodities remain strong, especially metals. Silver and Platinum broke out, while Palladium turned up.

Market-ETF Video – NDX Stocks Lead – Flag/Pennant Breakouts – Commodities Still Leading Read More »

Market Regime – ZBT and 5/200 Cross Bullish – Long-term Breadth Mixed

There is no change for the broad market environment, which is mixed, at best, and still bearish at worst. The weight of the evidence turns bearish in mid March and this signal has yet to be reversed. Keep in mind that SPY and QQQ are part of the broad market environment, but they are large-cap driven ETFs that do not always reflect conditions under the surface. Breadth indicators reflect conditions for the average stock.

Market Regime – ZBT and 5/200 Cross Bullish – Long-term Breadth Mixed Read More »

Market-ETF Report – Large Techs Lead – Pennants/Flags Abound – XLU-XLP-KIE Set Up

Even though small-caps and mid-caps are dragging their feet, Nasdaq 100 stocks are leading with the highest percentage above their 200-day SMAs. This is a positive sign for large-cap stocks and stocks in the Technology sector. In addition, SPY and QQQ are holding their May 12th breakouts and 200-day SMA. Again, this is positive for large-caps and tech stocks. Small-caps and mid-caps are still

Market-ETF Report – Large Techs Lead – Pennants/Flags Abound – XLU-XLP-KIE Set Up Read More »

Market-ETF Report – Silver and Silver Miners Lead – Copper Pops-Drops – Platinum Surges

Today’s report covers commodity ETFs and the Bitcoin ETF (IBIT), simply because they are leading in 2025. Year-to-date, nine of the top ten performing ETFs are commodity or crypto related. My focus list has 74 ETFs covering equities, commodities, bonds and crypto. The Aerospace & Defense ETF (ITA) is the only equity ETF in the top ten right now. The table below shows the 20 ETFs with

Market-ETF Report – Silver and Silver Miners Lead – Copper Pops-Drops – Platinum Surges Read More »

Market-ETF Video – SPY/QQQ Hold Gap Breakouts – Tech Leads – Metals Remain Strong

SPY, QQQ and XLK are leading the surge as their gap-breakouts hold. The broader market, however, remains mixed as small-caps and mid-caps lag. New highs are starting to appear with cybersecurity, defense and telecom leading the way. We are also seeing relative strength in blockchain and software. Precious metals remain strong with platinum joining the breakout parade. Copper perked up and Bitcoin is trading near new highs.

Market-ETF Video – SPY/QQQ Hold Gap Breakouts – Tech Leads – Metals Remain Strong Read More »

Market Regime – ZBT and 5/200 Cross Bullish – Long-term Breadth Mixed

The broad market environment is mixed, at best, and still bearish at worst. Keep in mind that SPY and QQQ are part of the broad market environment, but they are large-cap driven ETFs that do not always reflect conditions under the surface. Breadth indicators reflect conditions for the average stock. Just over 50% of S&P 500 stocks are above their 150 and 200 day SMAs. This

Market Regime – ZBT and 5/200 Cross Bullish – Long-term Breadth Mixed Read More »

Scroll to Top