Systematic Strategies and Next Level Technical Analysis
Market-ETF Report – Trailing Stops for Pennants – Utes, Staples and Insurance
Arthur Hill, CMT
Archive
Charts
Use CRTL+P to Print
The next report will be on Wednesday, June 4th
Report Headlines
SPY and QQQ Hold Gaps
Performance Weakens Under the Surface
Watch MDY for Signs of Broadening
Crypto and Commodity Related ETFs Leading
Pennants, Flags, Overbought, Whipsaw and Support
Pennants and Flags in Tech-Related ETFs
XLI Forms Pennant Near Prior High
Utilities SPDR Extends on Breakout
Consumer Staples SPDR Breaks Wedge Line
Insurance ETF Setting Up
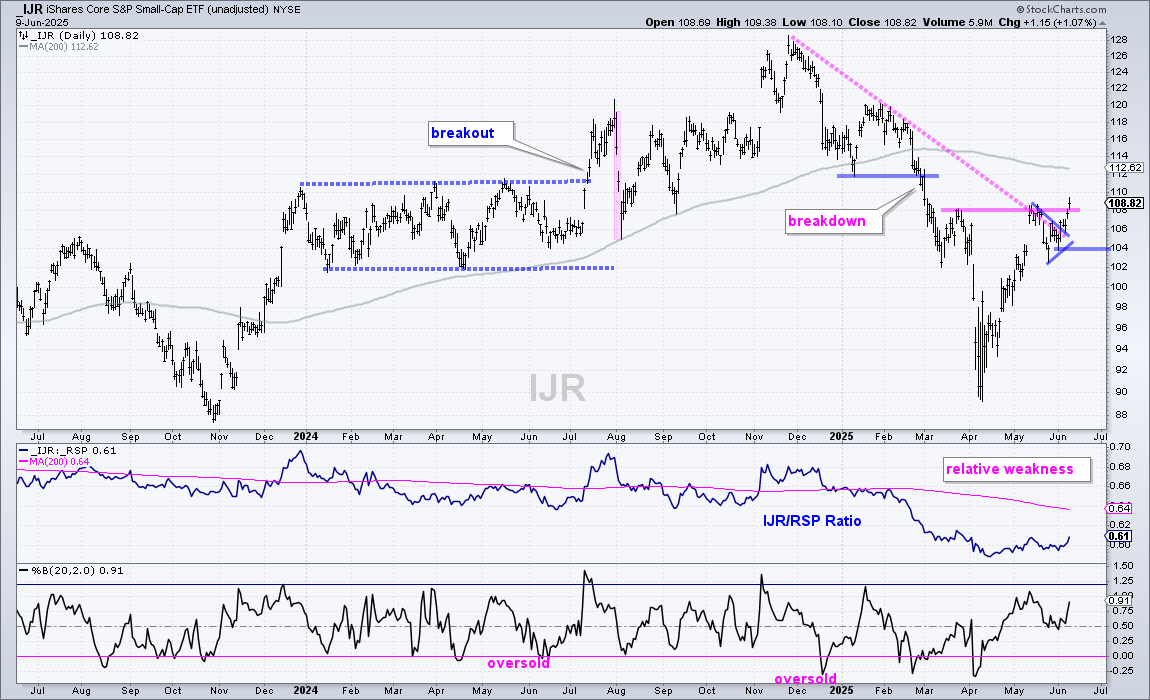
SPY and QQQ continue to lead the market with leading breakouts in mid May. Small-caps surged over the last five days, but the S&P SmallCap 600 SPDR (IJR) remains below its falling 200-day SMA. IJR is also showing relative weakness.
Despite strength and leadership in large-caps and large-cap techs, many are looking quite extended after big moves from early April to early June. Overbought conditions are not bearish. Instead, overbought conditions increase the chances for a pullback or consolidation. Elsewhere, there were several pennant breakouts last week and we will offer some suggestions for trailing stops.
Technical Event Timeline
March 13th – Bearish Long-term Breadth and Trend Indicators
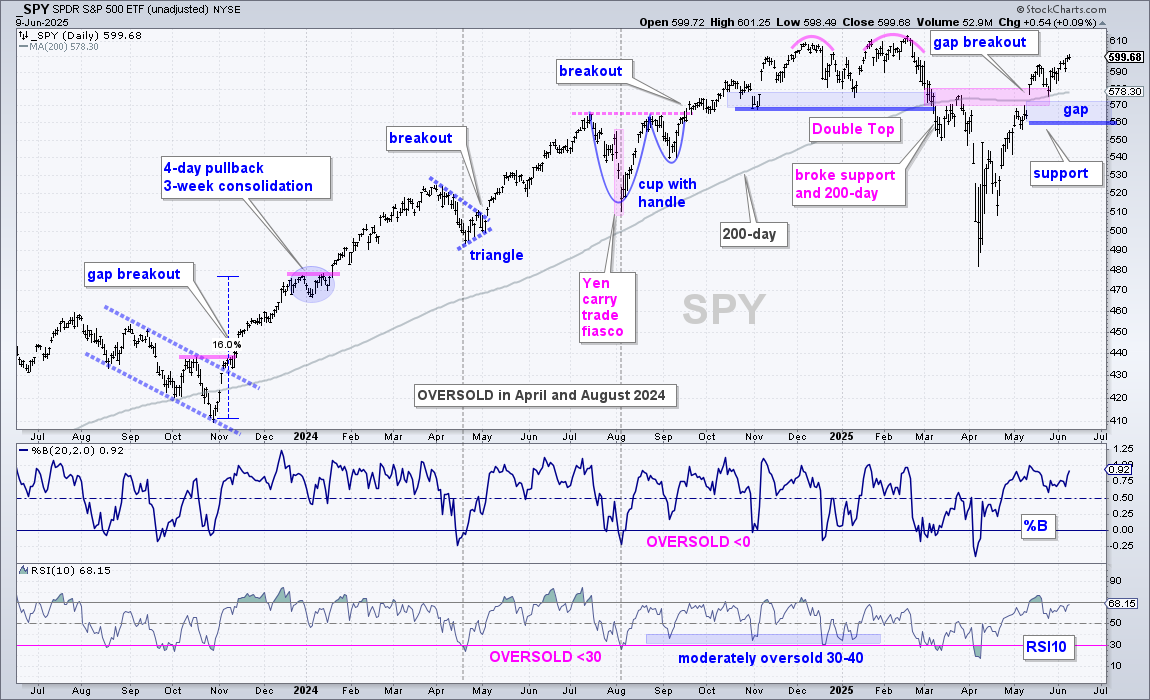
SPY and QQQ are in uptrends after the gaps and breakouts on May 12th. This is when they broke back above their 200-day SMAs and negated the March support breaks. These uptrends are in force as long as the gaps and rising 200-day SMAs hold. Adding a buffer, I am marking support at 560 for SPY and 480 for QQQ.
SPY and QQQ are up substantially since the early April low – and could be short-term overbought. However, there is not much we can do with overbought conditions in an uptrend. Why? Because overbought conditions are normal during uptrends. It is normal for RSI(10) to exceed 70 during an uptrend because pushes above 70 reflect strong upside momentum.
Most ETFs are in the trend-monitoring phase because they are in uptrends and price is looking extended. There are few setups out there. Now is the time to watch and wait for tradable pullbacks or setups. A dip into the gap zone, an RSI dip into the 30-40 zone or a %B dip into the 0-.25 area would provide the setup.
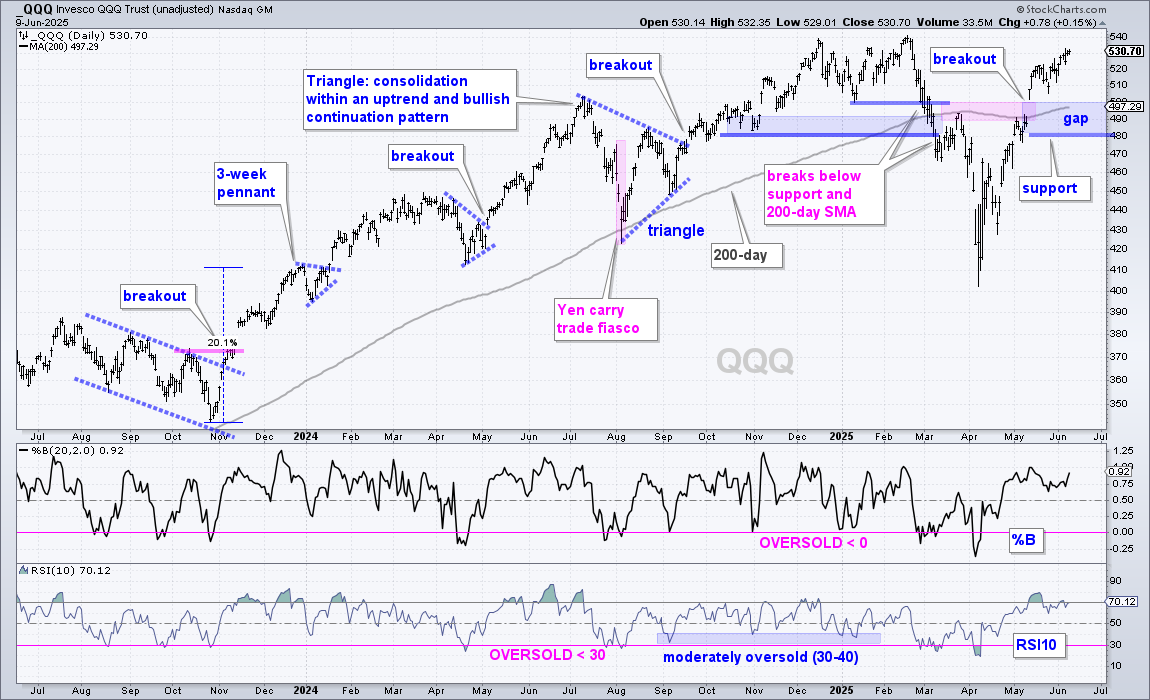
The next chart shows QQQ distancing itself from the rising 200-day SMA. I am watching the gap zone (480-500) as an area that could provide support on a pullback.
Metals, Bitcoin and Select Equity ETFs Leading
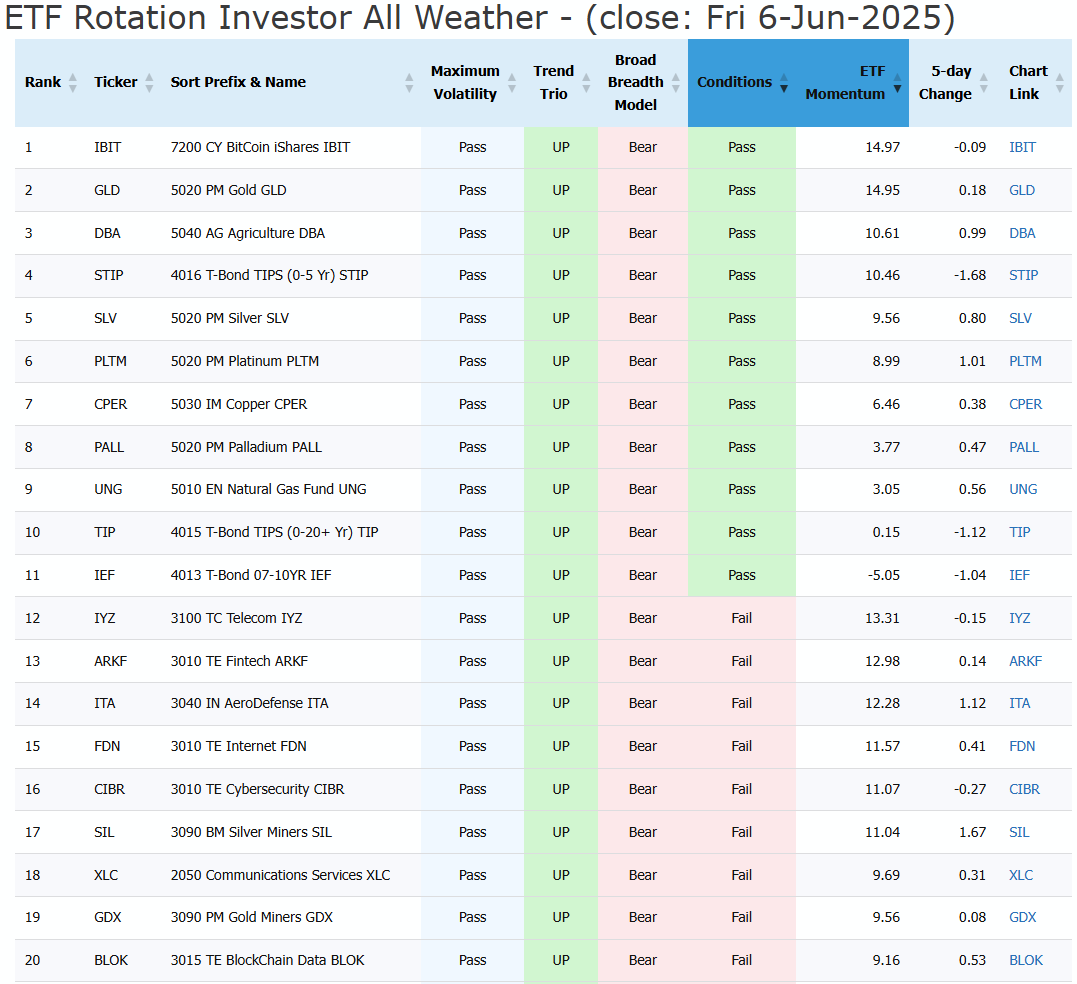
The table below shows this weekend’s momentum ranking for the core ETF list, which has 74 names. It is first sorted by conditions and then by ETF Momentum. See this report for details on the ETF Rotation Strategy. Equity ETFs receive a “Fail” for conditions because the Broad Breadth Model remains negative. This is why the sort has non-equity ETFs in the top half. Non-equity leaders include IBIT, GLD, DBA, SLV, PLTM, CPER, PALL and UNG. Note that I covered these ETFs in Thursday’s report.
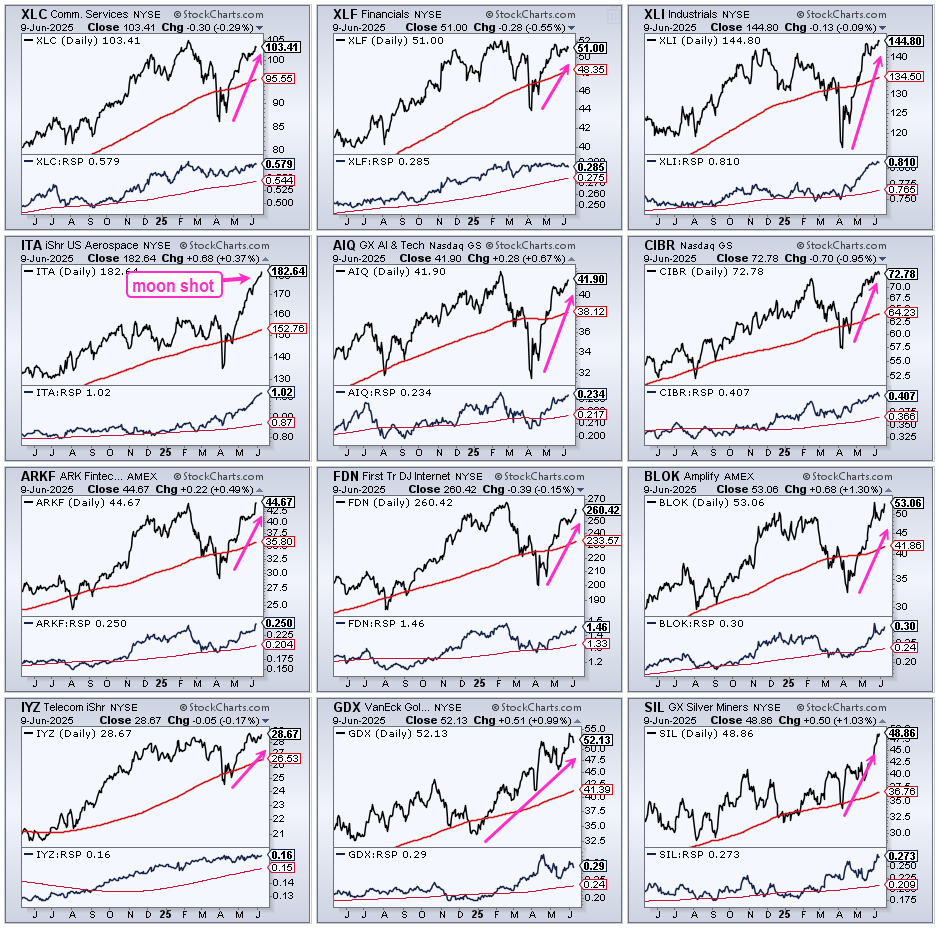
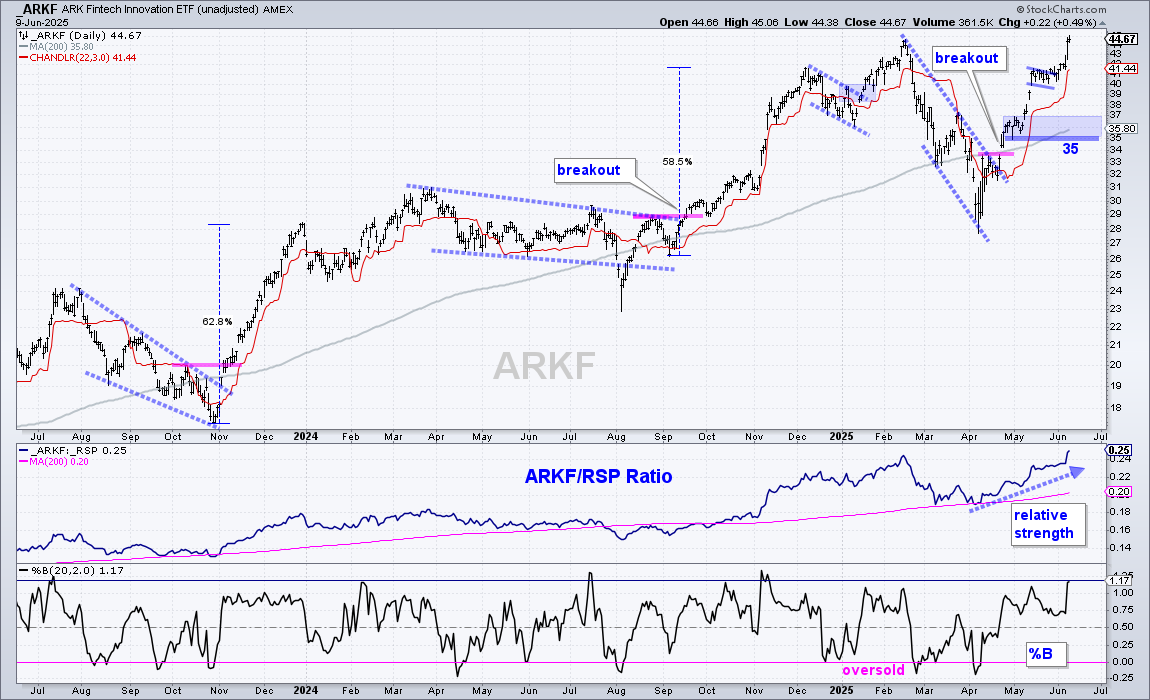
All ETFs in this list are in uptrends (Trend Trio = Up). In the bottom half, we see equity ETFs appearing with leadership coming from Telecom (IYZ), Fintech (ARKF), Defense (ITA), Internet (FDN), Cybersecurity (CIBR), Communication Services (XLC) and Blockchain (BLOK). Users can also sort by ETF Momentum to remove the conditions qualification and see the leaders. See this report for details on the Trend Trio, ETF Momentum and Broad Breadth Model.
Leading Uptrends without Setups
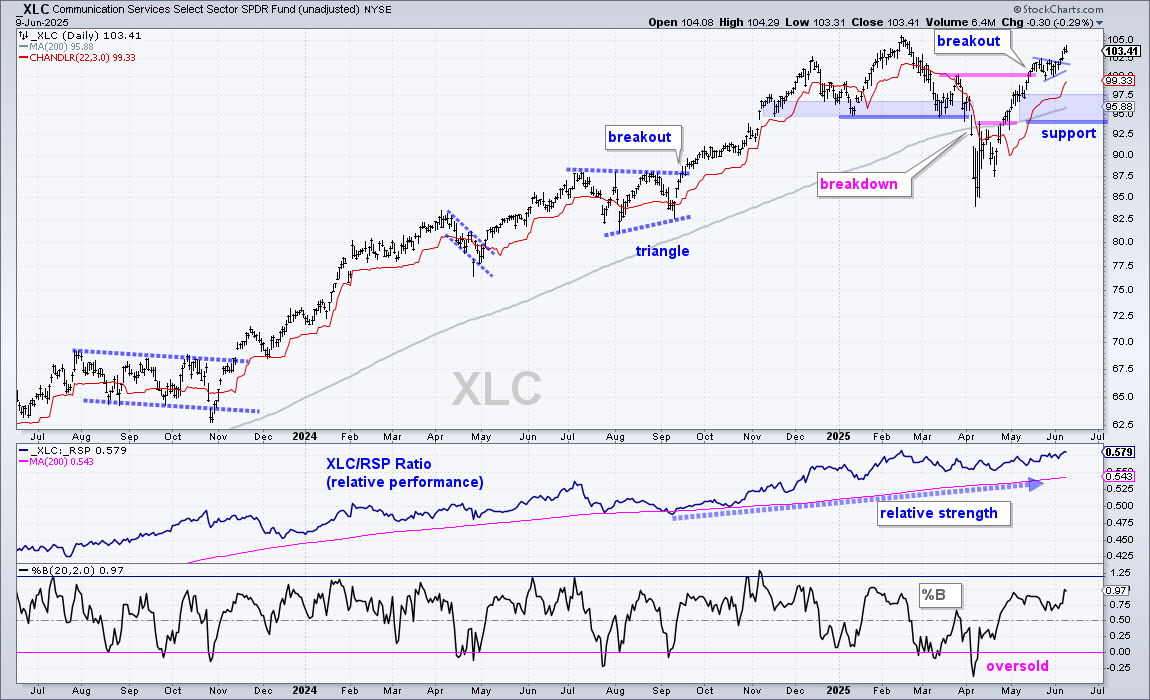
The CandleGlance chart below shows 12 leading equity ETFs. They are in clear uptrends as they trade at or near 52-wk highs. Their price-relatives (XLC/RSP ratio) are also in clear uptrends as they trade at or near 52-week highs. Most are quite extended and ripe for a rest after big moves from early April to early June.
These 12 are up between 15% (IYZ) and 58% (BLOK) the last 43 trading days. The Aerospace & Defense ETF (ITA), for example, is up 34.49% and the move was straight up (moon shot). The steepness of this advance is unsustainable and a resting period is likely in the coming weeks.
MDY Breaks Out of Pennant, But ...
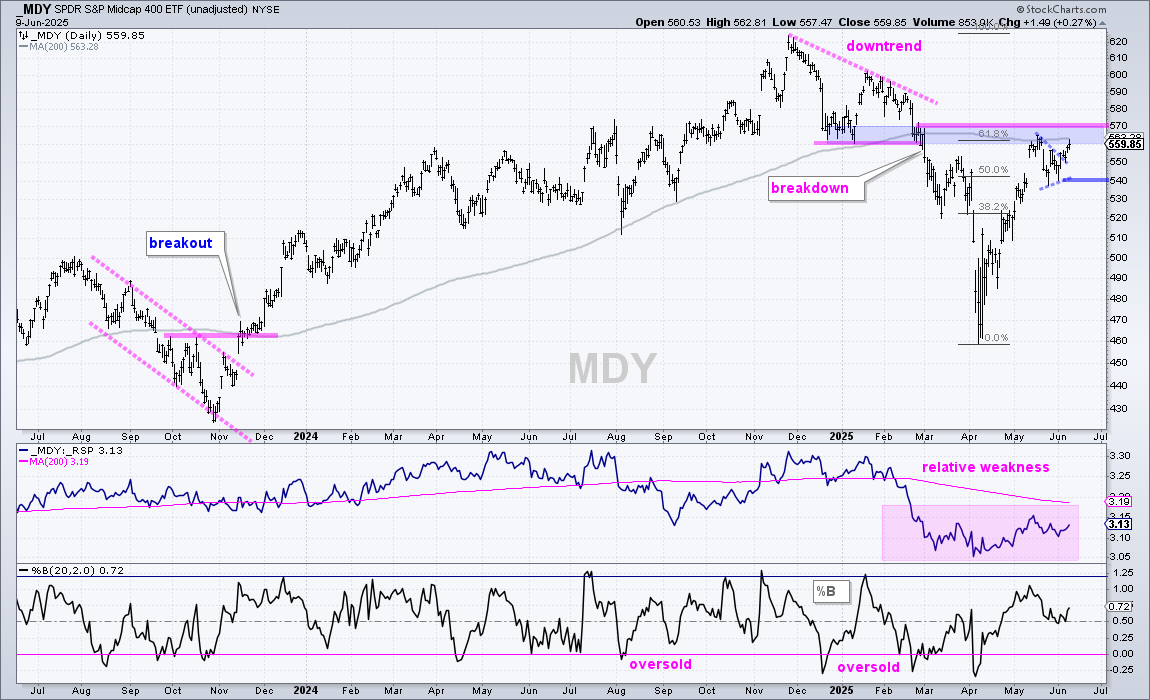
The next chart shows the S&P MidCap 400 SPDR (MDY) surging to the 200-day SMA and 61.8% retracement in mid May, forming a pennant into June and breaking out of the pennant last week. This is short-term bullish, but there is stiff resistance just ahead. Besides the 200-day SMA and 61.8% retracement, broken support turns into resistance in the 560-570 area. This is a bearish setup zone (blue shading). A break below the June 1st low (540) would reverse the short-term uptrend and affirm resistance.
Pennants and Trailing Stops
Pennants are short-term continuation patterns that take their bias from the preceding move, which was up in this case. With a breakout in play, traders must now consider the exit options. Stops that are too tight risk whipsaw, while wider stops reduce the chances of whipsaw, but at the cost of bigger losses. This is the eternal trade-off for traders.
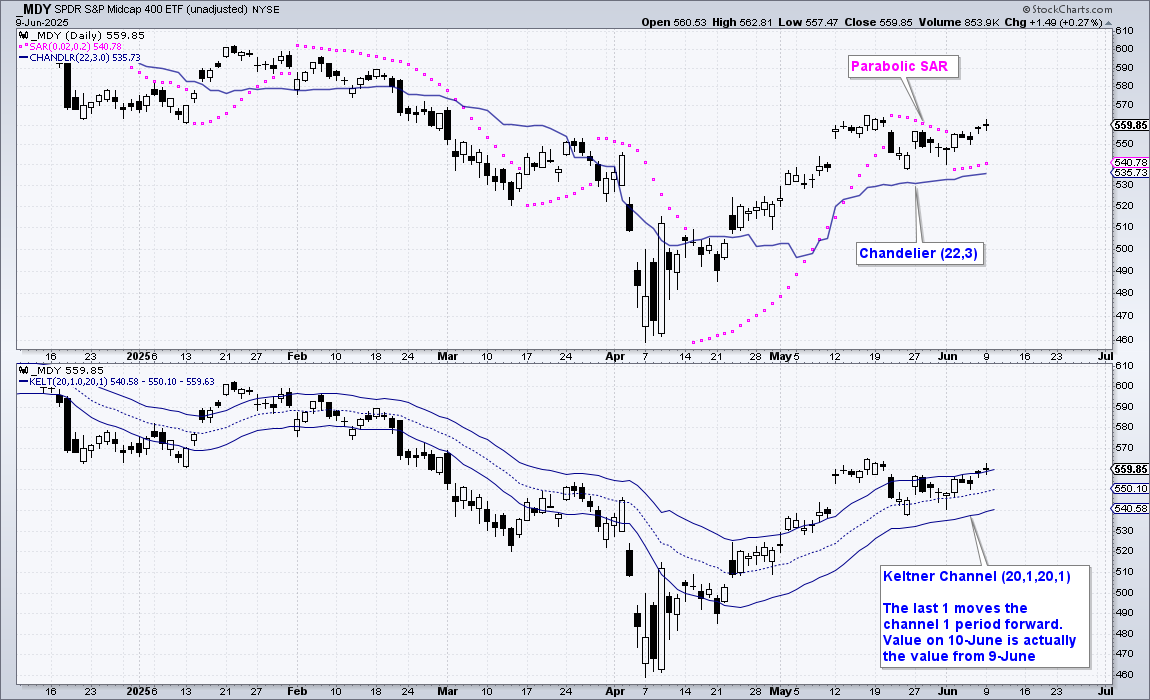
The initial stop is based on the late May low (540). The next chart shows MDY with three stop-loss alternatives should MDY continue higher. Parabolic SAR (.02,2) and Chandelier Exit (22,3) are in the top window, and the Keltner Channel (20,1,20) is in the lower window. See the ChartSchool at StockCharts for details on these indicators.
I am using the default settings for the first two. I prefer the Chandelier Exit over Parabolic SAR because the former is much easier to understand. It is hard to use an indicator if you do not fully understand how it works. The Chandelier Exit is 3 ATR(22) values below the 22-day high. It rises as long as prices rise. A close below the exit line means price fell more than 3 ATR(22) values from the high, which is quite the drop. The Chandelier Exit is currently at 535, just below the late May lows.
The bottom window shows MDY with the Keltner Channel (20,1,20,1). The middle line is a 20-day EMA, the channel is 1 ATR(20) value above/below the EMA and the indicator is pushed forward 1 day (last 1 in the parameters). The lower line is currently at 540, which jibes with the initial stop-loss based on the June 1st low.
Tech-Related ETFs Break Out of Pennants
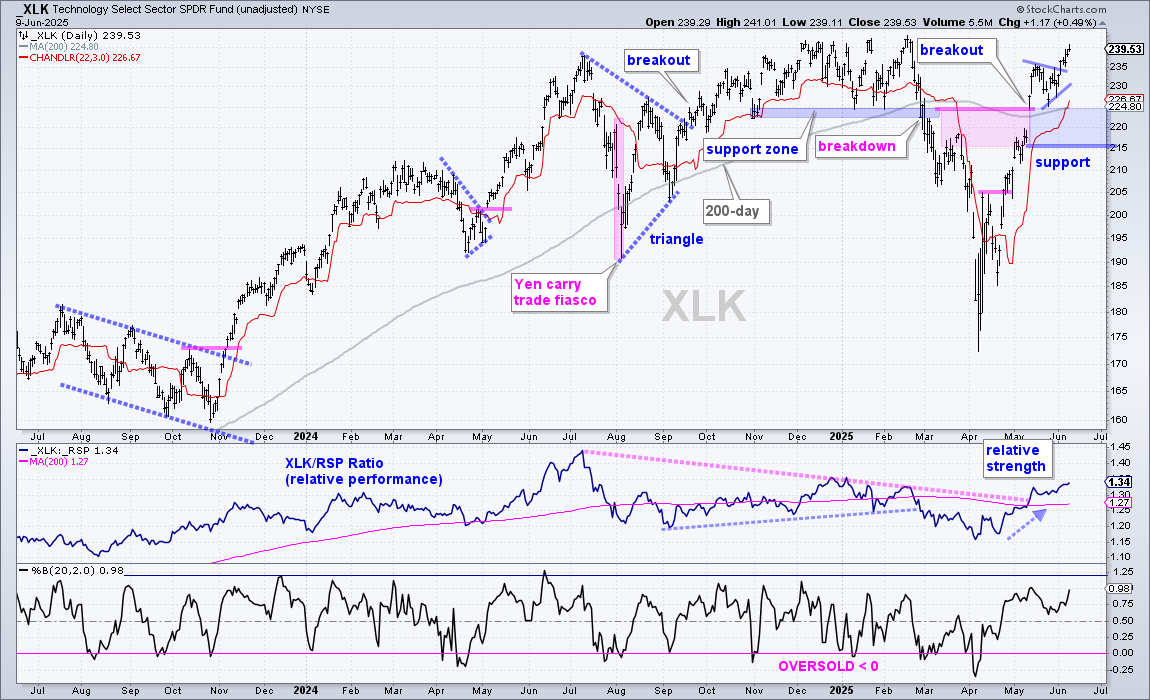
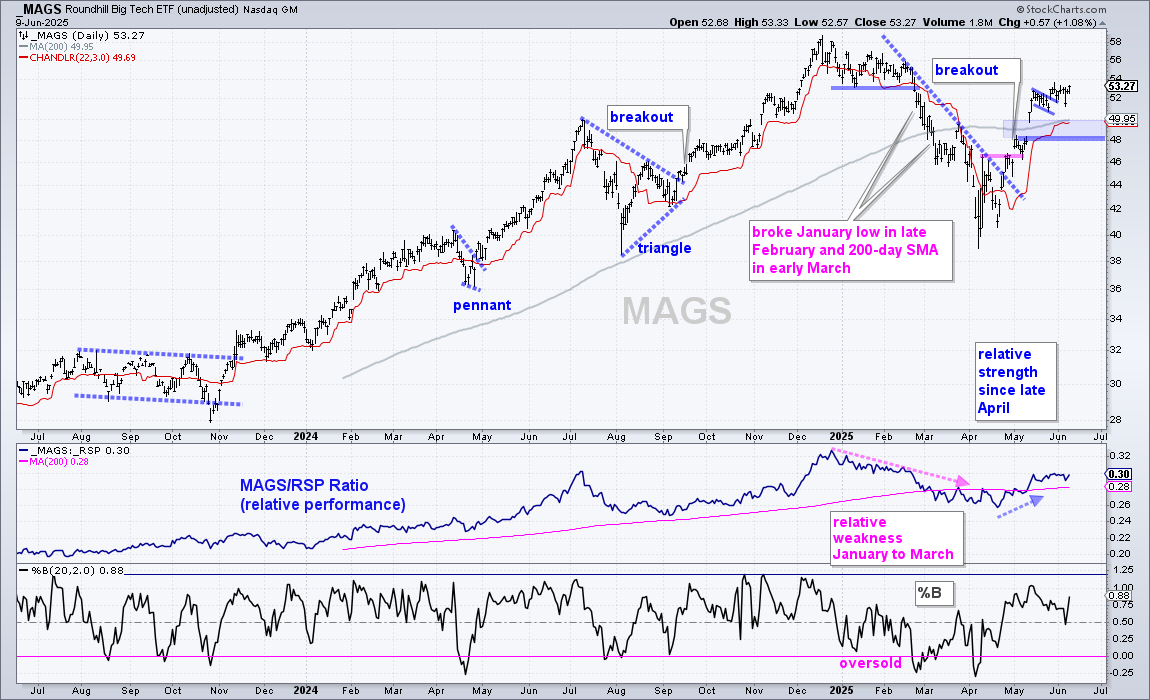
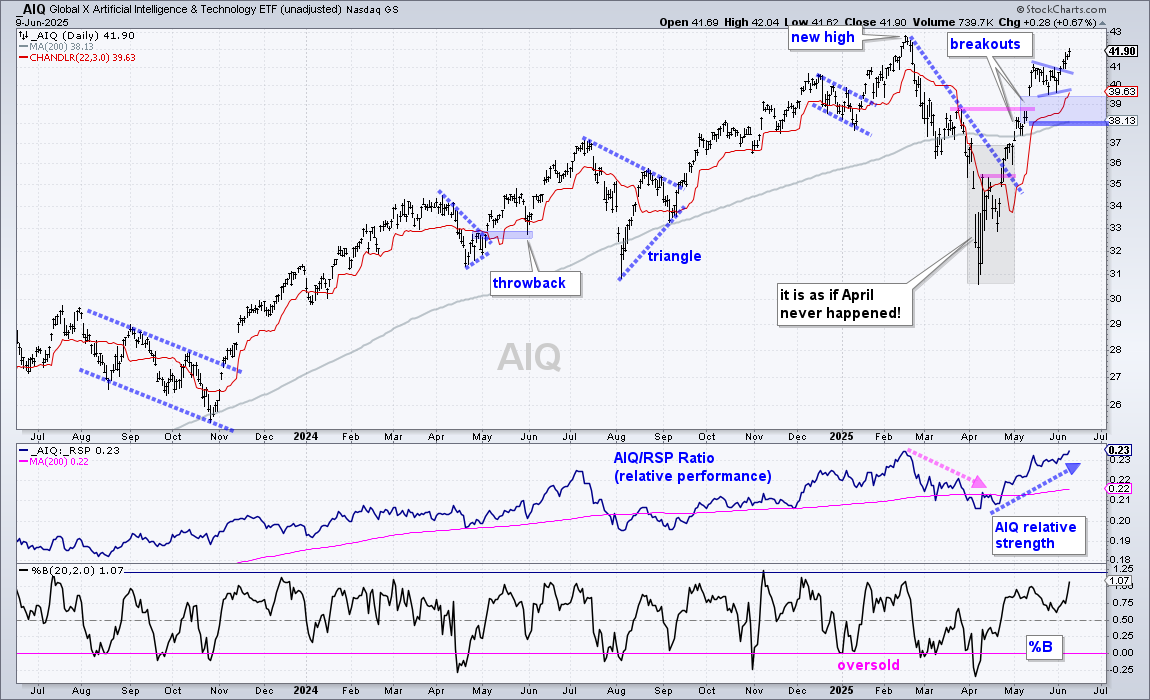
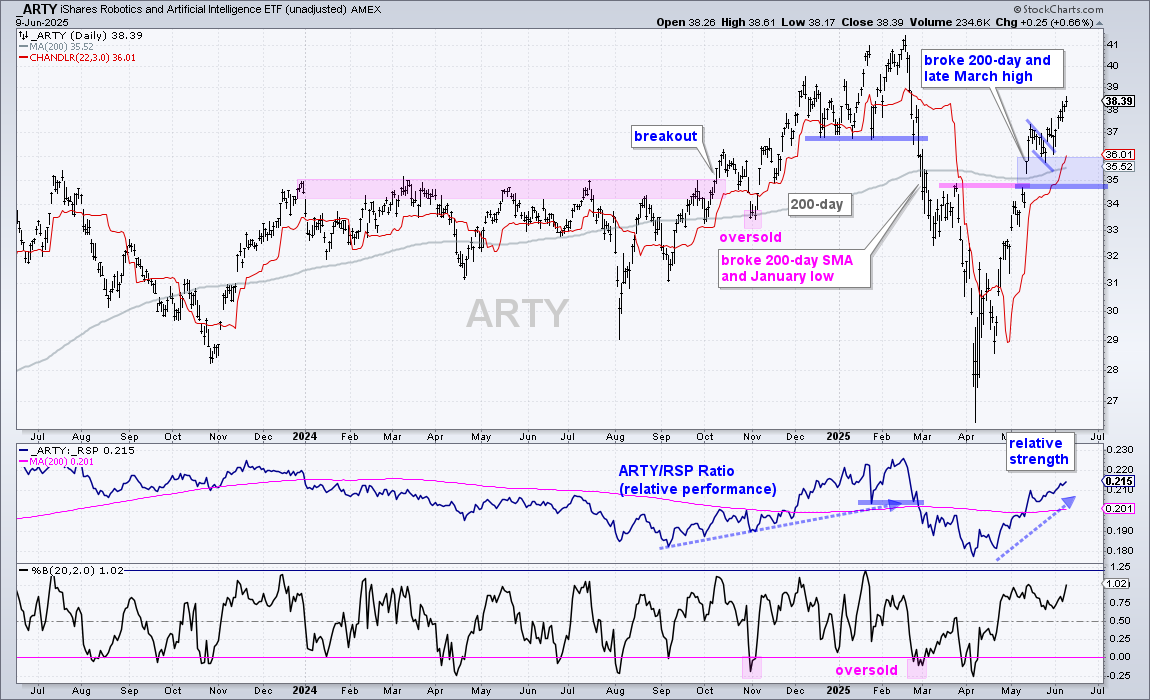
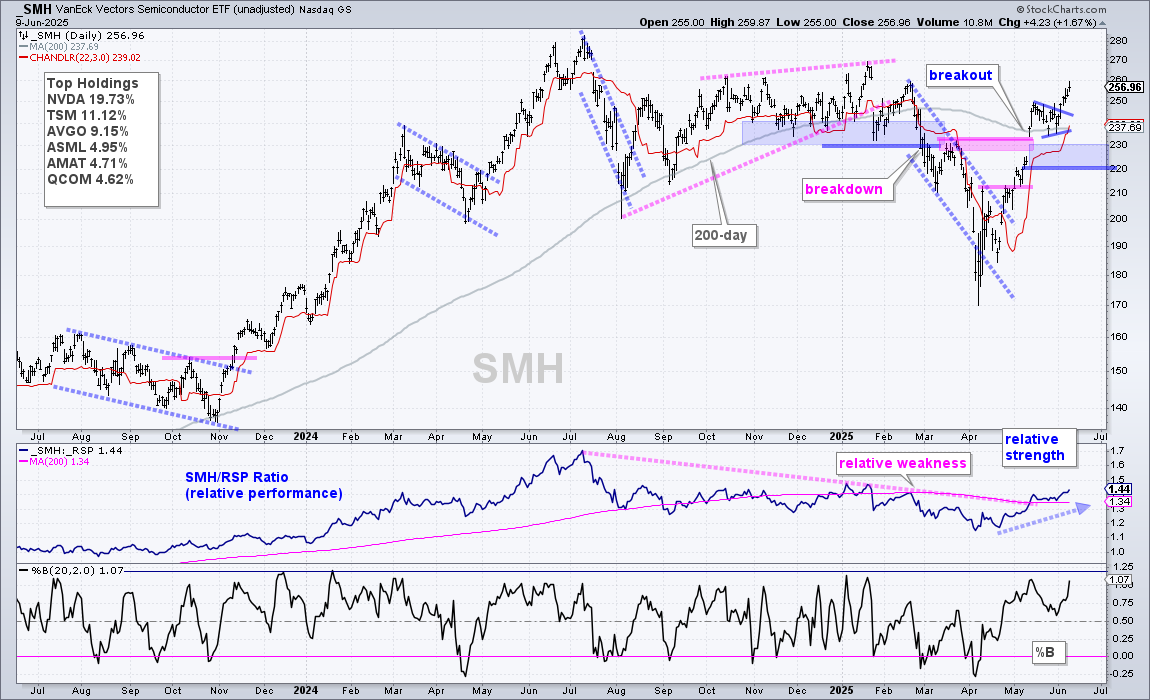
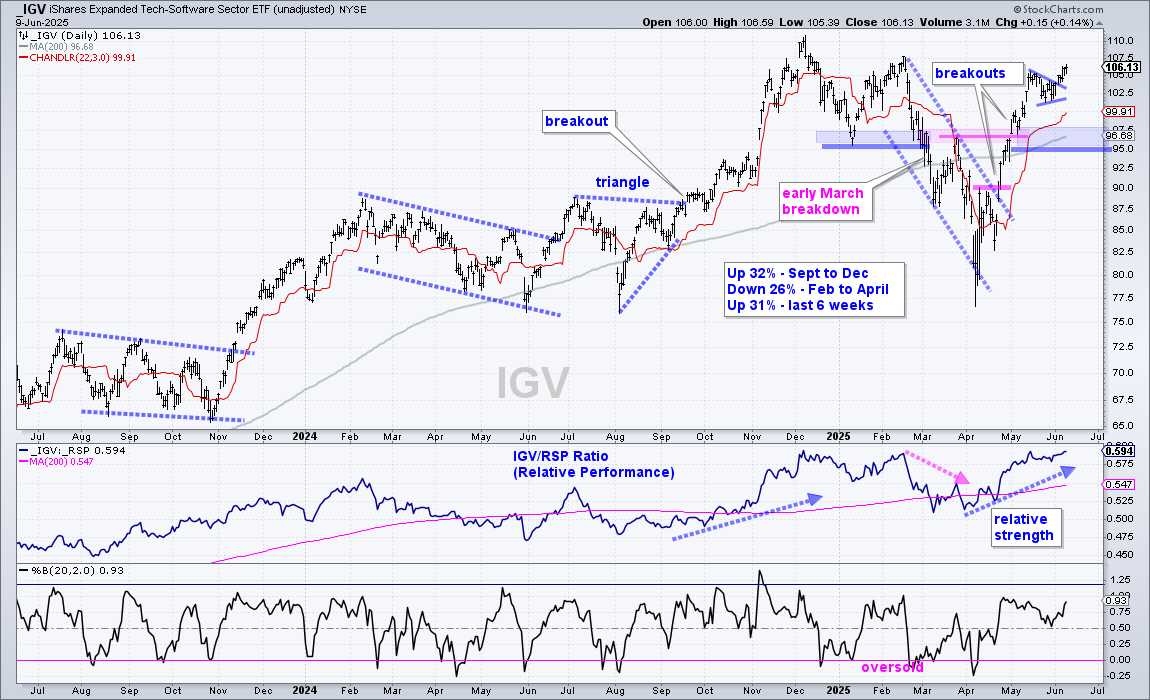
Last week I highlighted pennant patterns in several tech-related ETFs. The next charts show updates with the Chandelier Exit (22,3) added (red lines).
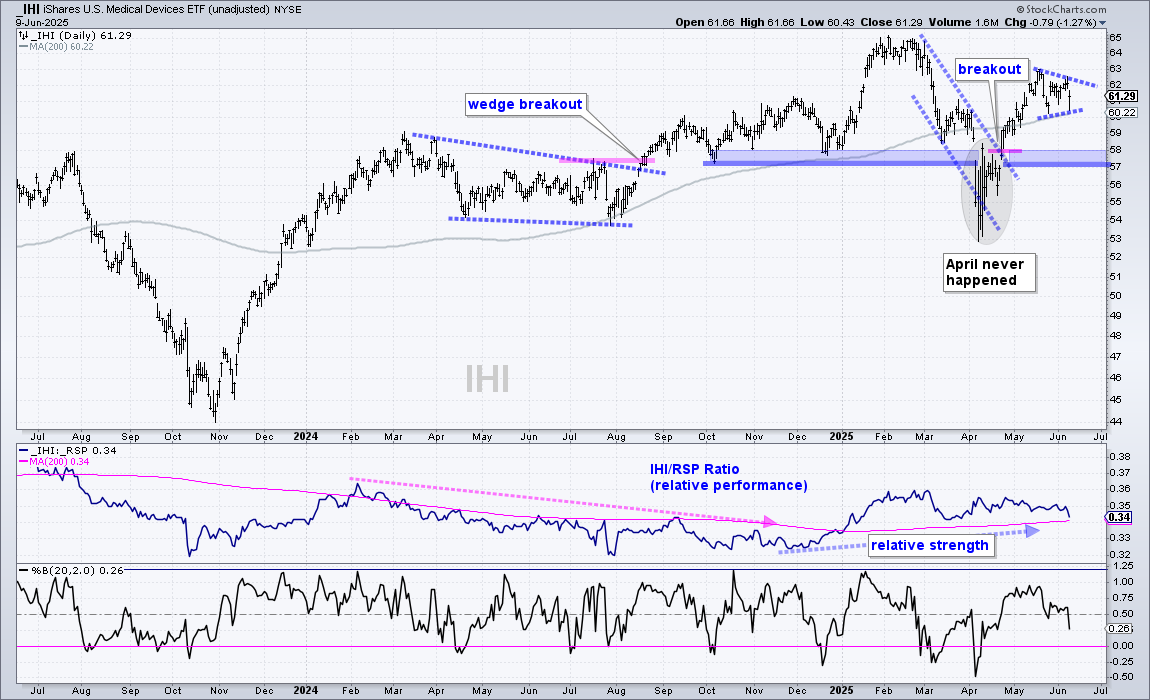
Medical Devices ETF Forms Pennant
The Medical Devices ETF (IHI) is in a long-term uptrend and forming a short-term pennant. IHI hit a new high in February and recaptured the rising 200-day SMA with the breakout surge in April-May. A pennant is taking shape in June as the ETF consolidates with a small contracting range. A breakout at 62.5 would signal a continuation higher.
Utilities SPDR Consolidates after Breakout
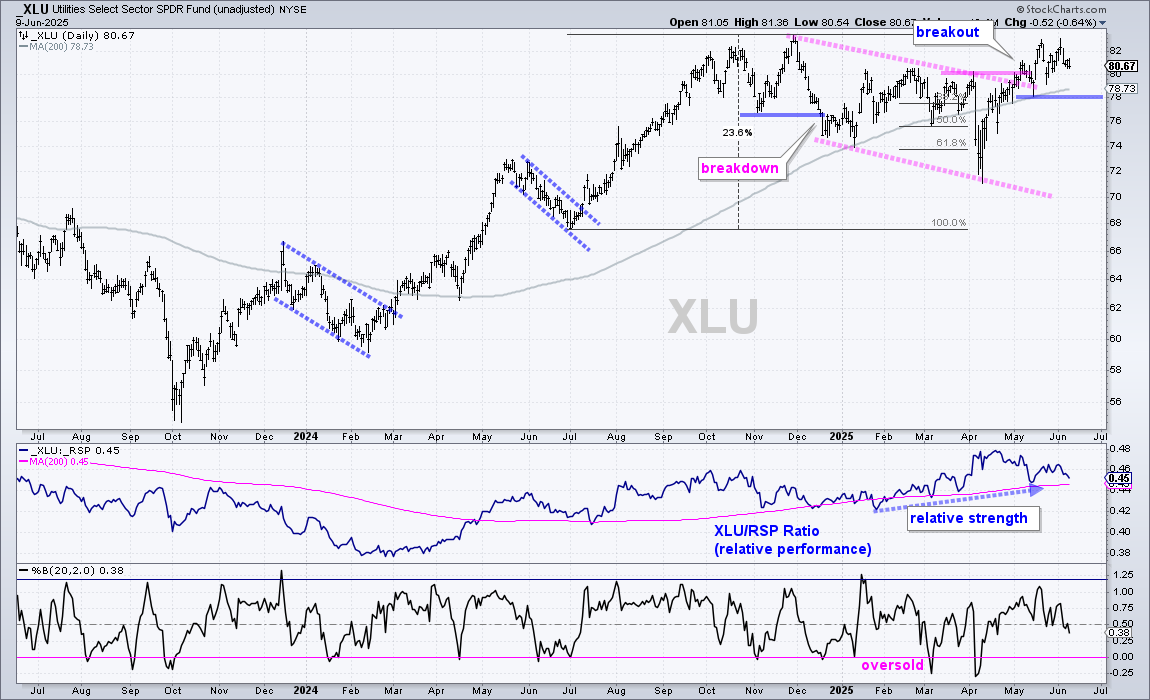
The Utilities SPDR (XLU) is holding its channel breakout and remains above the rising 200-day SMA. Overall, the ETF corrected with a falling channel from December to April and broke out in mid May. This breakout signals an end to the correction and a resumption of the bigger uptrend. The mid May low marks support at 78 and a break here would call for a re-evaluation. The middle window shows the price-relative (XLU/RSP ratio) turning up in February and rising the last few months. This ratio is above its 200-day SMA as XLU shows relative strength.
Consumer Staples SPDR Breaks Wedge Line
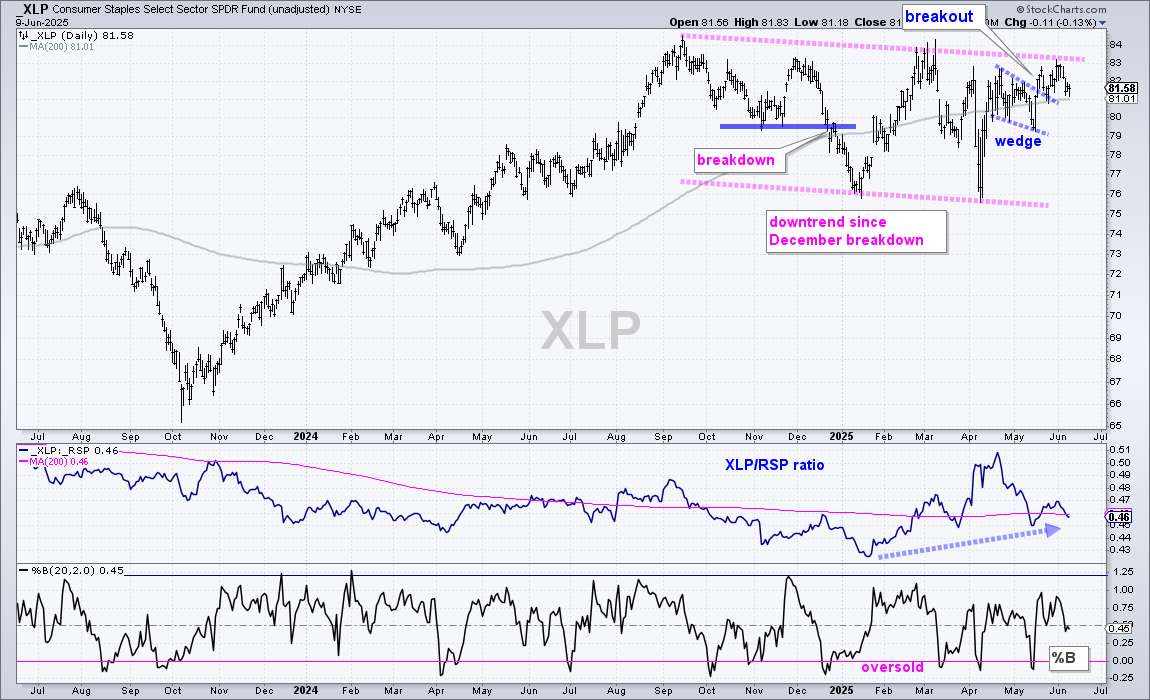
I am still following the Consumer Staples SPDR (XLP) as it broke out of a small wedge and challenged the channel trendline. Overall, XLP peaked in September and formed a falling channel the last six months. Even though this channel is falling, XLP is back above its rising 200-day SMA and less than 4% from a 52-week high. In addition, the ETF broke out of a small wedge in late May and is on the verge of a bigger channel breakout. The middle window shows the price-relative turning up in late May, but falling back below its 200-day in early June here. Watch for a move above .47 to signal a return to relative strength.
Insurance ETF Consolidates Near Resistance
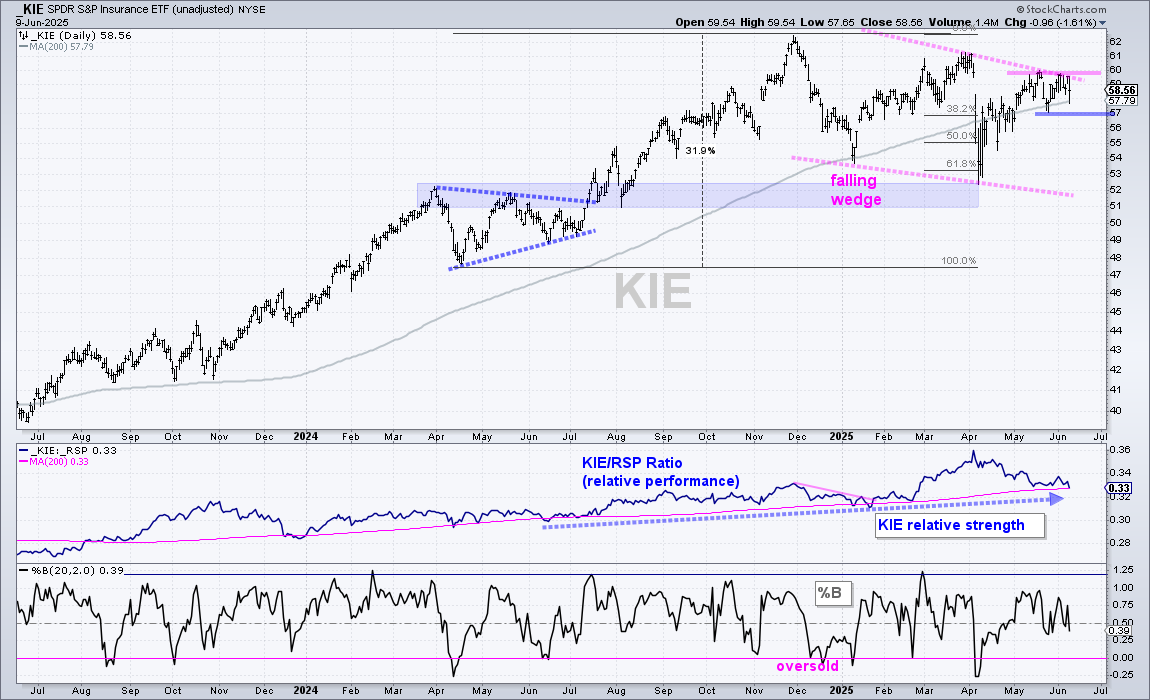
The Insurance ETF (KIE) is still on the verge of breaking wedge resistance to signal an end to the correction. KIE advanced 32% from April to November and then retraced 61.8% with a decline into early April. This decline also returned to broken resistance and support from the August low (blue shading). KIE bounced with the rest of the Market into late May and moved back above the rising 200-day SMA. Overall, I view the falling wedge as a correction and a breakout at 60 would be bullish. Support is set at 57 and a break here would reverse the upswing since early April.
Send feedback to support(at)trendinvestorpro.com or use the contact form.