Systematic Strategies and Next Level Technical Analysis
Market-ETF Report – Gold Miners Lead Gold – PALL Holds Upswing – ETHA Goes High and Tight
Arthur Hill, CMT
Archive
Charts
Use CRTL+P to Print
The next report will be on Wednesday, June 10th
Report Headlines
Commodity and Crypto Lead in 2025
7-10Yr TBond ETF Setting Up
0-30Yr TIPS Bond ETF Triangulates
Gold Challenges Flag Resistance
Silver Breaks Triangle Line
Gold and Silver Miners Surge to New Highs
Palladium ETF Holds Upswing/Uptrend
Platinum ETF Remains with Massive Breakout
Copper Goes for a Second Breakout
DB Agriculture ETF Consolidates after Wedge Breakout
Natural Gas ETF Hits Support Zone
Bitcoin ETF Pulls Back after New High
Ethereum ETF wins Volatility Prize
Stocks Extend on Thrust Signals
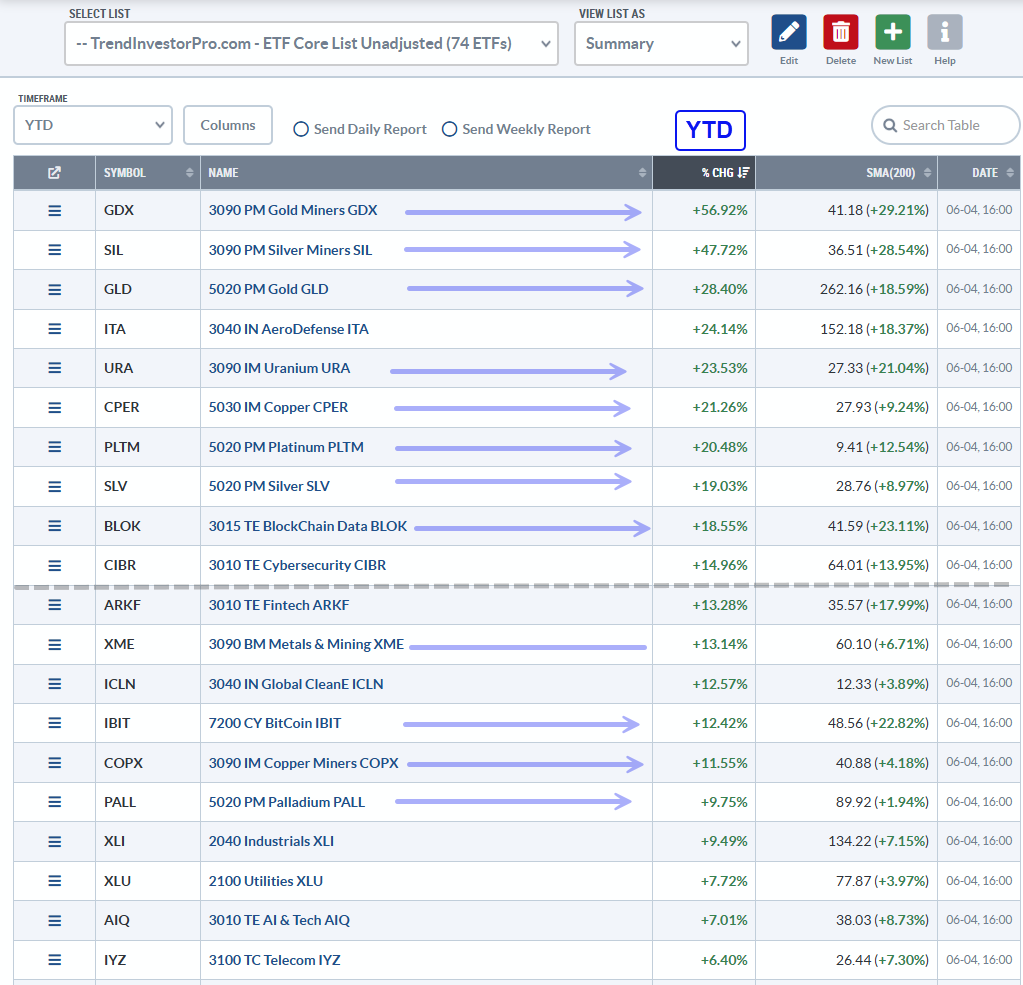
Despite the stock market surge from early April to early June, only a handful of stock ETFs are outperforming alternative asset ETFs. Commodity and crypto related ETFs account for twelve of the twenty year-to-date leaders in the all-weather ETF list, which has 74 ETFs. The year-to-date percentage change (YTD %Chg) is perfect for measuring performance because is encompasses the stock market swoon from late February to early April and the recovery into early June. For reference, SPY is up 1.99% year-to-date and QQQ is up 3.59%. ETFs up more than 5% year-to-date are leading.
The table below shows the top twenty year-to-date performers with the blue arrows highlighting commodity and crypto related ETFs. ETFs related to precious metals, uranium, copper and crytpo dominate the top ten. The Aerospace & Defense ETF (ITA) and Cybersecurity ETF (CIBR) were the only two equity ETFs to crack the top ten (gray dashed line). 2025 is turning into a year for hard assets (and crypto).
7-10Yr TBond ETF Setting Up
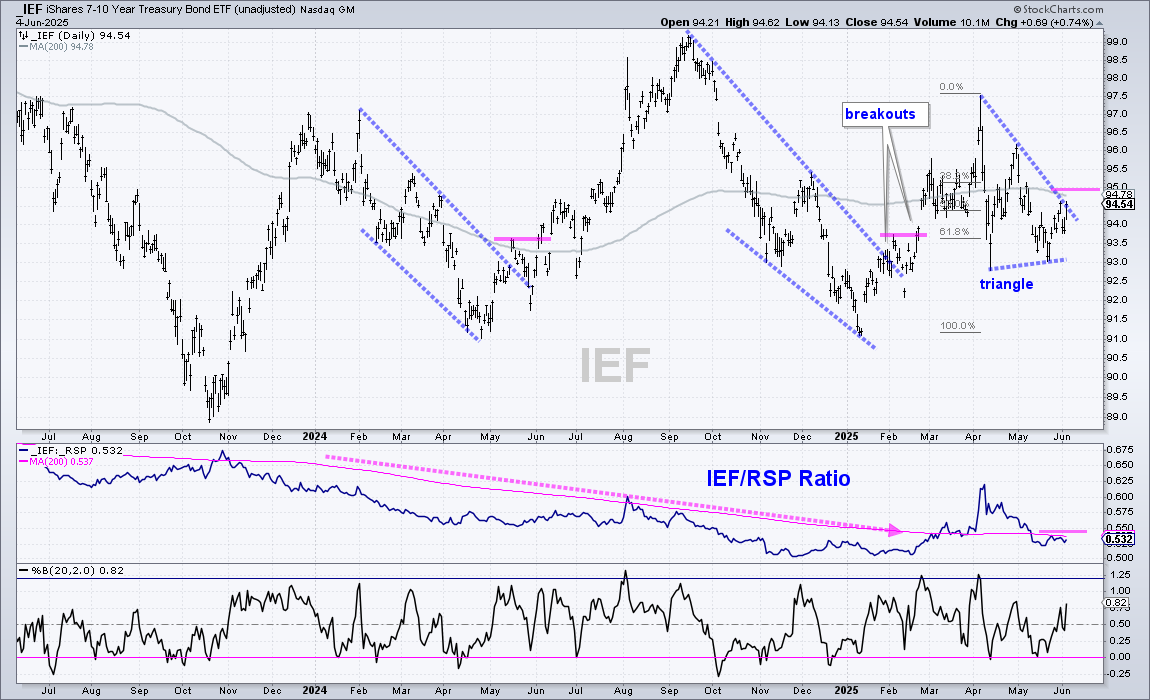
The 7-10Yr TBond ETF (IEF) surged in the first quarter and then corrected with a triangle into early June. This looks like a bullish continuation pattern and a breakout at 95 would signal a continuation of the Q1 surge. Also notice that the pullback into April-May retraced around 61.8% of the Q1 advance. The middle window shows the IEF/RSP ratio falling back below its 200-day SMA as bonds underperformed stocks the last two months. An upturn here would show a return to relative strength.
0-30Yr TIPS Bond ETF Triangulates
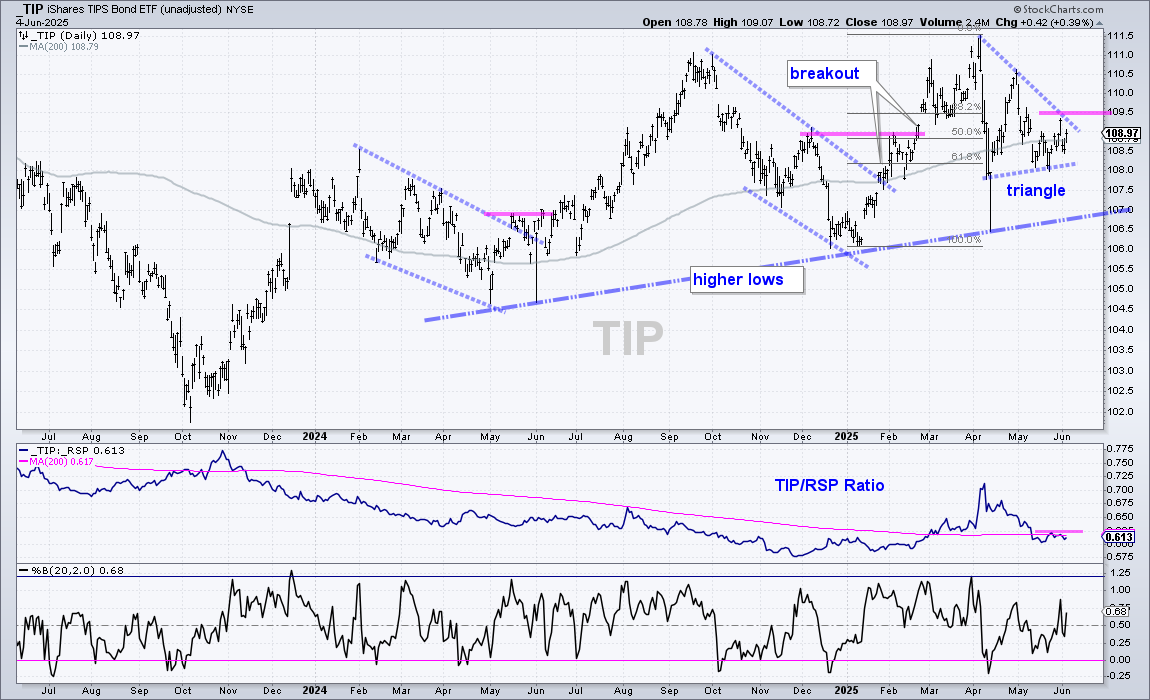
The next chart shows the 0-30Yr TIPS Bond ETF (TIP) with an uptrend since 2024. This is the inflation-protected bond ETF. Note the higher lows from April 2024 to April 2025 and the higher highs. Medium-term, TIP surged in Q1 and then corrected with violent price action in April-May. Ignoring the intraday spike to 106.5 on April 11th, I see a 61.8% retracement and a triangle taking shape. Thus, price action since April looks like a correction after the Q1 advance. A breakout at 109.5 would be bullish and I would then set re-evaluation support at 108.
Gold Challenges Flag Resistance
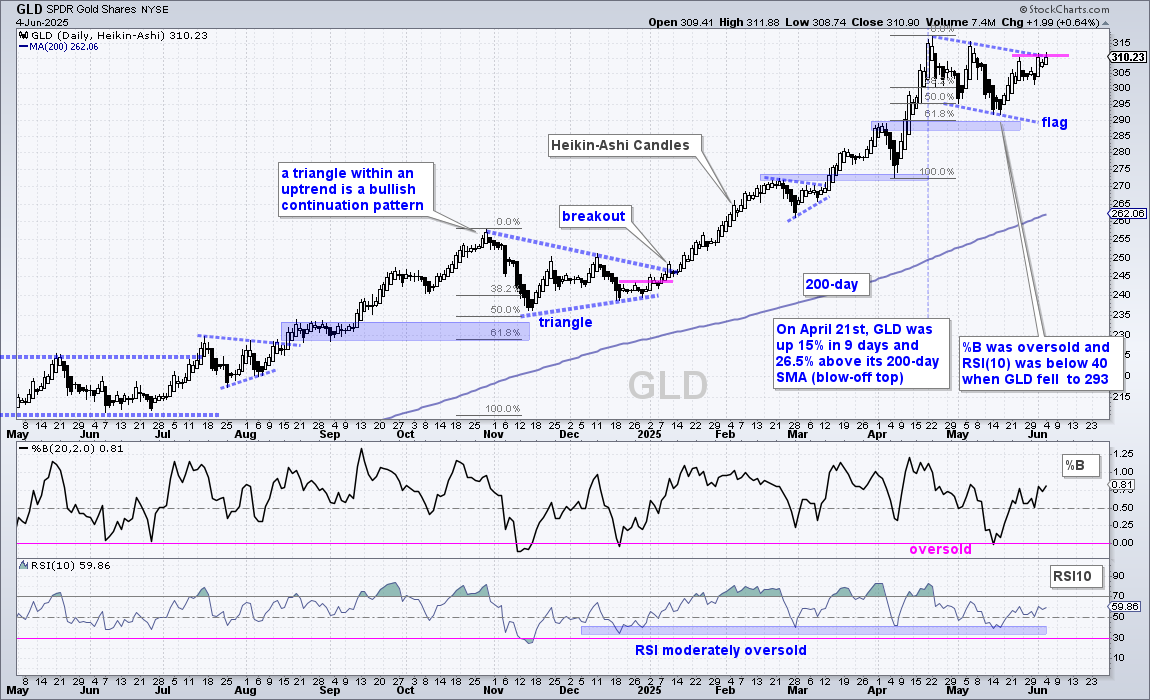
The Gold SPDR (GLD) remains in a long-term uptrend with a bull flag taking shape since early May. GLD became extremely overbought with the surge above 300 in mid April. The ETF worked off these overbought conditions with a correction that retraced around 61.8% of the prior advance and formed a falling flag. A flag within an uptrend is a bullish continuation pattern. GLD surged to the flag line and then consolidated the last two weeks. A breakout would signal a continuation higher and open the door to new highs.
Silver Breaks Triangle Line
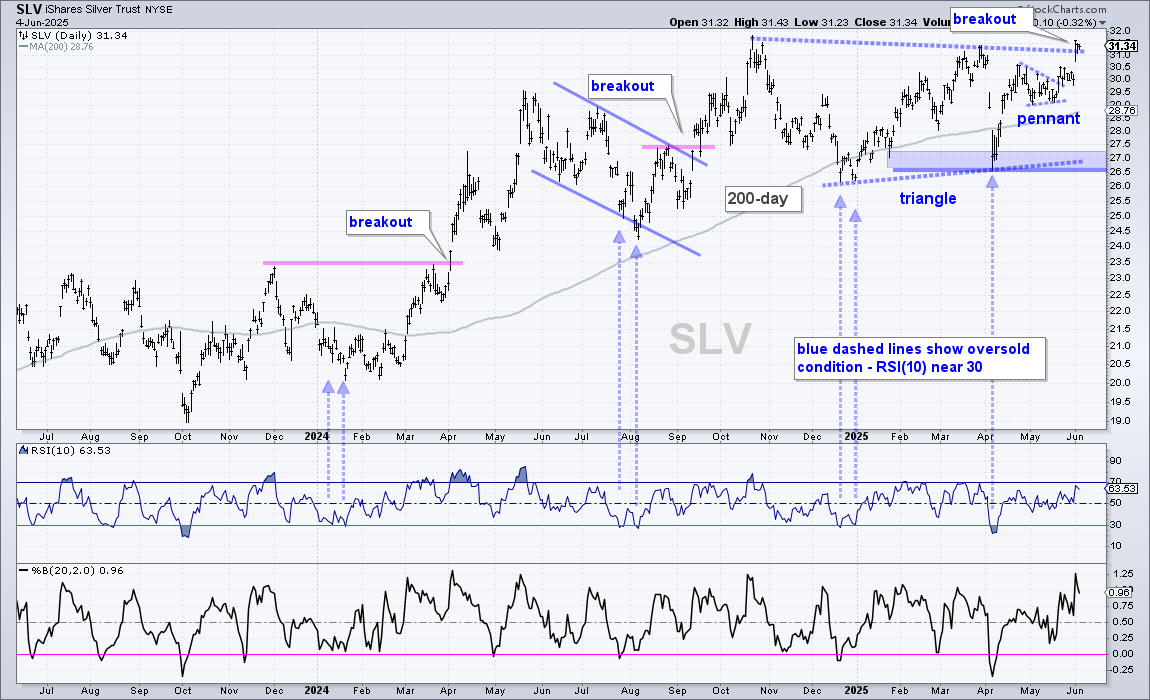
The Silver ETF (SLV) is taking the lead as it broke out of a pennant two weeks ago and broke the triangle line this week. Overall, SLV is in a long-term uptrend as it trades above the rising 200-day SMA. After hitting a new high in October, the ETF consolidated with a long triangle and this is a bullish continuation pattern. The triangle breakout signals a continuation of the bigger uptrend. Short-term, SLV surged in early April, formed a pennant and broke the pennant line two weeks ago. This was the early clue that SLV would make a run for triangle resistance.
Gold and Silver Miners Surge to New Highs
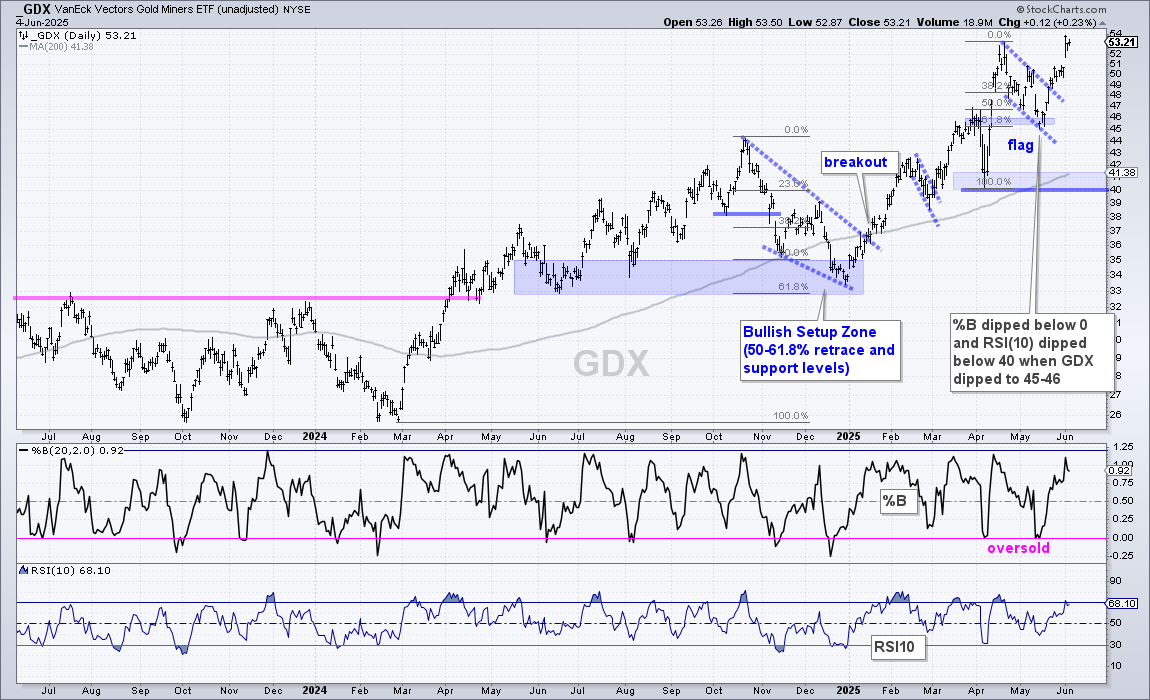
The Gold Miners ETF (GDX) is leading gold as it surges to a new high. As with gold, GDX surged to a new high in mid April and became very overbought. The ETF then corrected with a falling flag that retraced 61.8% of the April surge and led to an oversold condition (%B at 0). GDX broke out with a surge in mid May and continued higher into early June. There is no setup on this chart. It is simply in the trend-monitoring phase.
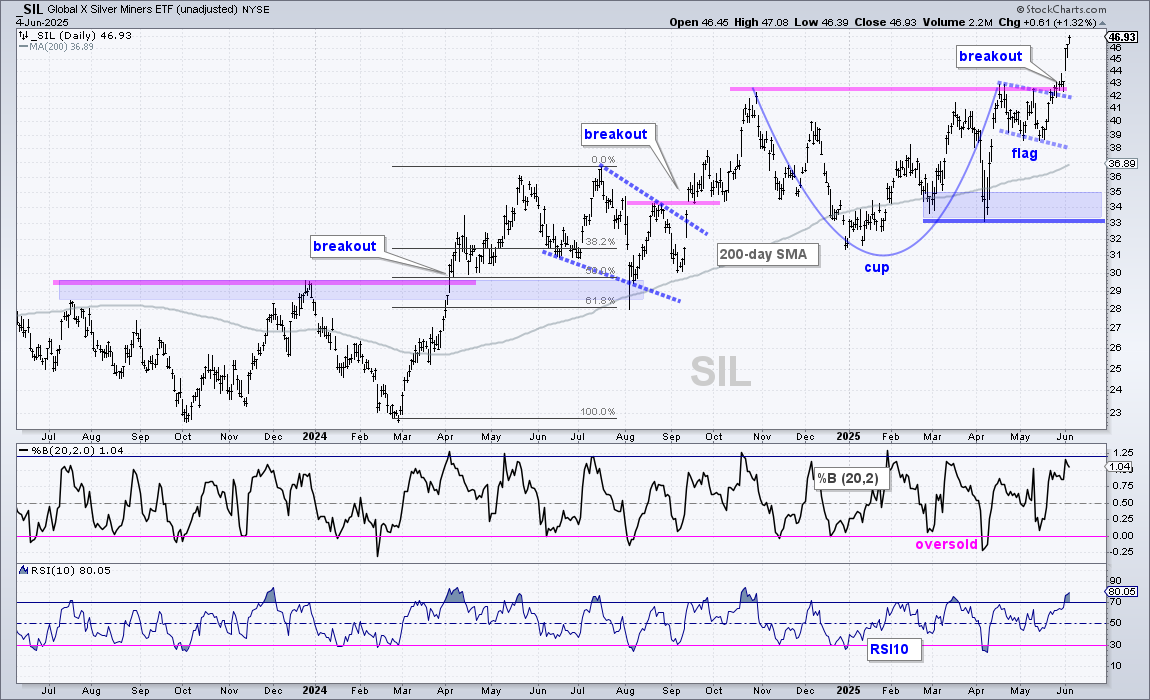
The Silver Miners ETF (SIL) shows price action similar to GDX with a surge, flag and breakout. SIL also formed a cup-with-handle from late October to late May. Popularized by William O’Neil of IBD, this is a bullish continuation pattern that forms within a bigger uptrend. SIL was above the rising 200-day SMA when the handle (flag) formed. The breakout signals a continuation of the long-term uptrend. Short-term, SIL is already overbought after a 20% gain in three weeks. Broken resistance in the 43 area turns first support should we see a throwback to the breakout zone.
Palladium ETF Holds Upswing/Uptrend
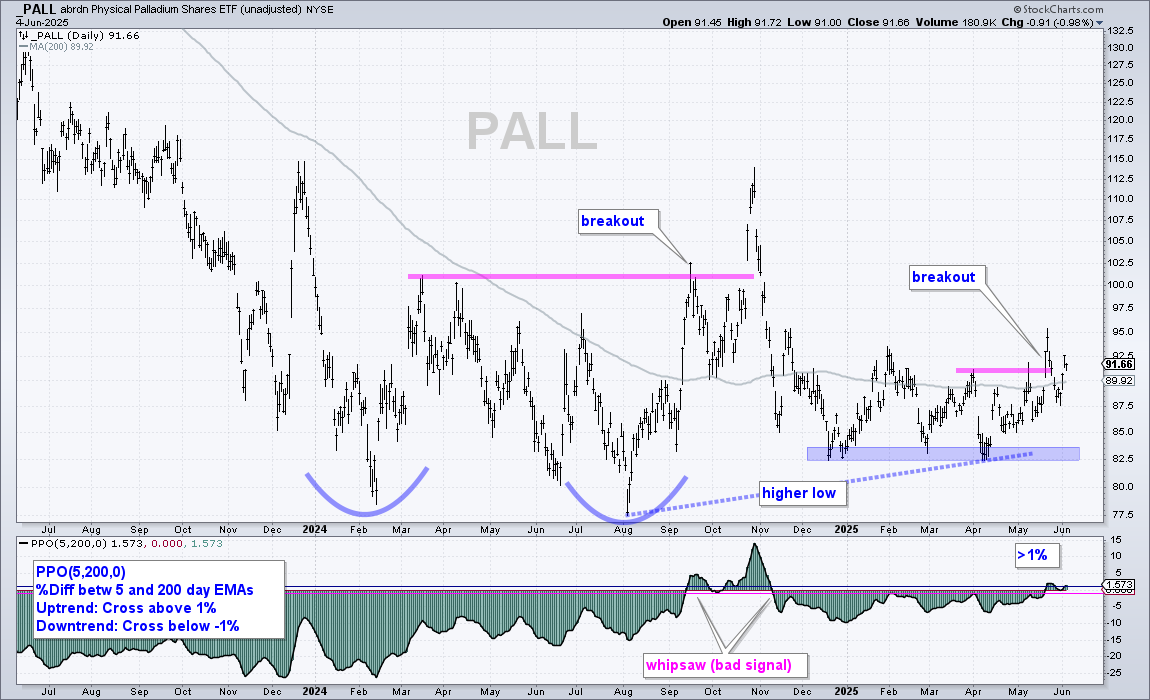
The Palladium ETF (PALL) recaptured its breakout this week and remains in a long-term uptrend. Overall, the ETF found support in the 77.5-80 area in 2024 and then support in the 82.5 area in 2025. This higher support zone in 2025 means buying pressure came in at higher prices, which is bullish. PALL consolidated from January to mid May and then broke out with a surge to 95. After falling back below the breakout zone last week, the ETF resumed its upswing this week. The indicator window shows the PPO(5,200,0) moving above +1% in late May to signal an uptrend. This signal remains valid until a cross below -1%.
Platinum ETF Remains with Massive Breakout
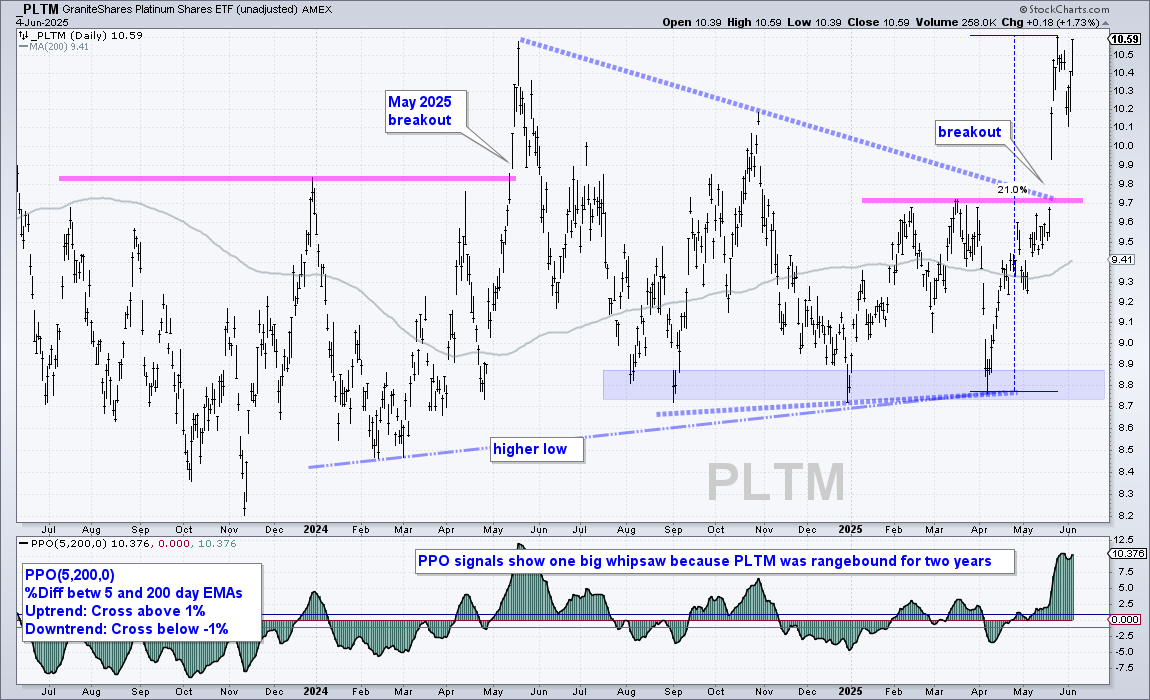
The Platinum ETF (PLTM) triggered a massive breakout with the 21% surge above 9.7% in mid May. As with PALL, PLTM formed a higher low from early 2024 to early 2025. There was a clear resistance level at 9.7 and PLTM blew through this. After a short three day pullback to 10.2, the ETF surged again this week and is trading at new highs in pre-market price action on Thursday.
Copper Goes for a Second Breakout
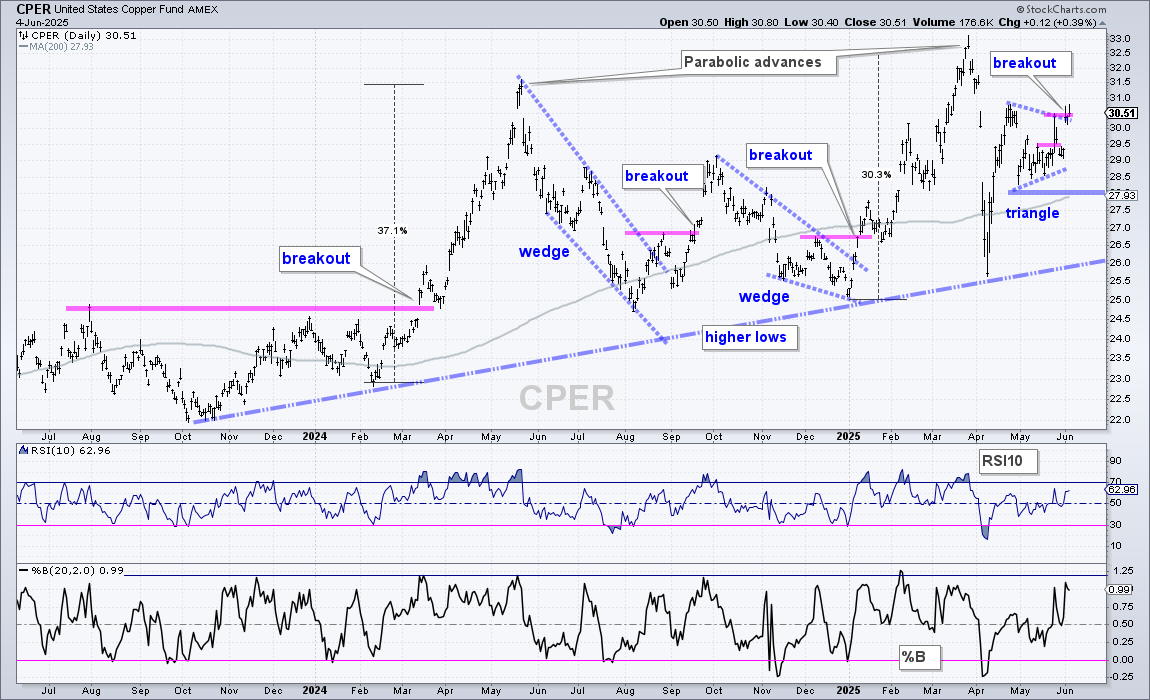
The Copper ETF (CPER) is in a long-term uptrend and on the verge of a short-term breakout. Long-term, CPER shows higher lows extending back to October 2023 and higher highs with the two parabolic advances. Short-term, CPER surged in mid April, consolidated into May with a triangle and surged to triangle resistance this week. Technically, CPER broke the late May high so I am calling this a breakout. Re-evaluation support is set at 28.
DB Agriculture ETF Consolidates after Wedge Breakout
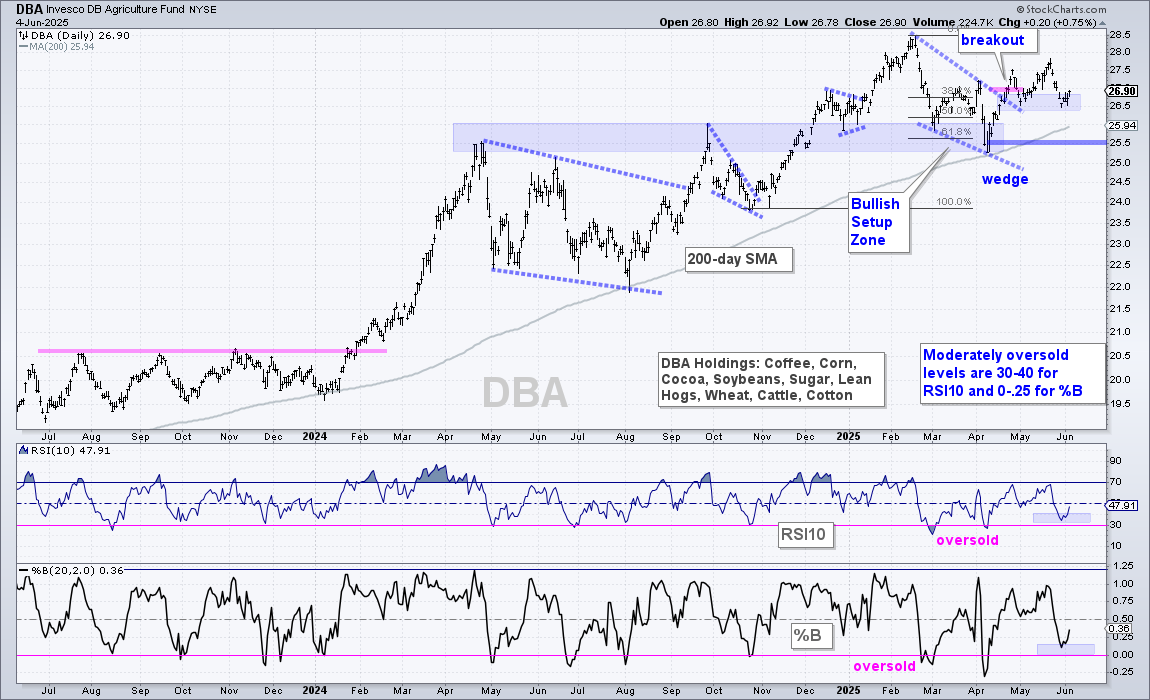
The DB Agriculture ETF (DBA) remains in a long-term uptrend and with a wedge breakout in late April. Even though DBA has done little since this breakout, the long-term uptrend and breakout remain in play. The breakout zone around 26.5 turns support and the two momentum oscillators became moderately oversold this week. %B is oversold below 0 and moderately oversold in the 0-.25 area. RSI(10) is oversold below 30 and moderately oversold in the 30-40 area. Thus, we have a short-term setup for DBA.
Overall, DBA hit a new high in February and has held the rising 200-day SMA for well over a year. After the February high, the ETF corrected with a falling wedge that retraced 61.8% of the prior advance and returned to the breakout zone (blue shading). This was a typical correction. The subsequent breakout signaled an end to the correction and a resumption of the bigger uptrend.
Natural Gas ETF Hits Support Zone
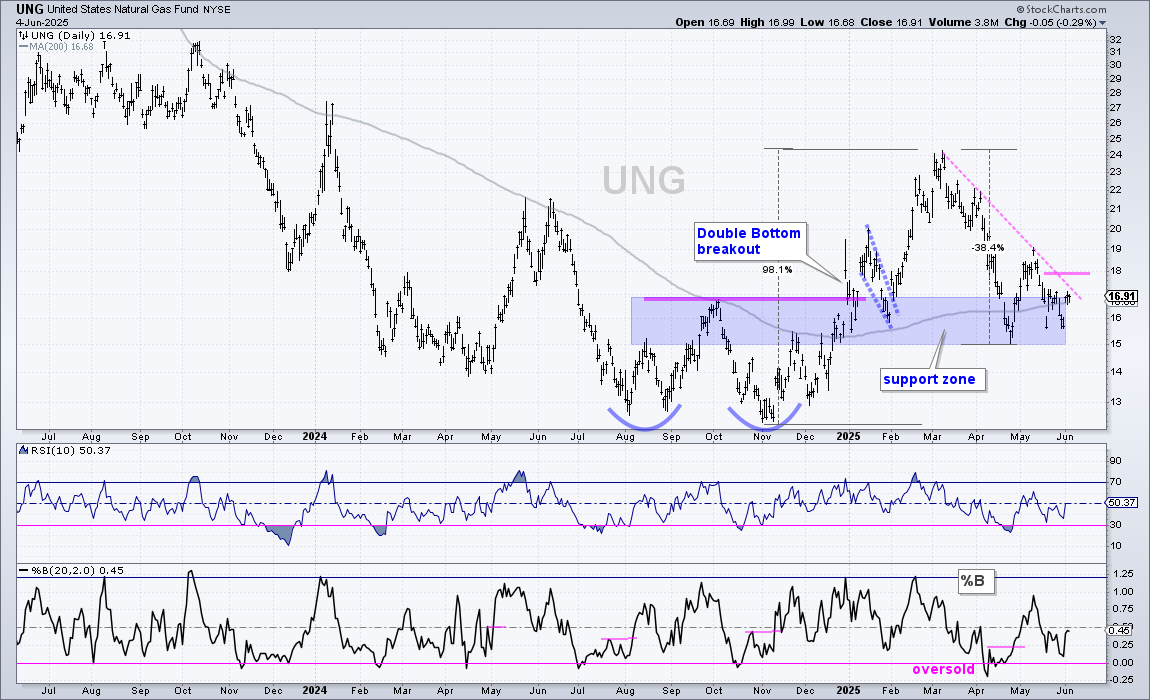
The Natural Gas ETF (UNG) continues to test the support zone in the 15-17 area (blue shading). Overall, I see an uptrend on this chart with the Double Bottom breakout, higher lows from November to April and a rising 200-day SMA. UNG returned to the breakout zone and 200-day with the decline into April. The short-term trend since March is down, but the ETF is attempting to firm in this support zone. A breakout at 18 would reverse the short-term downtrend.
Bitcoin ETF Pulls Back after New High
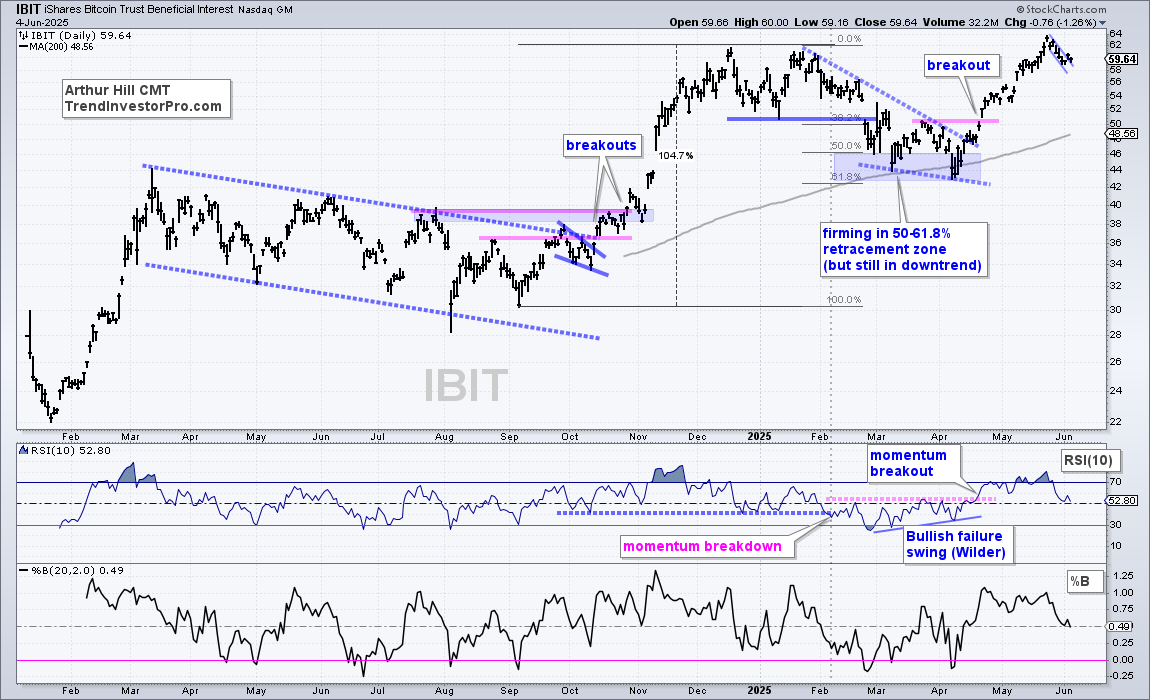
The Bitcoin ETF (IBIT) remains in a long-term uptrend with a new high in late May, and price well above the rising 200-day SMA. The last medium-term setup was the falling wedge into early April and the breakout in late April. IBIT is in the trend-monitoring phase right now, which means I do not see a setup. There is a short five day pullback into early June and a breakout on Tuesday, but this pattern is too short-term for my style. It is time to wait and watch.
Ethereum ETF wins Volatility Prize
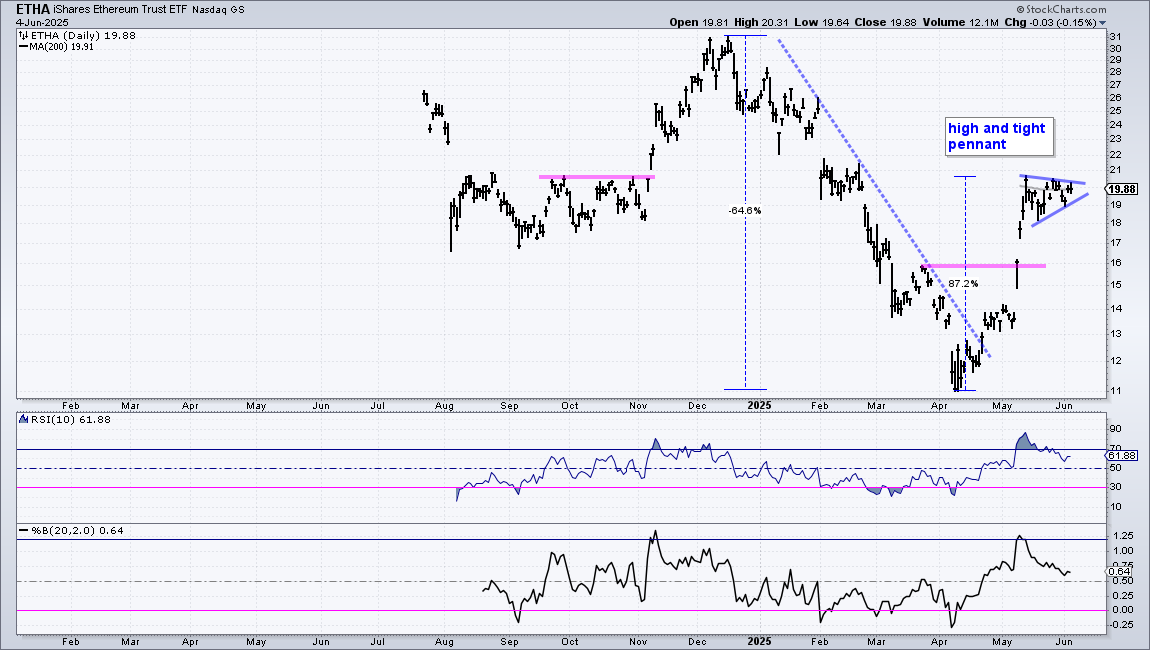
Before looking at the Ethereum ETF (ETHA), note that it has the highest Standard Deviation in my 74 ETF universe. I am using the annualized 21-day Standard Deviation of log changes. Here are the ETFs with the highest Standard Deviations: ETHA(81%), UNG(60%), ARKG(48%), GDX(44%), BLOK(44%), TAN(43%), SIL(42%), URA(39%)…IBIT(29%). Keep this in mind because the higher the Standard Deviation is, the more risk!
The chart below shows ETHA falling from 31 in December to 11 in April and then surging to the 20 area. That’s down 65% and up 87%, all within a six month window. Short-term, ETHA is forming a high and tight pennant, which is a short-term bullish continuation pattern. The ETF became overbought after the mid April surge and this pennant alleviated the overbought conditions. A breakout at 20.5 would be bullish and a signal a continuation higher. A strong breakout should hold so I would set re-evaluation support at 19.
Send feedback to support(at)trendinvestorpro.com or use the contact form.