Systematic Strategies and Next Level Technical Analysis
ETF Report – Tech ETFs Extend on Market Leading Rally – More Flag/Pennant Breakouts
Arthur Hill, CMT
Archive
Charts
Use CRTL+P to Print
The next report will be on Wednesday, July 2nd.
Vacation Notice
Note that I will be taking some time off in early July for a family vacation (July 7th to 18th). There will be no written reports or videos during this period. I will, however, update the Broad Breadth Model, Signal Pages and Ranking tables (Saturdays). I will also issue an alert if there is a major change between updates.
Report Headlines
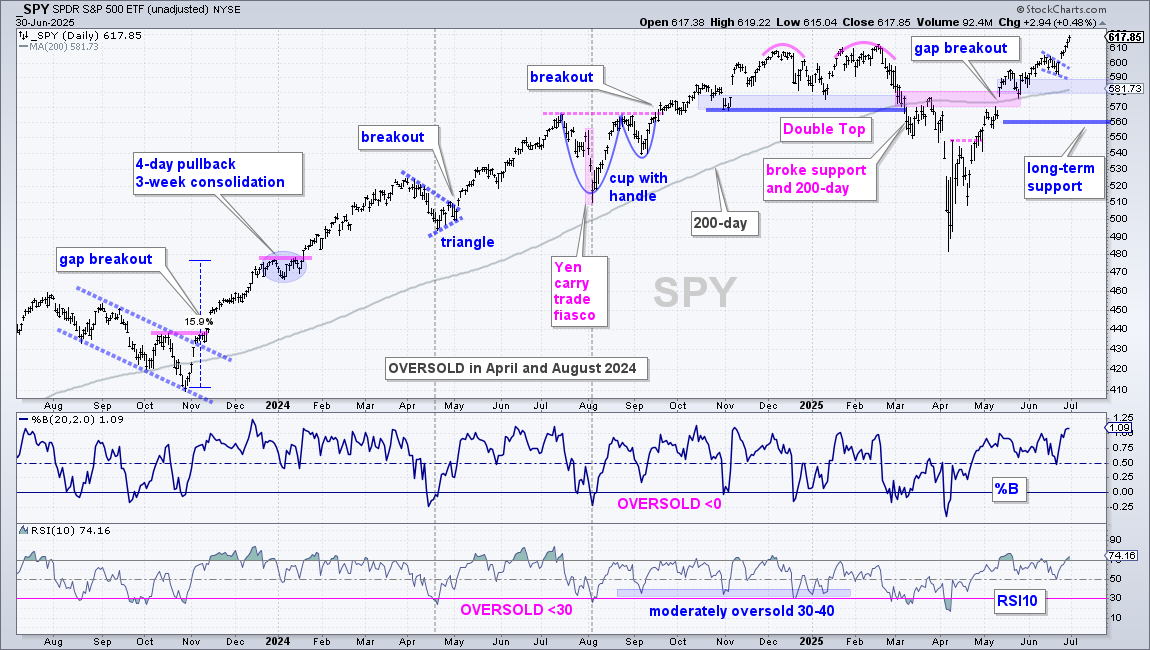
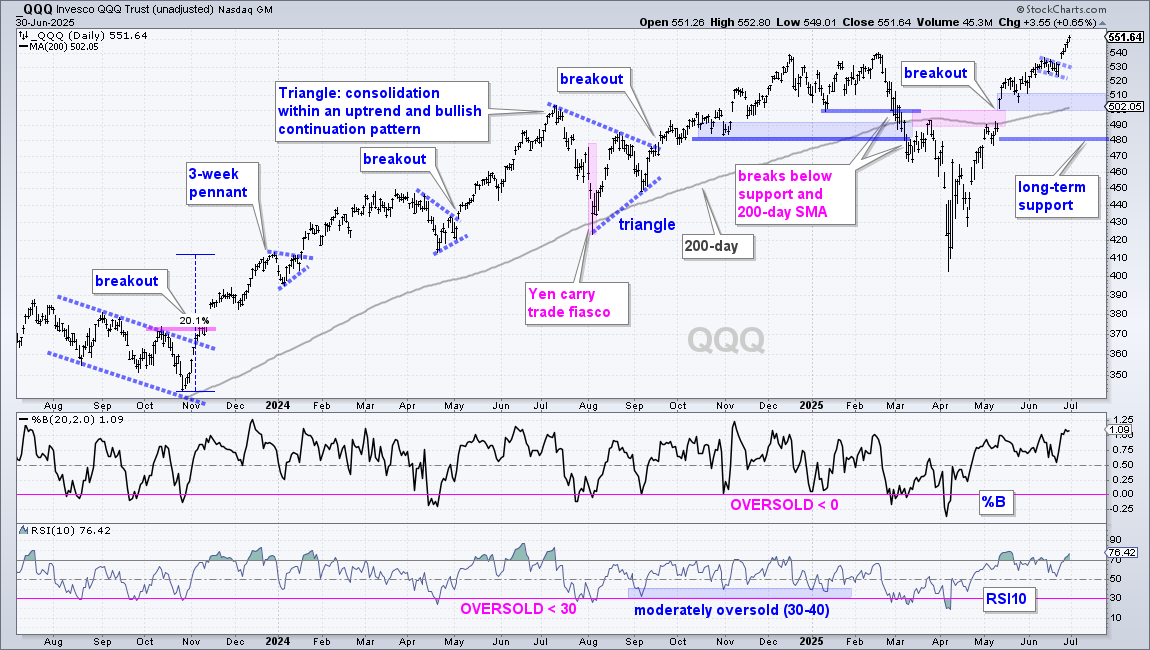
SPY and QQQ Extend to New Highs
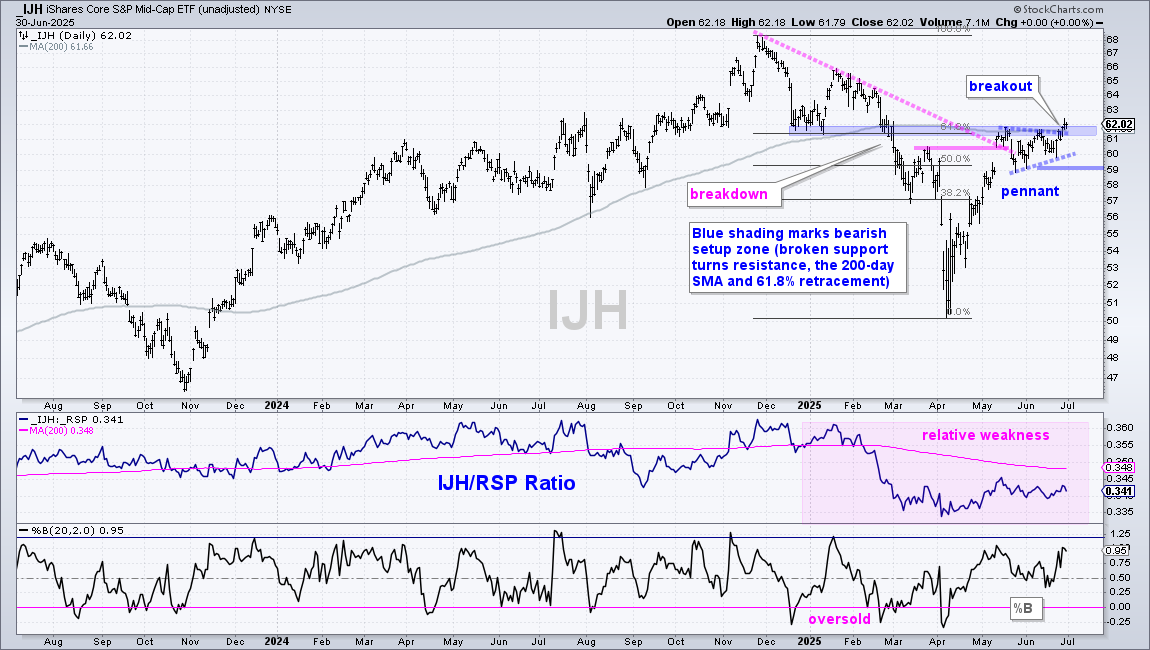
Mid-cap ETF Breaks Out, but Still Lags
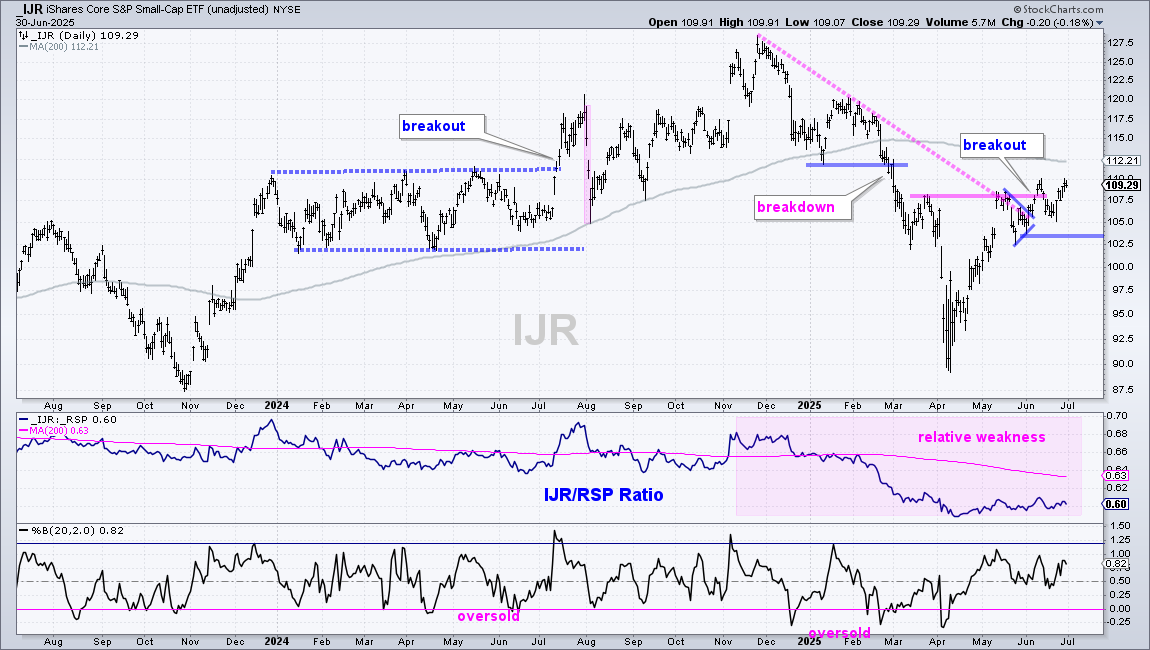
Small-cap ETF Maintains Upswing
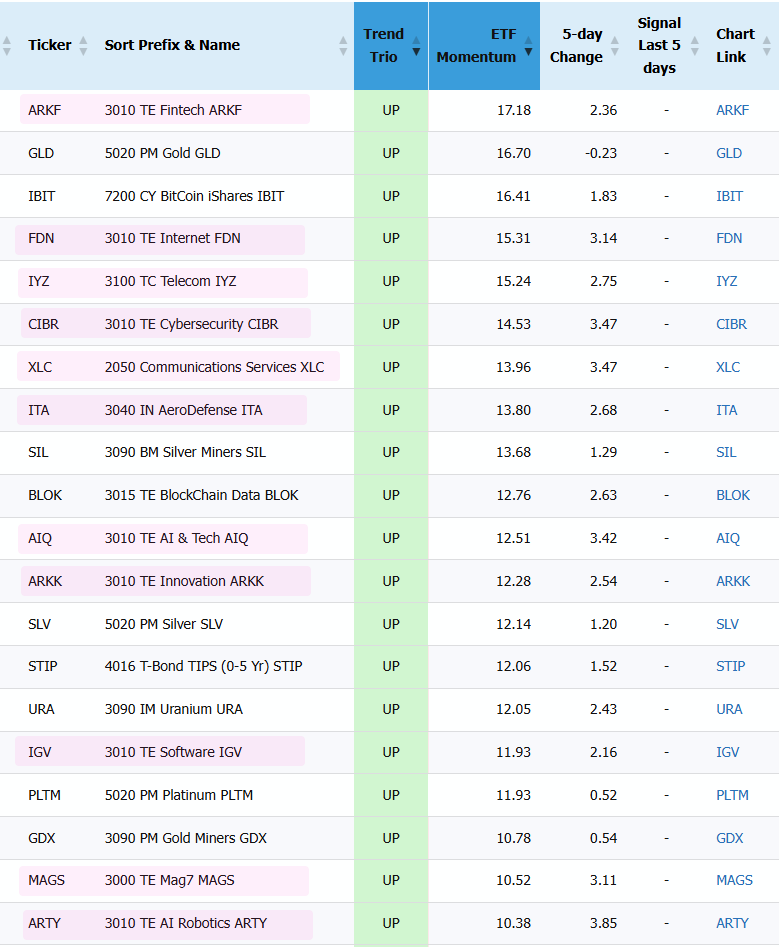
13 Equity ETFs in Top 20 (mostly tech related)
Tech-Related ETFs Extend on Breakouts (Chandelier Exits)
Finance and Bank ETFs Break Out (plus Insurance)
Medical Devices ETF Breaks Flag Line (plus XLY)
Telecom and BlockChain Break Out to New Highs
Homebuilders ETF Breaks Pennant Line and Leads ITB
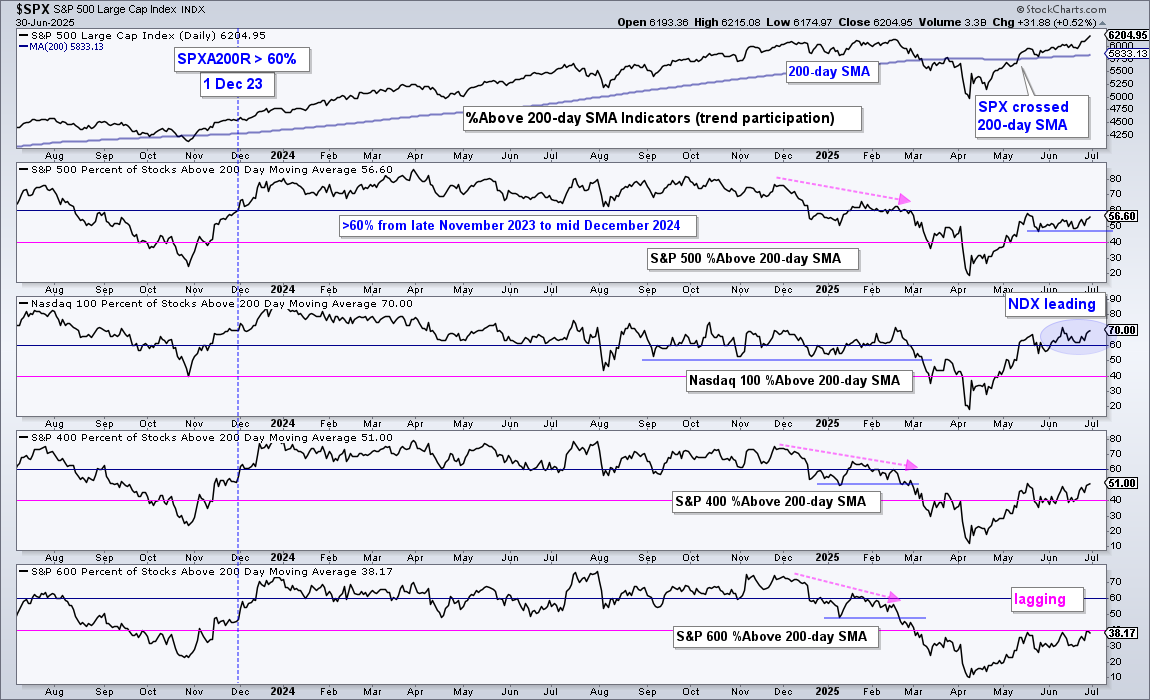
NDX Breadth Leads
Large-caps and tech stocks continue to lead the market with SPY and QQQ notching new highs. The Technology SPDR, Communication Services SPDR and Industrials SPDR also hit new highs, and the Finance SPDR is not far off. The leaders consolidated in late May and broke out in early June. We then saw consolidations form in the next group during June and breakouts in late June. In particular, the S&P MidCap 400 ETF broke out of a pennant, which suggests that the rally in broadening.
However, we have yet to see a significant broadening in the long-term breadth indicators. Namely, 56.6% of S&P 500 stocks are above their 200-day SMAs (44.4% below) and just 47.73% of S&P 1500 stocks are above their 200-day SMAs. There is a bull market somewhere, just not in mid-caps and small-caps yet. Mid-caps and small-caps outnumber large-caps, which is why the breadth indicators are lagging.
Technical Event Timeline
March 13th – Bearish Long-term Breadth and Trend Indicators
There is no change with SPY as it extends higher after the big breakout in mid May and the pennant breakout last week. SPY turned long-term bullish with the gap-breakout on May 12th. This move pushed SPY above the 200-day SMA and signaled a long-term uptrend. I am marking long-term support at 560 (blue line). A close below 560 would erase the gap-breakout, break the 200-day SMA and reverse the long-term uptrend.
Short-term, SPY became overbought with the move above 600 in mid June and worked off this condition with a pennant pullback below 600. A small pennant formed and SPY broke out with a gap last Tuesday, June 24th. A pennant after an advance is a short-term bullish continuation pattern and the breakout led to new highs the last few days.
SPY is in the trend-monitoring phase now because there is no setup and the ETF is a bit extended after a 3% gain the last five days. It is time to let it ride and wait for the next setup. I am marking pullback support in the 580-590 area (blue shading).
The QQQ chart shows similar characteristics. Long-term support is set at 480 for QQQ (blue line). A close below this level would fill the gap and break the 200-day SMA.
Short-term, QQQ surged from early April to mid June and then formed a falling flag last week. This is a short-term bullish continuation pattern, known as a high and tight flag. Last week’s breakout signaled a continuation higher and opened the door to new highs. Should QQQ pull back, I would watch the 500-510 area for potential support and an oversold condition (blue shading).
IJH Breaks Out, but Still Lags
The S&P MidCap 400 SPDR (IJH) surged to a bearish setup zone in mid May, consolidated with a pennant and broke out last week. The blue shading marks this bearish setup zone, which is a resistance level and area to expect a counter-trend bounce to fail. Instead of failing, IJH broke out of the pennant and this signals a continuation of the April-May surge. The pennant lows mark support in the 59-60 area and a close below 59 would call for a re-evaluation. Even though MDY broke out, it is still lagging SPY and QQQ – by a wide margin.
Small-caps Maintain Upswing
Even though the S&P SmallCap 600 SPDR (IJR) remains well below its falling 200-day SMA, the short-term trend is up (early April to June). Most recently, a small pennant formed into early June and IJR broke out with a surge to 110. After a dip to the 105-106 area in mid June, the ETF rebounded last week with a move back above 109. The pennant breakout is still holding with a support zone in the 103-105 area. A close below 103 would reverse the short-term uptrend.
11 Equity ETFs in Top 20 (mostly tech related)
The table below comes from the ETF Rotation Strategy. See this page for more details and the complete ranking table. I am only showing the Trend Trio, ETF Momentum and 5-day Change columns. First, I just want to make sure the ETF is in an uptrend (Trend Trio). I then sorted by ETF Momentum to show the leaders. 11 of the top 20 are equity ETFs (pink shading). Note that I am excluding ETFs related to commodities and crypto, such as GDX and BLOK. Of the equity leaders, 9 tech-related ETFs are in the top 20 (ARKF, FDN, CIBR, XLC, AIQ, ARKK, IGV, MAGS, ARTY). Leadership within the stock market is very concentrated. Elsewhere, there is leadership in telecom (IYZ) and Defense (ITA).
Tech-Related ETFs Extend on Breakouts (Chandelier Exits)
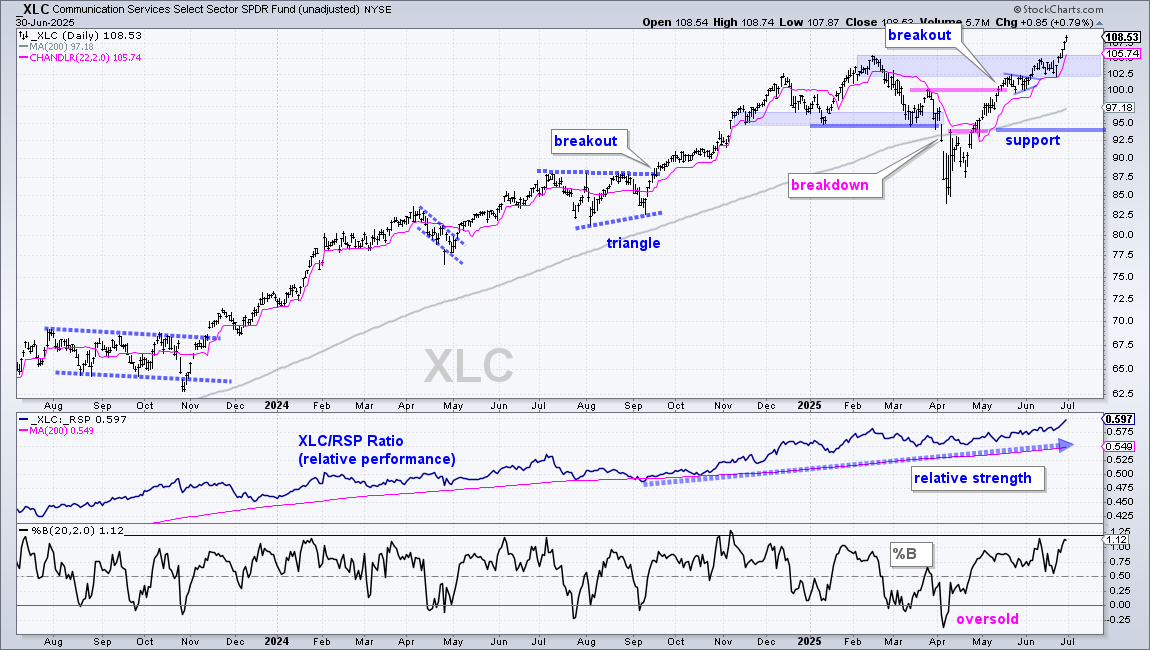
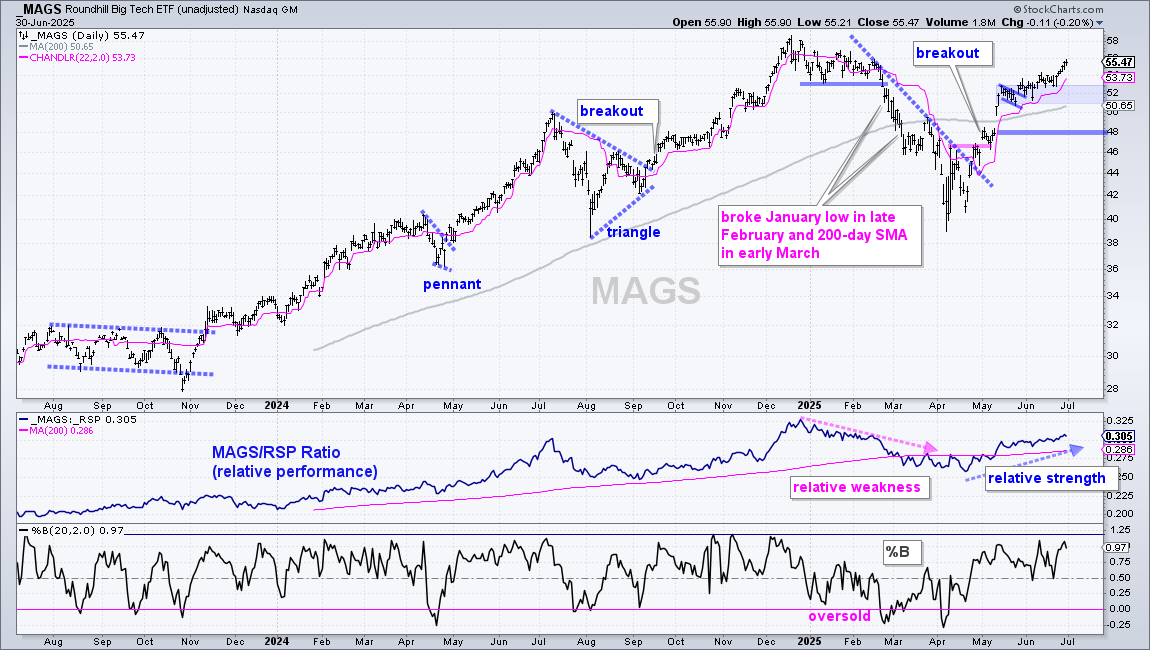
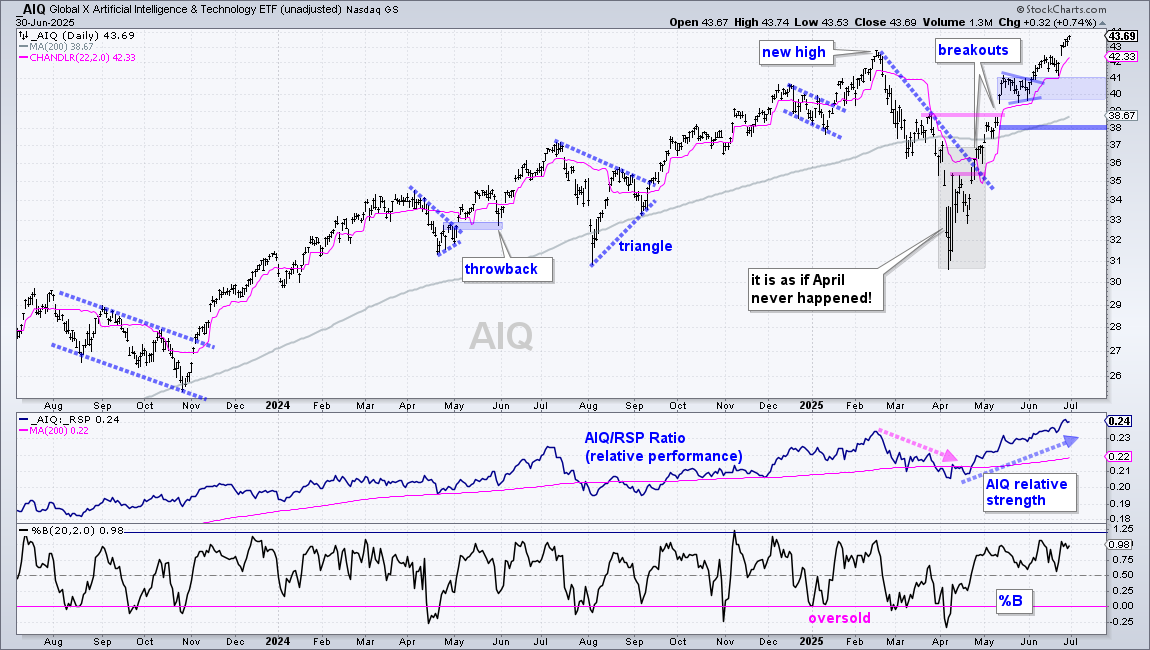
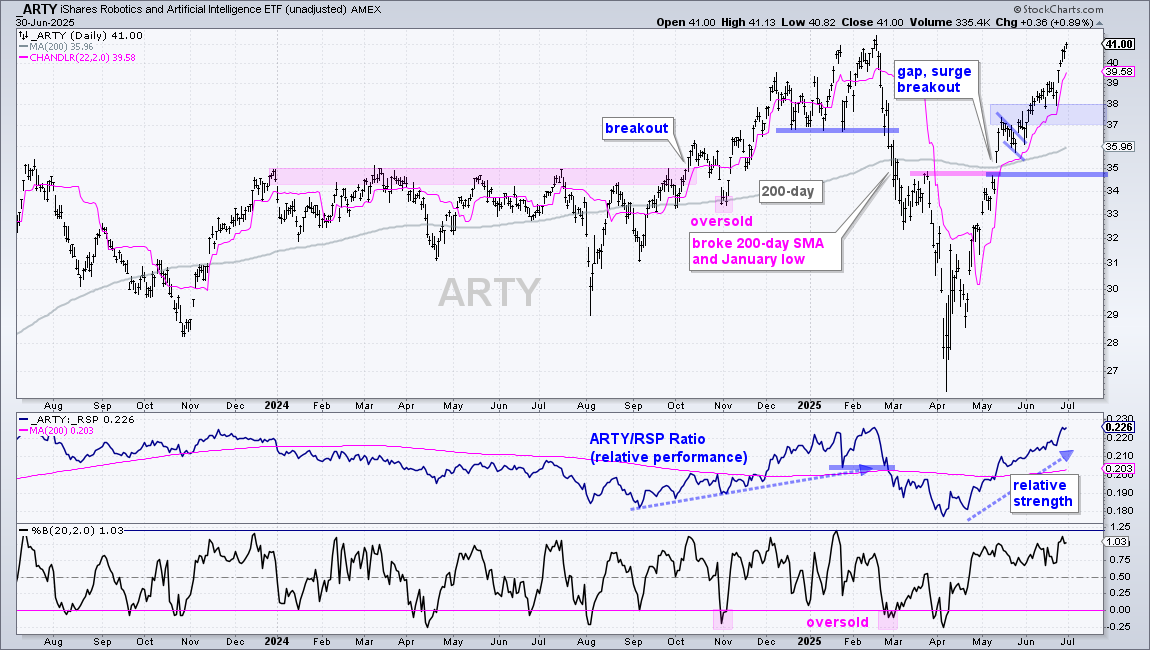
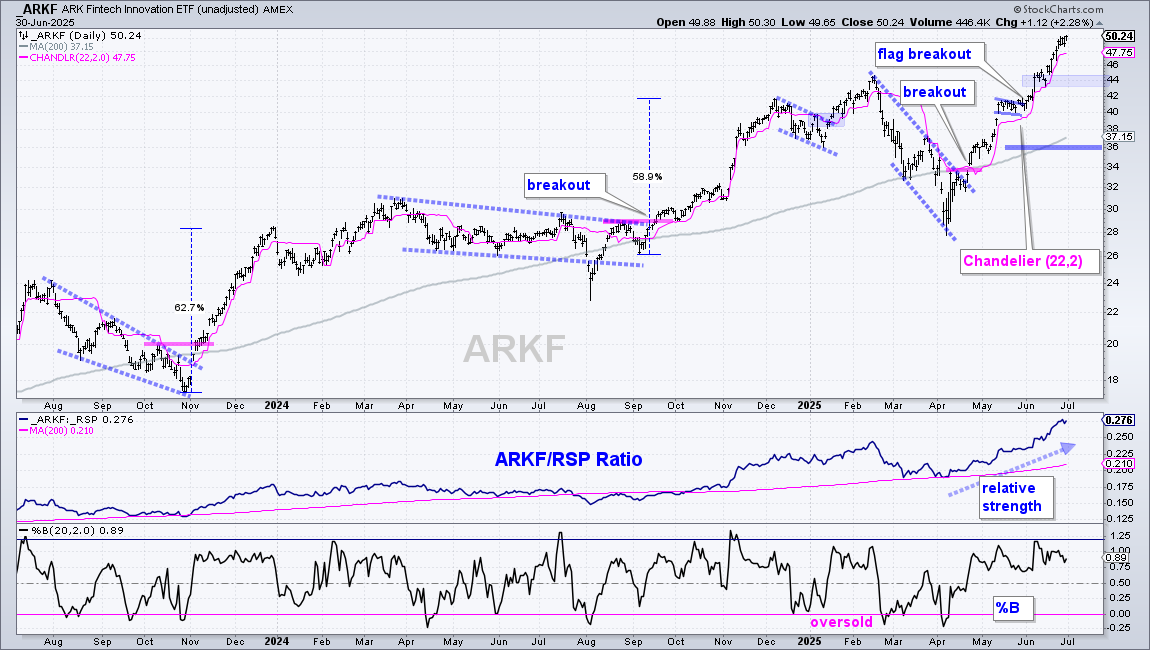
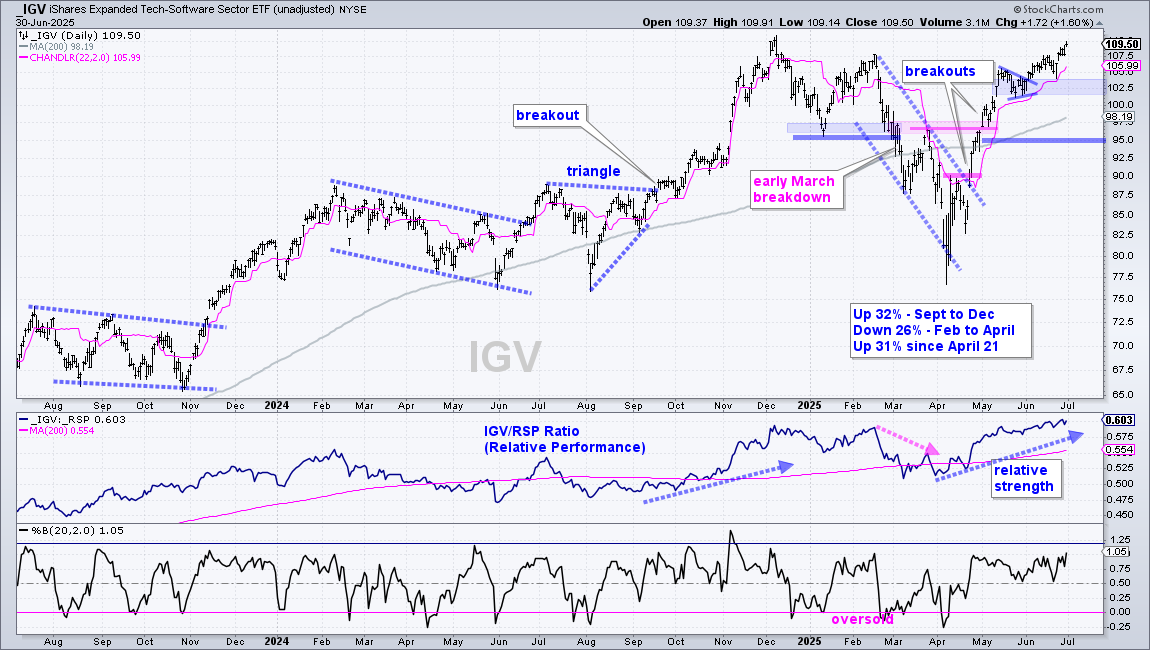
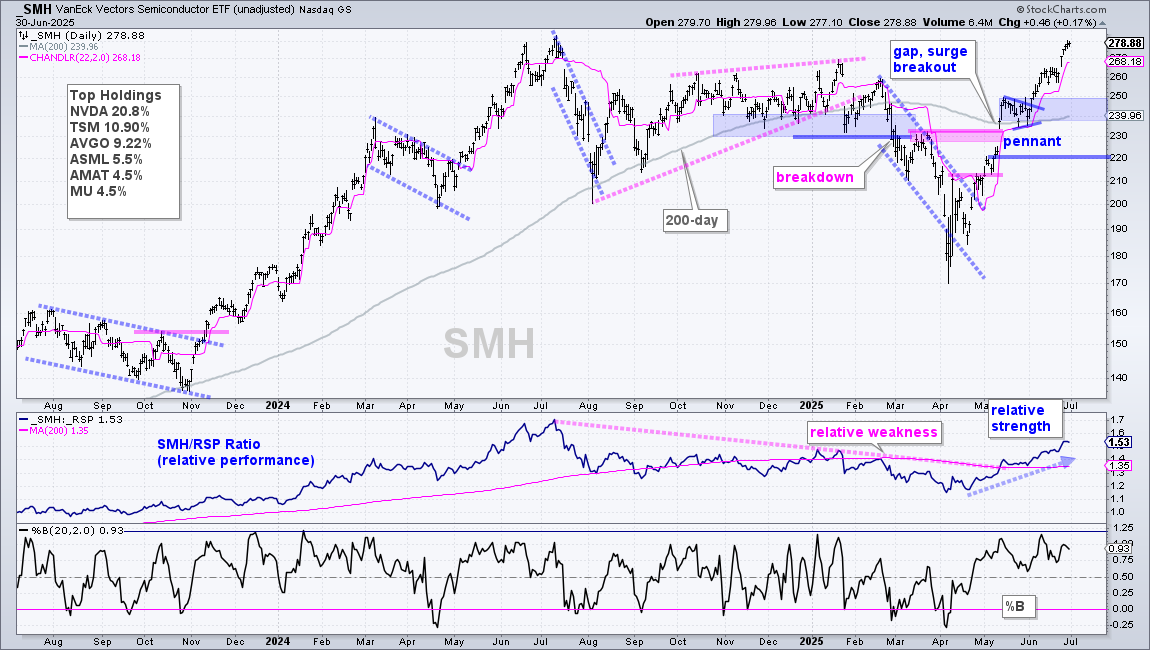
The next charts show some leading tech ETFs with their Chandelier Exits (22,2). All are in uptrends and showing relative strength the last two months. As with SPY and QQQ, these ETFs are in the trend-monitoring phase. The last setups formed into late May as pennants and flags formed. There were breakouts in early June and prices extended higher the rest of the month. It is now time to manage the trade, monitor price action and wait for the next trading setup.
For reference, I am showing the Chandelier Exits (22,2). These trail price and rise as long as price rises. The stops are two ATR(22) values below the highest high of the last 22 days. These stops are relatively tight because they are based on the pennant breakouts, which are short-term patterns. A close below the Chandelier Exit would not be bearish. Instead, it would suggest a pullback that could lead to the next setup (oversold condition or short-term bullish continuation pattern).
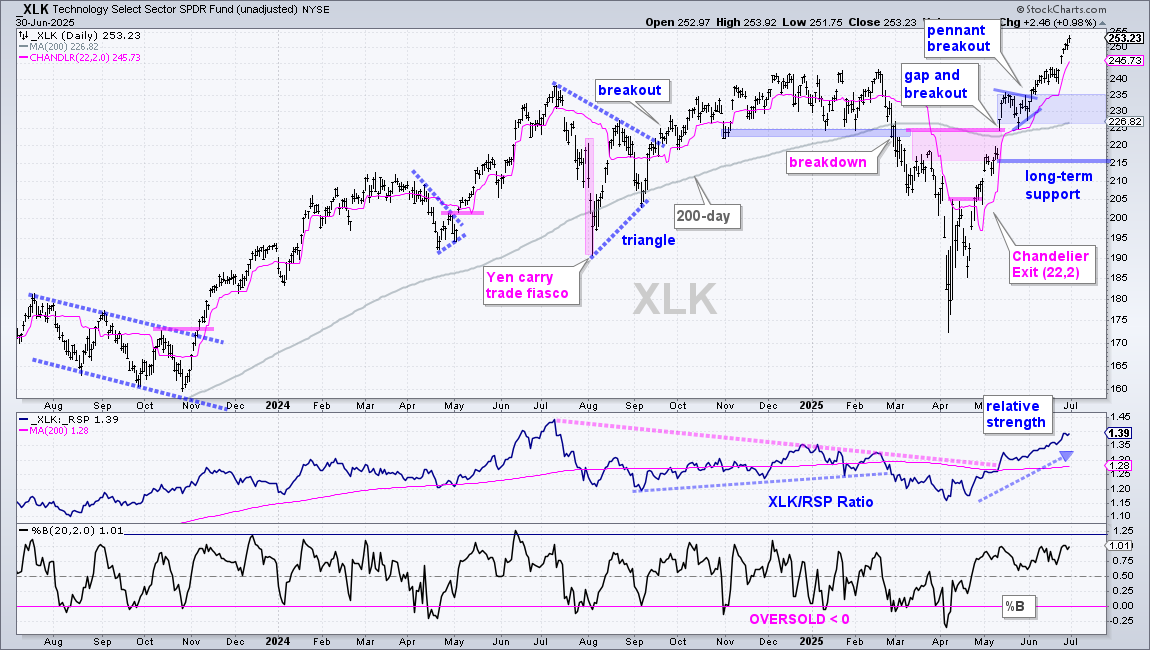
The chart below shows XLK with the big gap-breakout in mid May, a pennant into late May and a breakout in early June. XLK was the first to hit new highs in mid June and added a few more over the last few days. The move since April 21st is straight up (+35% in 48 days). This is concerning because the rate of ascent is unsustainable and there will likely be a correction at some point. The blue shading marks the first support to watch on a pullback.
Short-term, XLK formed a pennant in May and broke out in early June. The breakout occurred at 235 and XLK is currently at 253. This is good follow- through. The pink line shows the Chandelier Exit (22,2) at 245.73.
Waiting, Watching and Actual Trading
Trading involves a lot of waiting and monitoring. In fact, most of our time and effort are spent waiting for setups to emerge and monitoring current traders. Actual buying and selling accounts for a relatively small portion of time. Keep this in mind. We do not be constantly busy buying and selling. Waiting and monitoring are important to the process.
Seven Tech ETFs with Pennants and Tight Stops
The next charts show some leading tech-related ETFs with their Chandelier Exits (22,2). Blue shadings mark the short-term support zones to watch should we get a pullback. The solid blue lines mark long-term support levels, which hold the key to the mid May breakouts.
Finance and Bank ETFs Break Out (plus Insurance)
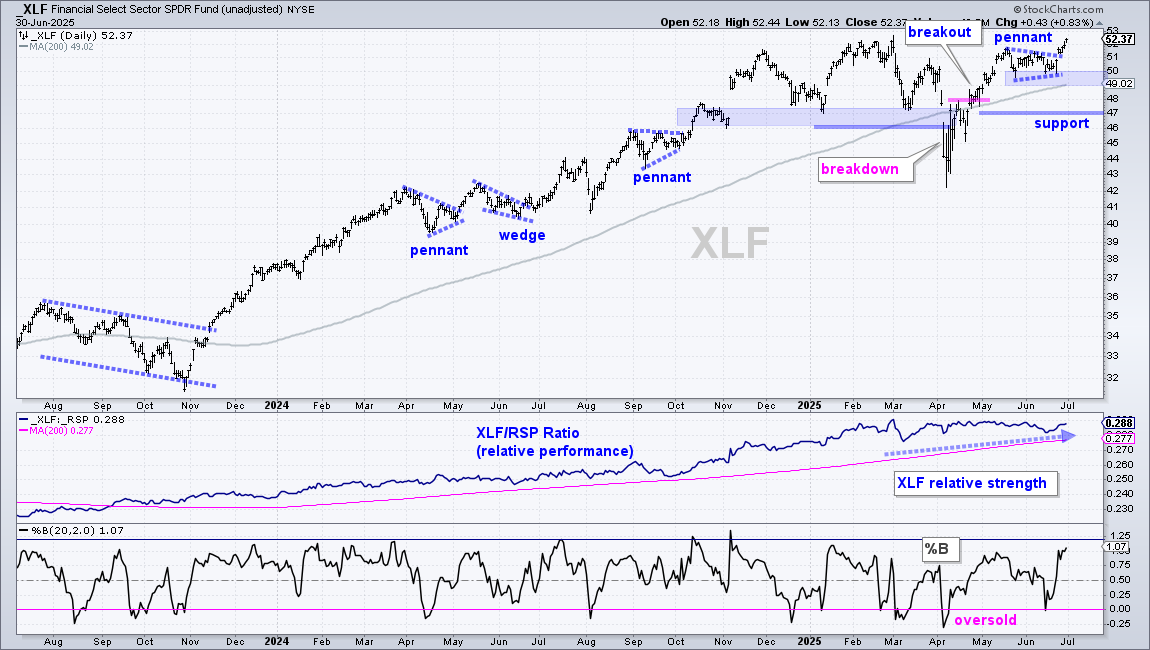
The Finance SPDR (XLF) is also in a leading uptrend as it broke out of a pennant and recorded a 52-week closing high on Monday. XLF is also above its rising 200-day SMA. Short-term, XLF surged from 42 to 51, formed a pennant into late June and broke out last week. This breakout signals a continuation higher. The pennant lows mark first support in the 49-50 area. Long-term support is set at 47.
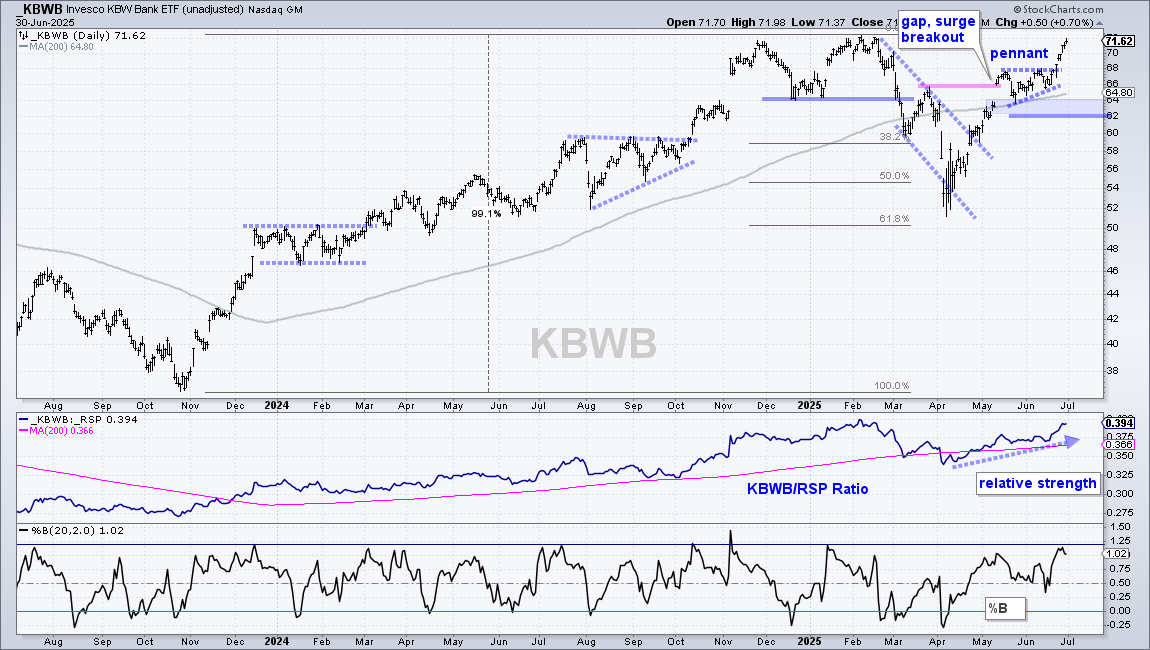
Within the Finance sector, the KBW Bank ETF (KBWB) formed a pennant just above the rising 200-day SMA and broke out last Tuesday. This ETF is close to a 52-week high and much stronger than the Regional Bank ETF (KRE). Key support is set in the 62-64 area,
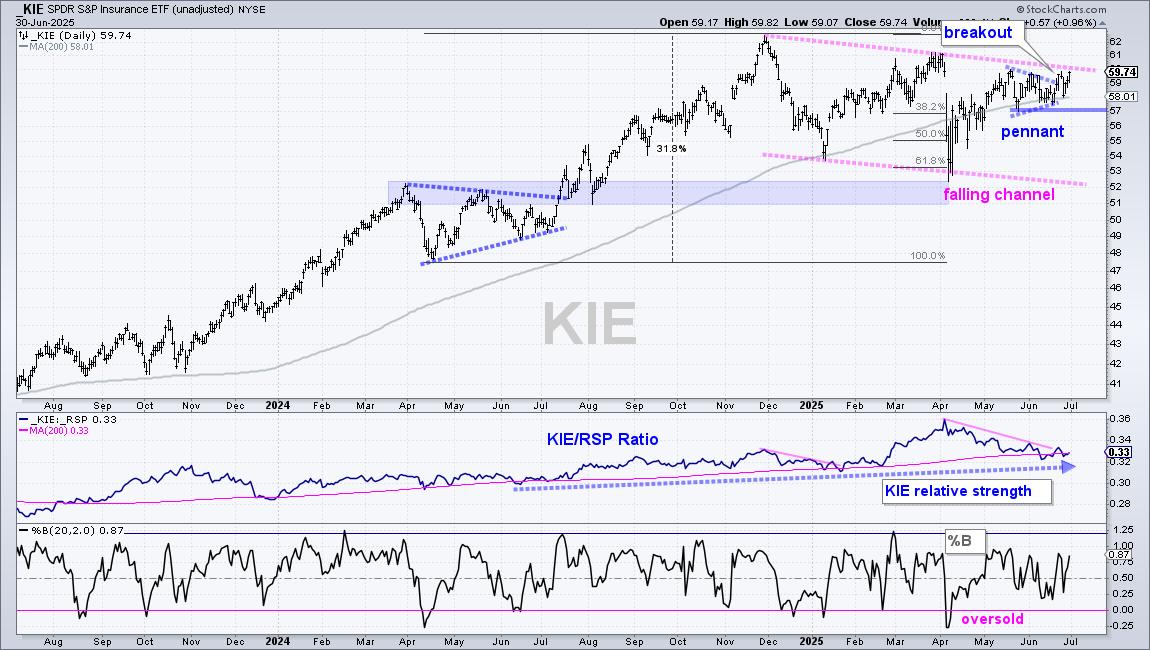
The Insurance ETF (KIE) is perking up with a pennant breakout last Monday. KIE fell back hard on Wednesday, but rebounded the last three days and the pennant breakout is back on. This pennant formed just above the rising 200-day SMA, which means one could make the case for a long-term uptrend. The pennant breakout signals a continuation of the April-May advance and this argues for a channel breakout (pink lines). A close below 57 would argue for a re-evaluation.
Medical Devices ETF Breaks Flag Line (plus XLY)
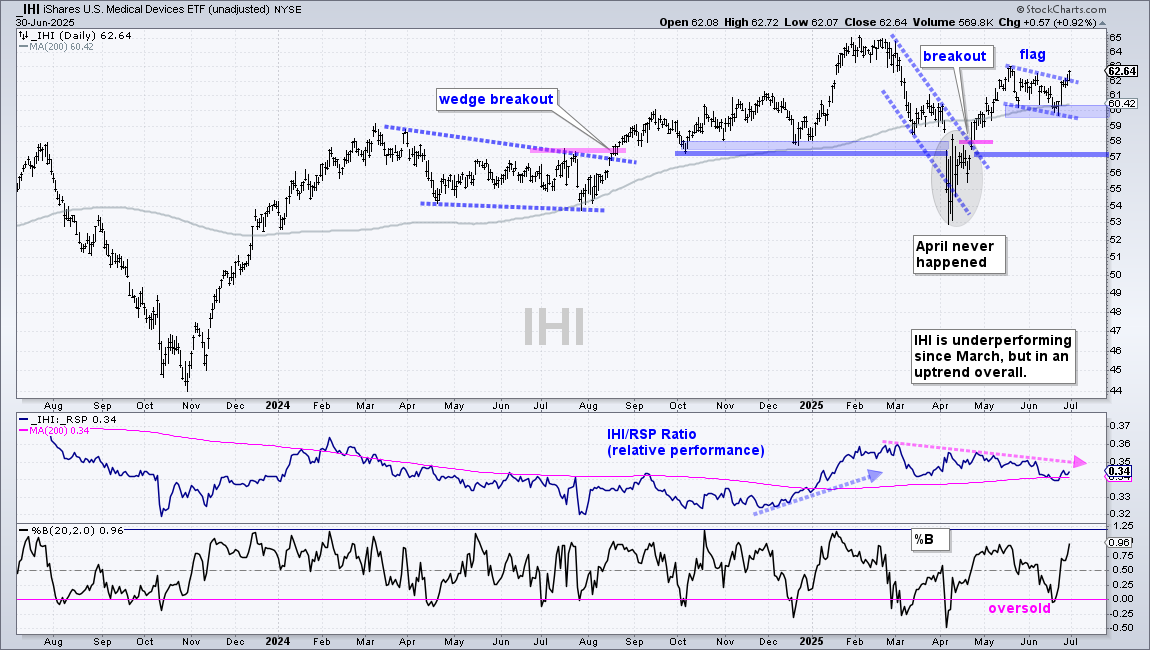
The next chart shows the Medical Devices ETF (IHI) with a falling flag forming above the rising 200-day SMA. Again, this is short-term bullish continuation pattern and the flag breakout signals a continuation of the April-May advance. Thus, this breakout projects a move to new highs. The flag lows mark first support around 60. Long-term support remains at 57. Even though IHI is in an uptrend on the price chart, the price-relative (IHI:RSP ratio) fell from March to June as IHI underperformed. IHI is not really a leader, but is in a long-term uptrend with a flag breakout working.
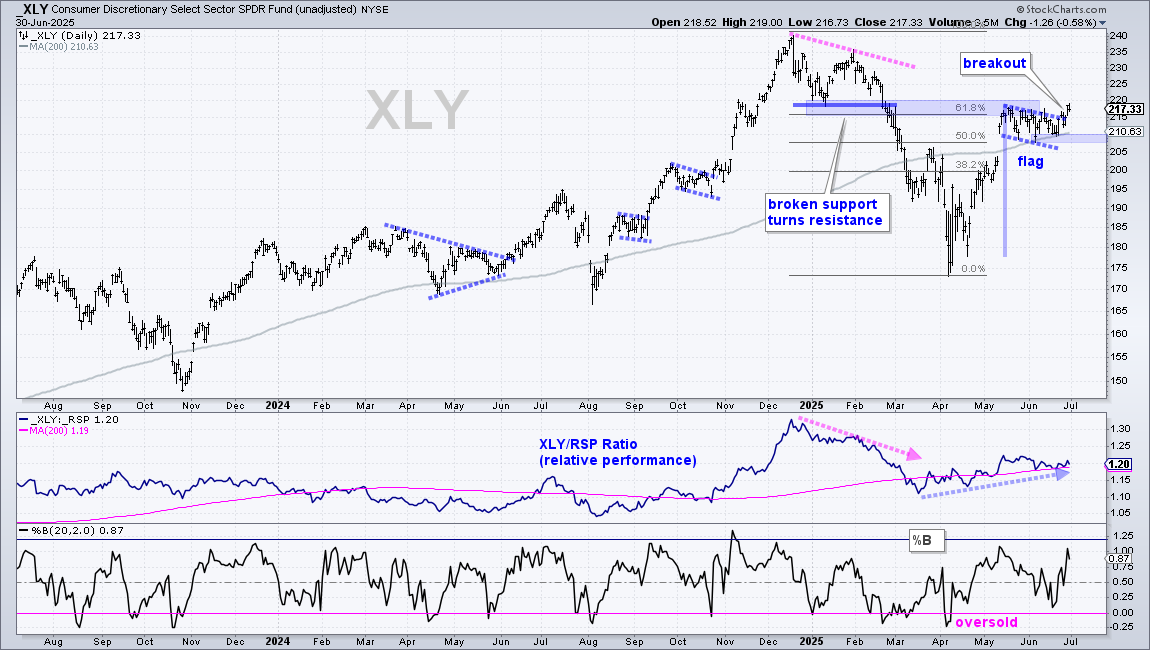
The Consumer Discretionary SPDR (XLY) also formed a falling flag just above the 200-day SMA and broke the flag line with a surge last week. The flags lows mark re-evaluation support at 207.
Telecom and BlockChain Break Out to New Highs
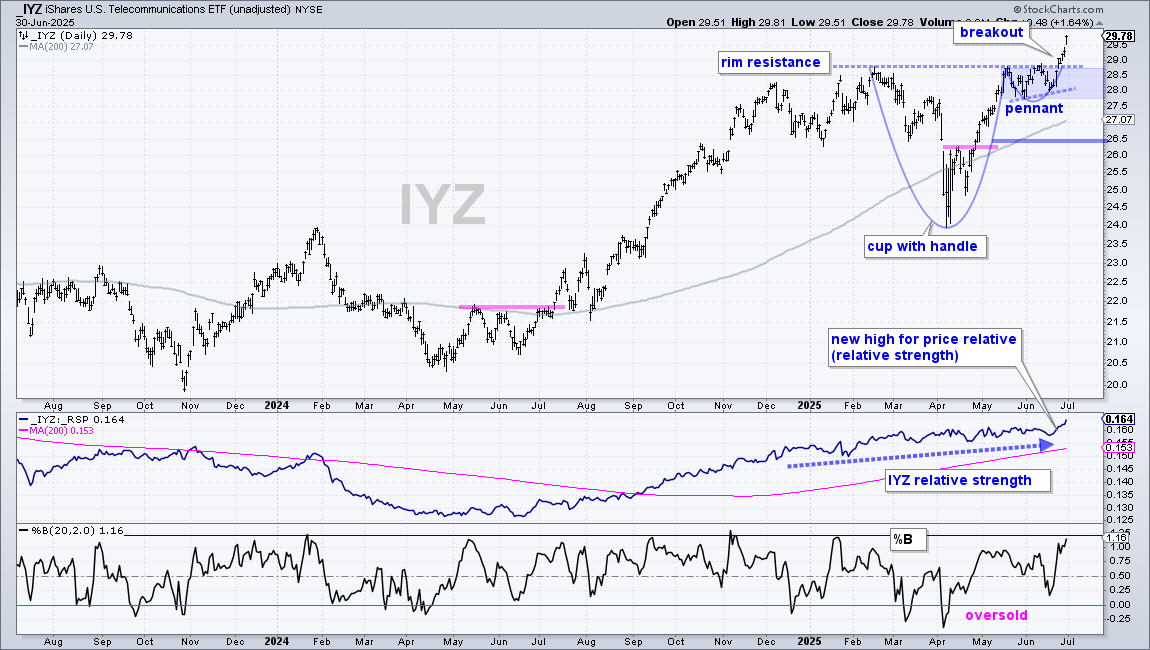
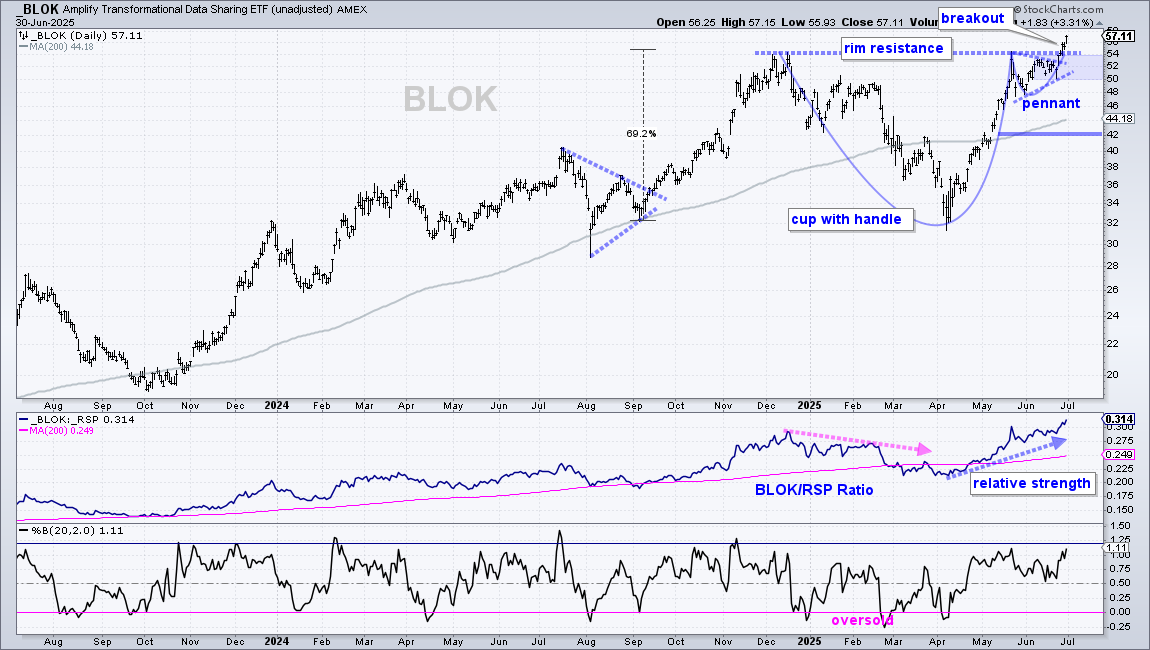
I highlighted the cup-with-handle patterns in IYZ and BLOK last week. To recap: the cup represents a basing process, the handle is a small consolidation on the right side and a break above rim resistance confirms the pattern. Both IYZ and BLOK broke out early last week and extended to new highs. ETFs hitting new highs are in strong uptrends and leading.
The first chart shows the Telecom ETF (IYZ) with the cup forming from February to mid May, the handle taking shape into late June and the breakout last week. Notice that the handle formed as a pennant, which is a short-term bullish continuation pattern. The pennant breakout and rim resistance breakout are bullish. First support is set in the 27.7-28.7 area (pennant) and long-term support is set at 26.50.
The next chart shows the Transformational Data Sharing ETF (BLOK) with a cup-with-handle from December to June. BLOK also formed a pennant and broke out with a surge the last five days. The pennant zone marks first support in the 50-54 area, should the ETF pull back and offer a second chance to partake in the breakout. Long-term, I am leaving support at 42, which is just below the rising 200-day SMA.
Homebuilders ETF Breaks Pennant Line and Leads ITB
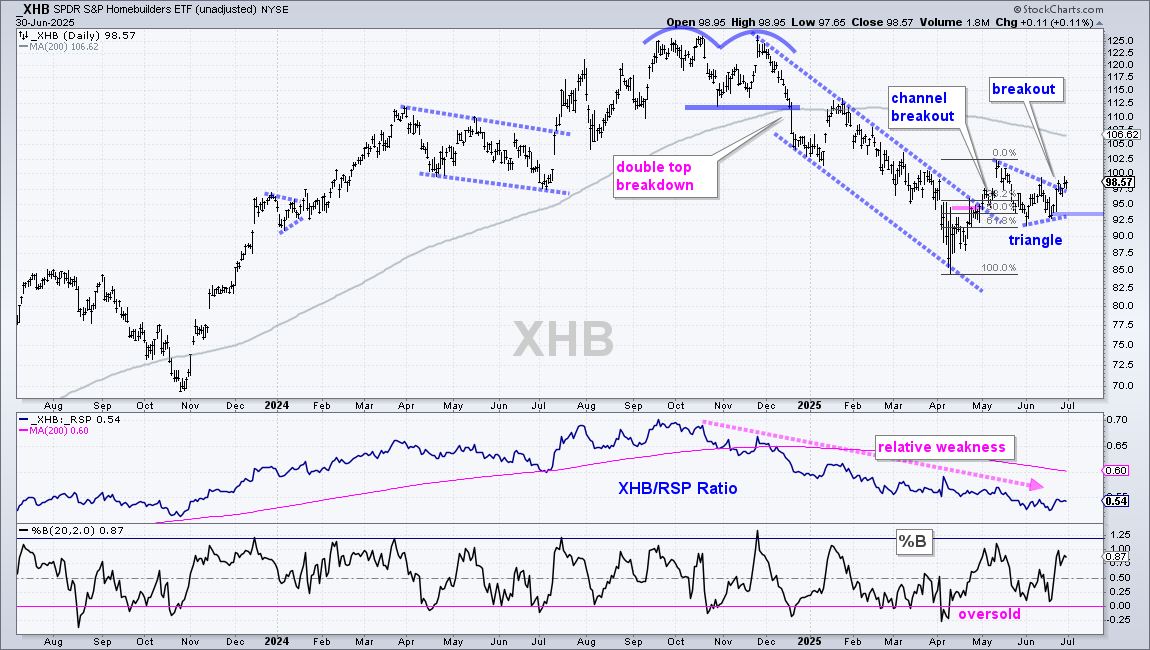
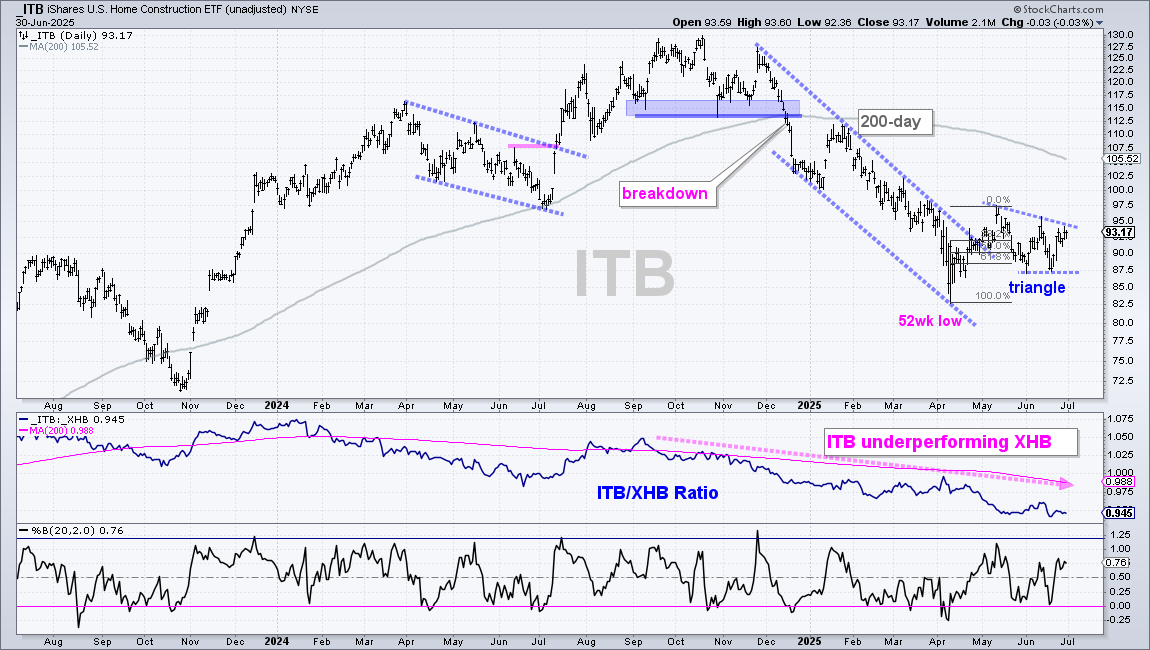
XHB and ITB are similar, yet different. The Homebuilders SPDR (XHB) is an equal weight ETF covering homebuilding (49%), building products, home improvement retail and home furnishings. The Home Construction ETF (ITB) is a market-cap weighted ETF with a heavier focus on the homebuilders (65.26%). Its top five holdings account for over 45% (DHI, LEN, NVR, PHM, TOL). XHB and ITB are highly correlated, which means they move in the same direction. However, ITB is the weaker of the two. Both are in long-term downtrends as they trade below their falling 200-day SMAs.
The first chart shows the Homebuilders ETF (XHB) breaking channel resistance with an advance in April-May. XHB fell back into June with a pennant/triangle taking shape. The ETF found support near the 61.8% retracement with two lows in the 92.5 area in June. XHB then broke out of the triangle with a surge above 98 last week. I view this breakout at short-term bullish and would target a move to the falling 200-day SMA (106.62). A close below 93 (blue line) would call for a re-evaluation.
The next chart shows ITB with similar characteristics. Note, however, that ITB has yet to break out of its triangle and ITB is underperforming XHB. The middle window shows the ITB/XHB ratio falling from early September to late June. ITB shows relative weakness (relative to XHB). This also means XHB shows relative strength.
Send feedback to support(at)trendinvestorpro.com or use the contact form.