As many of you already noticed, I made some modifications to the main member pages and the offerings. The offerings are split into two: System Trader and Chart Trader. System Trader covers the quantified strategies and signal tables (pure systematic). Chart Trader covers the reports with chart setups, trading ideas and analysis (discretionary).
It takes considerable time to develop new trading strategies. In fact, the time required for strategy development is indefinable. I cannot promise a new strategy every month and do not know when a new strategy will pass rigorous testing. I have a few in the pipeline, but need more development time.
In the meantime, I separated the systematic offering from the discretionary offering. Chart Trader reports and videos will be posted on Tuesdays and Thursdays before 8AM ET. We will cover the major index ETFs for broad market analysis and bring trading ideas for stocks and ETFs.
There are quick access links at the top of the main member pages. “Strategies & Updates” covers the strategy reports and updates. “Signal Pages” contains the signal table pages for the active strategies. “Market Timing” is the market regime page with the Composite Breadth Model, yield spreads and Fed balance sheet. “Chart Trader” contains the reports with chart analysis and trading ideas.
The next Chart Trader report/video will be posted on Thursday, September 7th.
September Seasonality
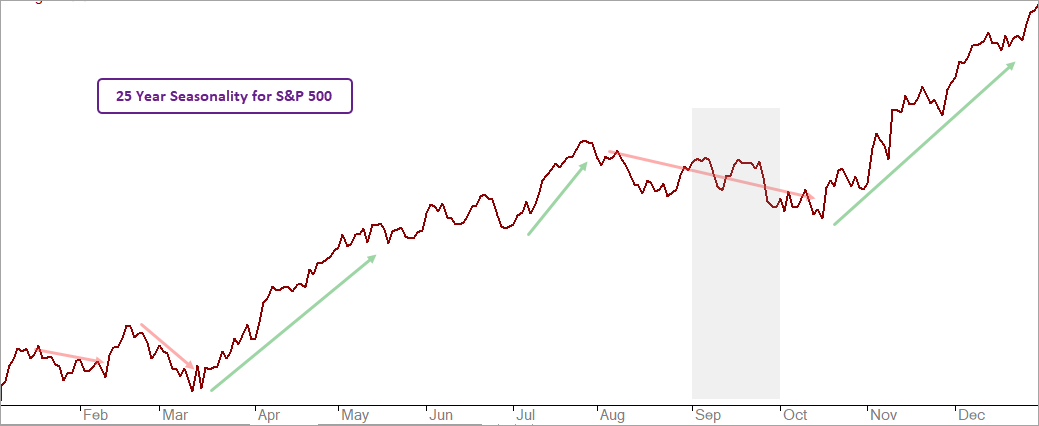
The chart below shows 25-year seasonality for the S&P 500. There are three strong periods and three weak periods. The strong periods are mid March to early May, July, and mid-October to yearend (green arrows). The seasonally weak periods are January, mid-February to mid-March, and August to mid-October (red arrows). The gray shading highlights September. The month shows a tendency to end weak.
Yield Spreads Show No Signs of Stress
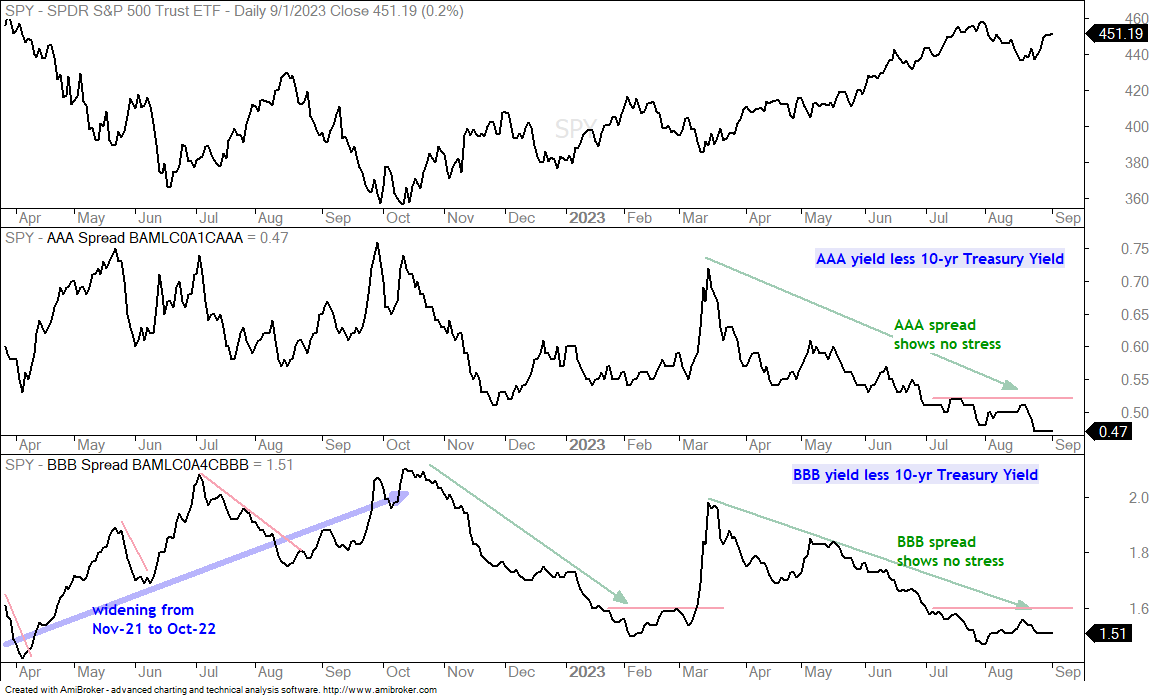
Like everything in the markets, seasonality does not matter until it does. September is here and yield spreads are showing no signs of stress in the credit markets. Most of my focus is on the BBB yield spread. BBB bonds are the lowest rated investment grade bonds, which means they are one level above junk. The bottom window shows this spread falling from late March to late July and then edging higher in August. The red line marks my line in the sand and a break above 1.6 would show stress creeping into the credit markets. This would be negative for stocks.
SPY Remains in Long-term Uptrend
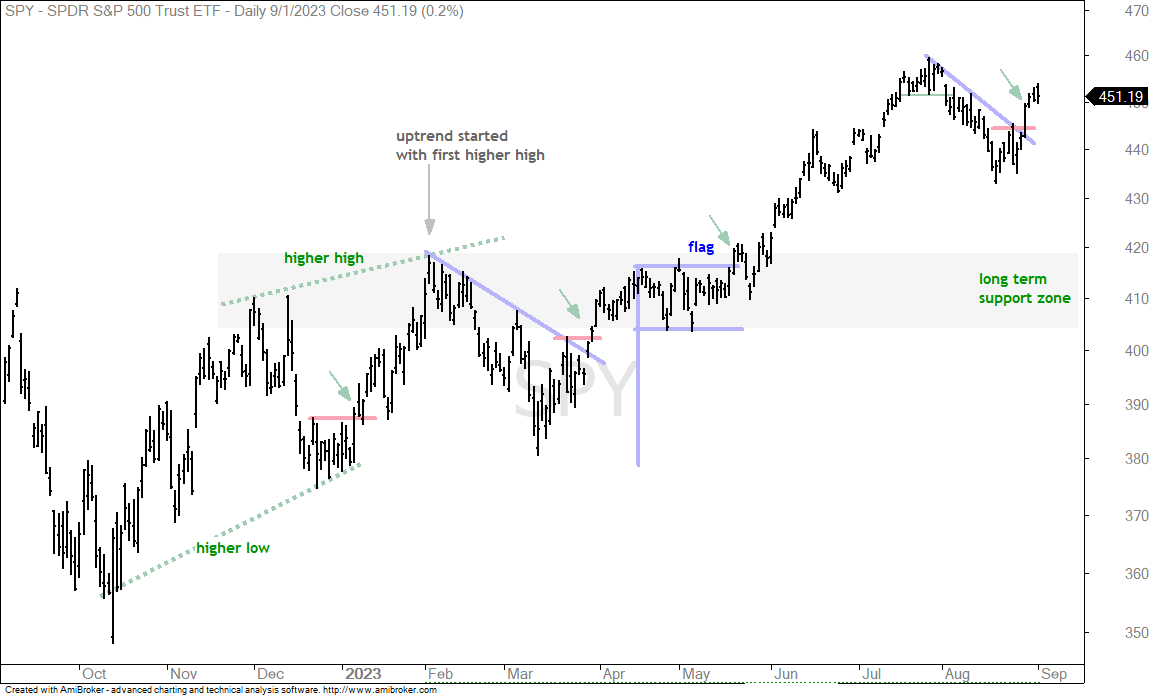
The next chart shows SPY in a long-term uptrend. At its simplest, prices are moving from the lower left to the upper right. There were four pullbacks along the way and four breakouts (green arrows). The most recent breakout occurred with the surge on August 29th. We will look at this breakout in detail next. For now, the long-term trend is up and I am marking support in the 405-420 area (gray shading). Broken resistance, the flag consolidation and the May lows mark support here.
A Strong Breakout Should Hold
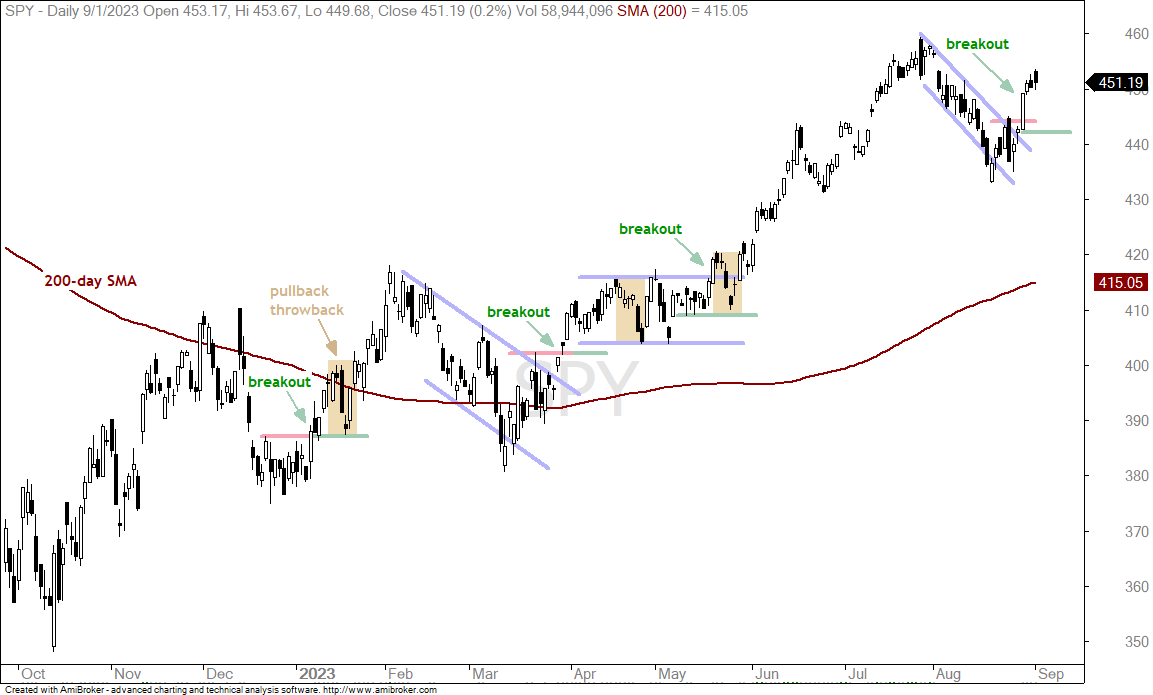
The next chart shows SPY with candlesticks and the four breakouts. The yellow shadings after the first three breakouts show pullbacks or throwbacks. A big surge triggered the breakout and there was also a fairly sharp pullback at some point. This is where it gets tricky. SPY broke out a four-day 3.23% gain that included a 1.4% surge on August 29th. It is important that the breakout and the August 29th surge hold. A close below 442 (green line) would negate the breakout and erase this surge. A failed breakout combined with September seasonality would increase the chances for a rough ride.
QQQ Breaks Short-term Resistance
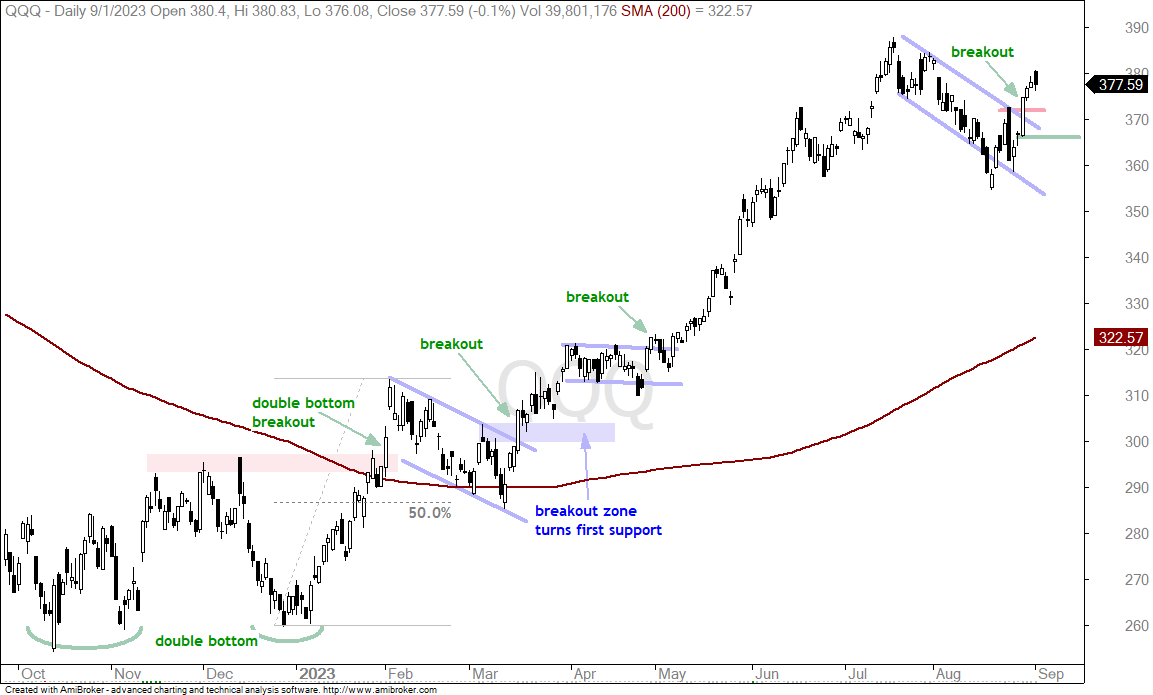
The next chart shows QQQ with a similar breakout on August 29th. Using the same rationale, a strong breakout should hold and a break below 366 would be negative.
Watch XLK for Cues on Techs
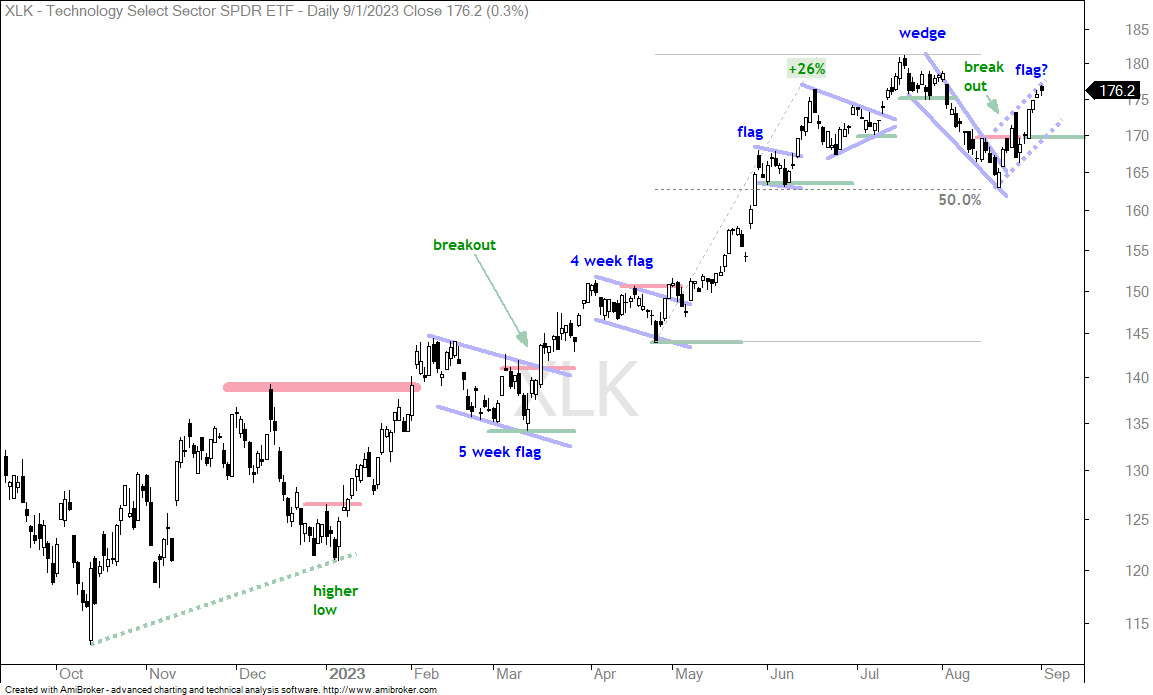
The Technology SPDR (XLK) is the one to watch for clues on tech stocks and tech-related ETFs. As with SPY and QQQ, XLK fell sharply into mid August and formed a falling wedge. The ETF reversed this fall with a breakout on August 23rd and the short-term trend is up. At this point, I am now defining the short-term uptrend and setting the level to reverse this upswing. A rising flag could be forming and a break below 169 would be bearish. Such a move would also erase the surge from August 29th. A break below this low would likely weigh on tech stocks and tech-related ETFs.
What Do the Bears See?
I am not a big fan of shorting the stock market or trying to trade the downside. Making money on the downside is much more challenging that trading the long side. The stock market has a long-term upward bias, volatility increases when the market declines and the Fed is always lurking. Having said that, I think the best way to approach the short side is to pick a top and lean into a trade. This means shorting when overbought or near a retracement/resistance zone. It is often too late by the time the big break occurs. The next section will show alternative analysis with a bearish take.
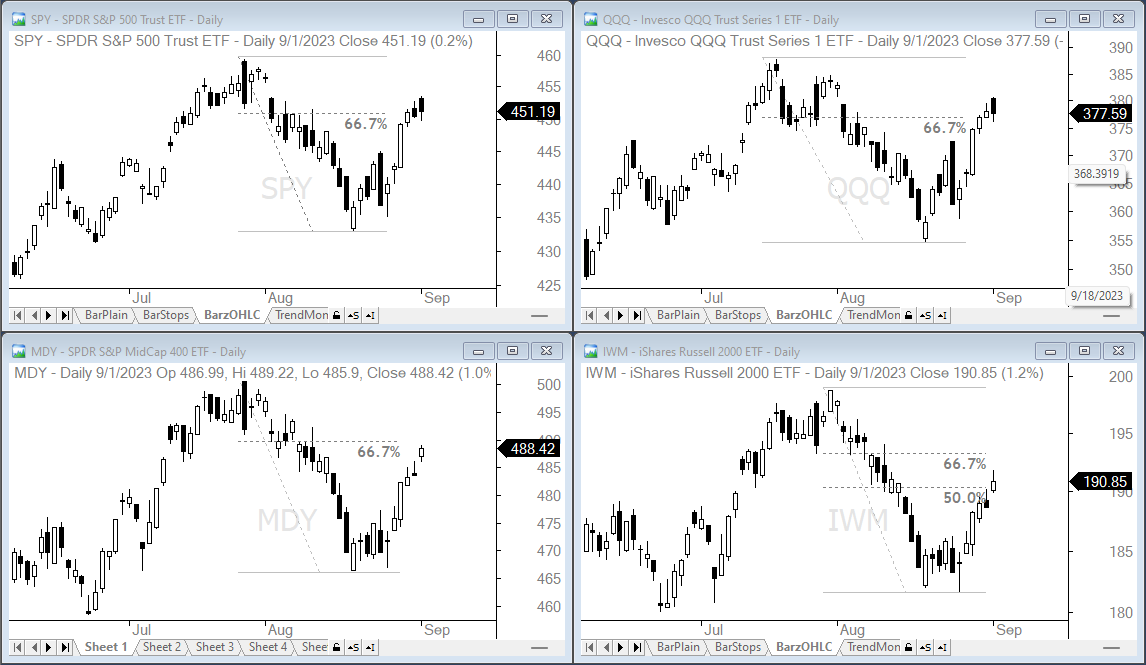
SPY, QQQ, MDY and IWM fell sharply into mid August and then bounced the last two weeks. The August decline showed some of the strongest selling pressure of the year as bearish breadth thrusts triggered. Stocks became oversold in August and bounced in the second half of the month. The bears assume the August decline was an impulse move lower. This means the rebound over the last two weeks is a counter-trend bounce. The bears would expect the bounce to run out of steam after retracing 33 to 67 percent. The chart below shows the current bounce retracing 50 to 67 percent. Top pickers are circling the wagons here. IWM is the weakest of the four because it has the shallowest retracement.