The next report will be posted on Tuesday, August 22nd.
Bearish Breadth Thrusts in SPX and NDX
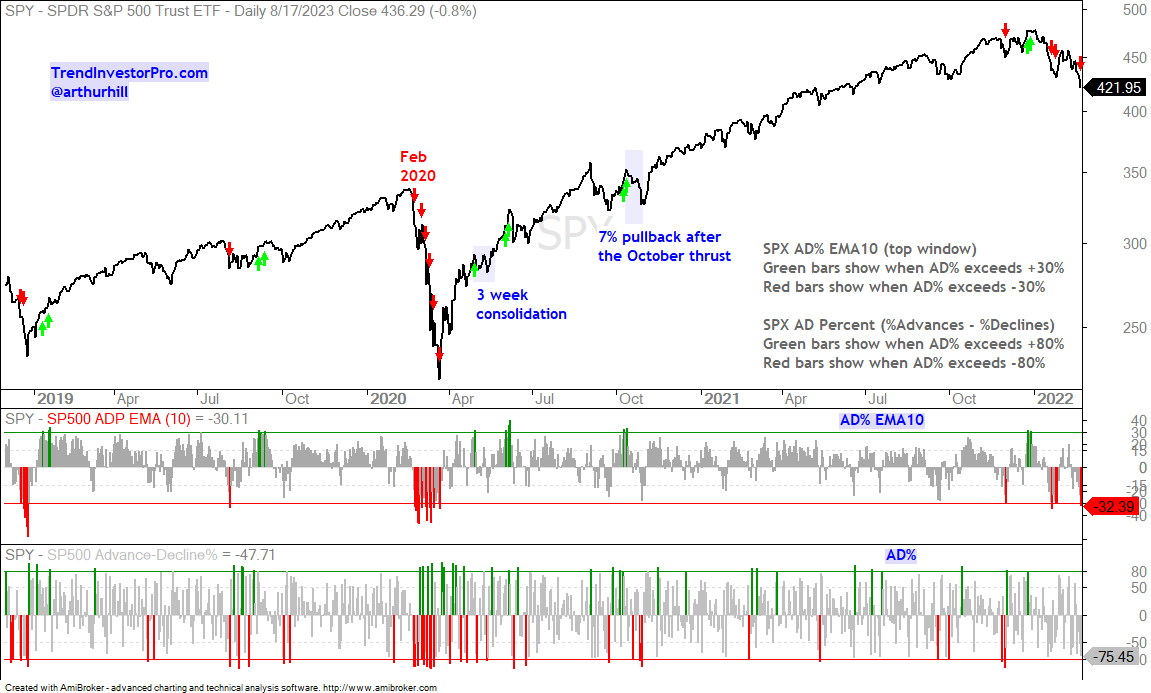
Selling pressure intensified in August as we saw the first bearish breadth thrust since mid March. I use the 10-day EMA of Advance-Decline Percent to measure breadth thrusts. AD% is percent advances less percent declines. A bullish thrust occurs with a move above +30% and a bearish thrust with a move below -30%.
On its own, this indicator performed great in 2019, 2020 and 2021. The green arrows on the price chart show bullish thrusts igniting extended uptrends in January 2019, September 2019 and April 2020. There were also continuation thrusts in June and October 2020 (blue shading). The red arrows show bearish thrust signals with a very timely signal in late February 2020.
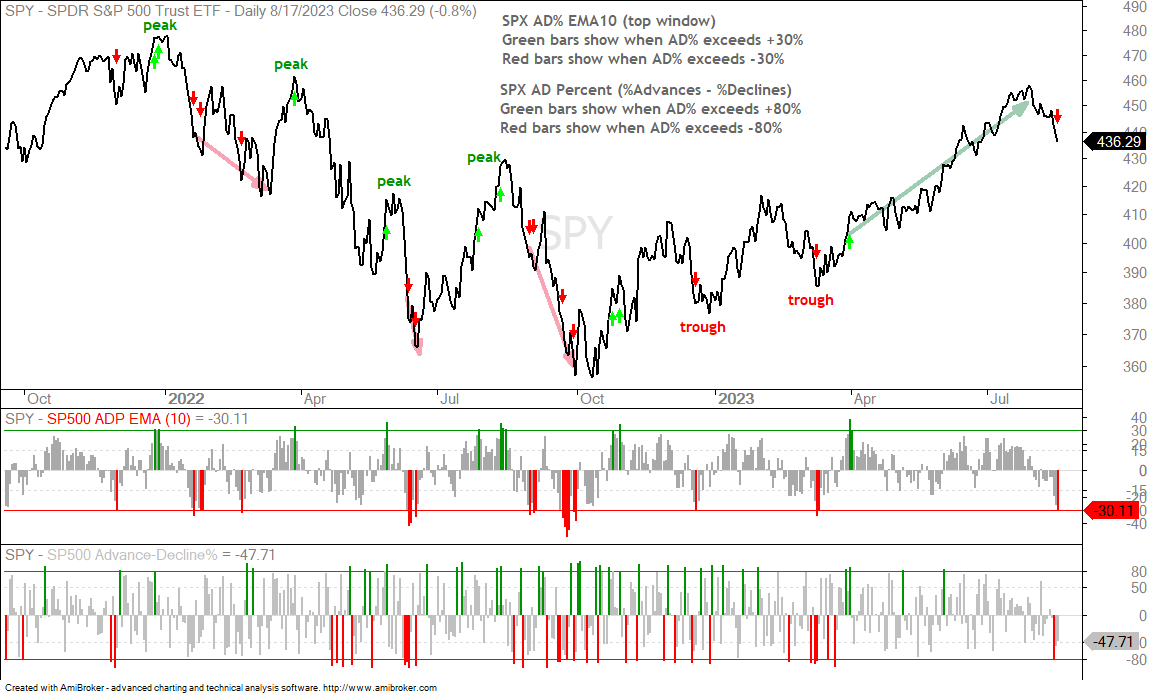
The next chart shows signals since December 2021 and performance here is mixed, at best. Bullish thrust signals in late December 2021, late March 2022, late May 2022 and mid August 2022 foreshadowed peaks. Bearish thrust signals in December 2022 and March 2023 foreshadowed troughs. The red arrows show some downside follow through to bearish thrusts in 2022 and the green arrow shows upside follow through to the bullish thrust on March 31st, 2023.
The most recent signal is a bearish breadth thrust on Thursday, August 17th. Short-term, this signal suggests an oversold condition after strong selling pressure in August. This short-term condition could give way to a bounce. Longer term, this is the initial thrust signal and we could see some downside follow through after an oversold bounce. This is what happen after the initial signals on 21-Jan-2021 and 31-Aug-2021.
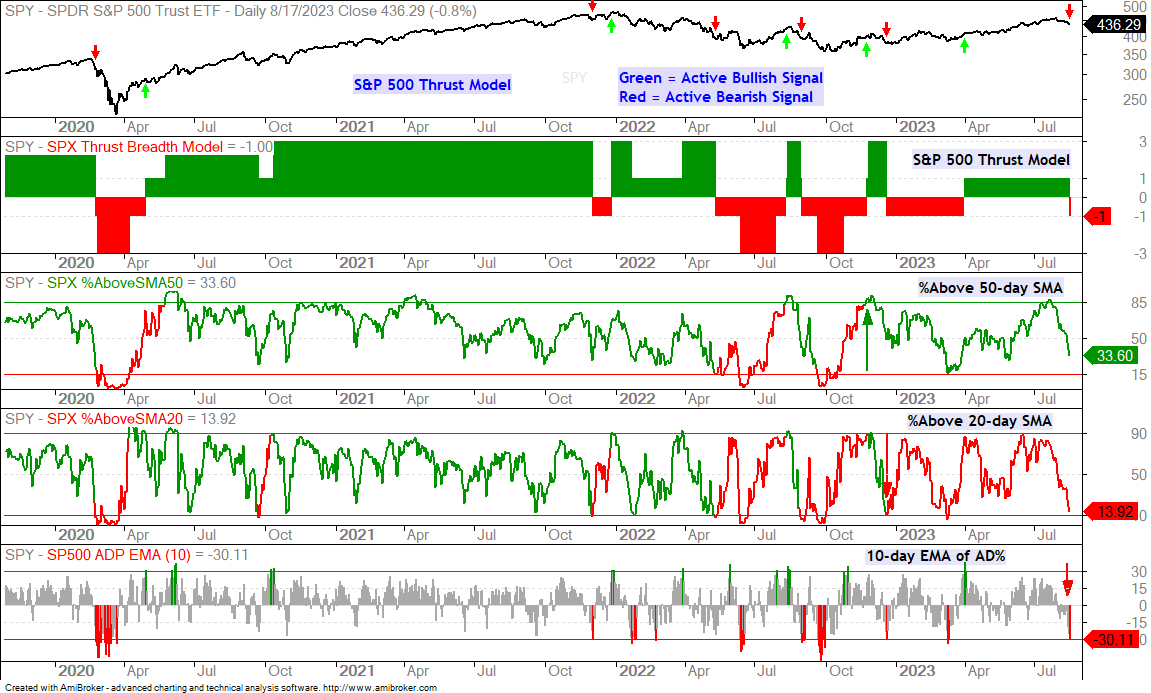
S&P 500 Thrust Model Turns Negative
The 10-day EMA of SPX Advance-Decline Percent is part of the S&P 500 Thrust Model, which is part of the Composite Breadth Model. With the 10-day EMA of SPX AD% dipping below -30%, two of the three indicators in the Thrust Model are bearish. SPX %Above 20-day SMA has been bearish since December 2022 and SPX %Above 50-day SMA has been bullish since November 2022. The green and red arrows on the chart show prior signals.
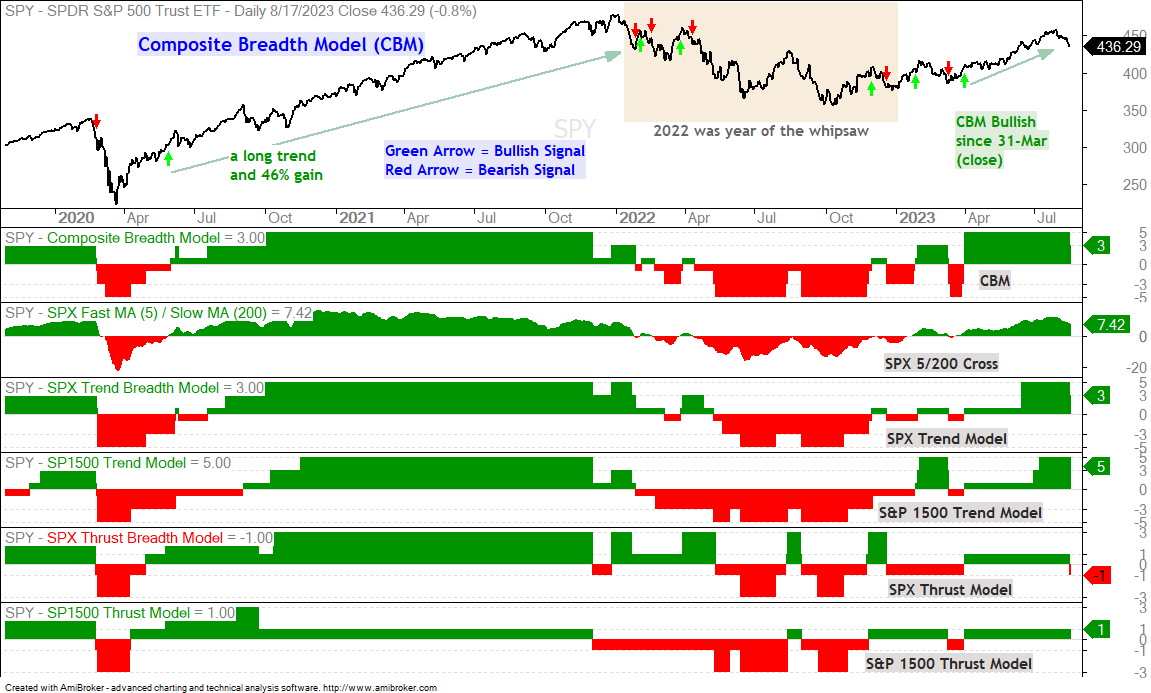
The S&P 500 Thrust Model is one of five inputs for the Composite Breadth Model. The chart below shows the CBM and these inputs. The SPX 5/200 day SMA cross remains positive, as do the S&P 500 and S&P 1500 Trend Models and S&P 1500 Thrust Model. The CBM started the week at +5, but moved down a notch to +3 as one input turned bearish (it is always negative). Four bullish inputs less 1 bearish input is +3 (4 – 1 = 3)
September is Around the Corner
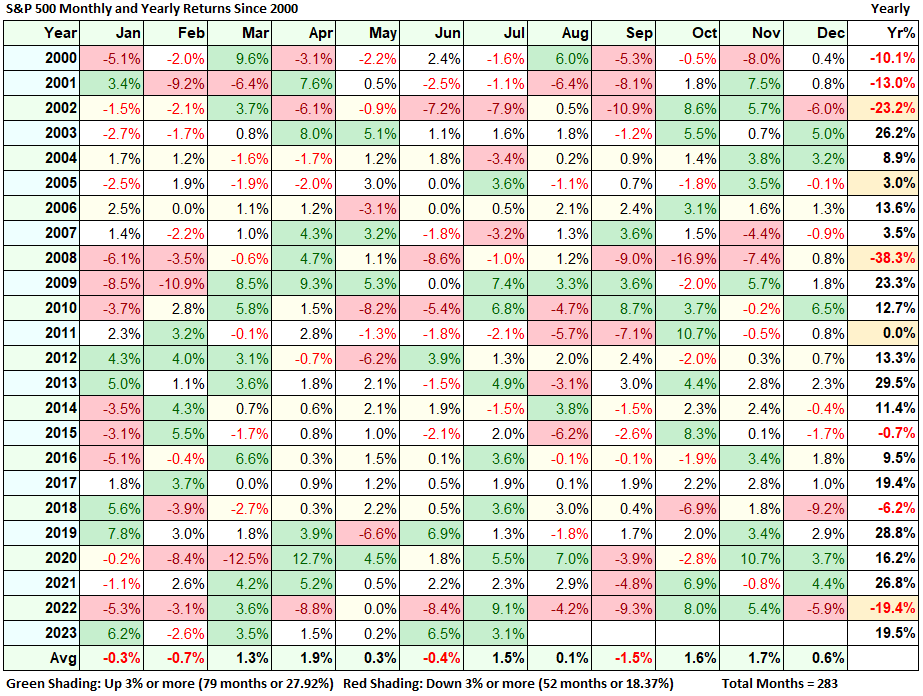
The S&P 500 has a long-term bullish bias, but down years and months do happen. Of the last 24 years (2023 included), the S&P 500 closed higher 18 years (75%) and lower 7 years (25%). Of the 283 months since January 2000, the S&P 500 closed higher 176 months (62%) and lower 107 months (38%). The table below shows the monthly and yearly return data for the S&P 500 since January 2000. The red shading highlights months with a loss of 3% or more (18.37% of months) and the green shading highlights months with a gain of 3% or more (27.92% of months).
Overall, I am not a big fan of seasonal patterns because price action takes precedent. One month, however, stands out on the downside: September. This month closed higher 48% of the time and lower 52% of the time. The average gain/loss was a loss of 1.5%. It is the only month with an average gain/loss percentage of -1% or more. On the bright side, October and November are some of the strongest months (historically).
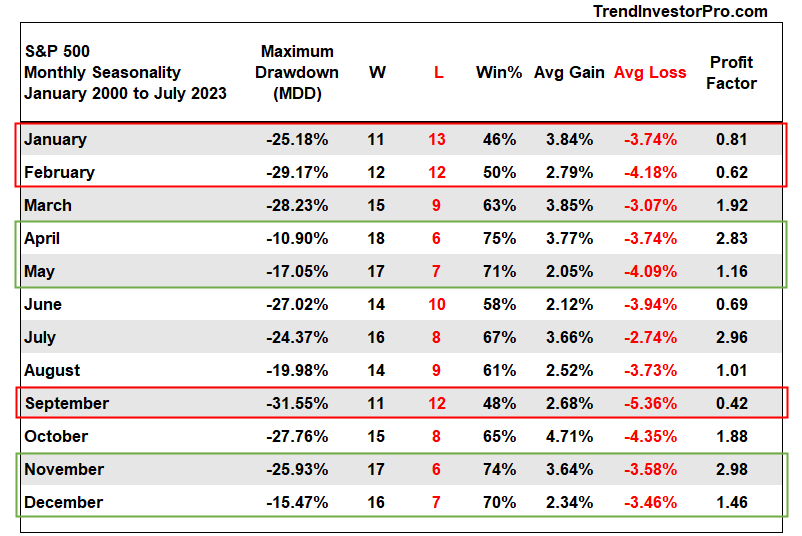
The next table shows the performance metrics for each month. These numbers are based on the percentage change for each month. Basically, buy the close at the end of the prior month and sell the close at the end of the current month. I did not account for commissions or slippage in these backtests.
Again, September stands out on the downside. Only two months were down more than half the time (January and September). September shows the lowest Profit Factor by far. Profit Factor is the total profits divided by the total losses. It is the ex-post reward to risk ratio. Profit Factors below 1 means losses were greater than profits. The low Profit Factor (.42) in September reflects a low Win% (48%), a low Average Gain (2.68%) and a high Average Loss (-5.36%). September is also the month with the highest drawdown. Bullish seasonal patterns resume in October and continue into yearend.
Next Support for the S&P 500 SPDR
The move below -30% in the 10-day EMA of SPX AD% shows the most downside participation since March. The percentage of stocks above the 200-day SMA continues to wane in the broad indexes. Current numbers are S&P 500 (50.20%), S&P MidCap 400 (50.63%) and S&P SmallCap 600 (42.71%). The market internals are pretty much split right now.
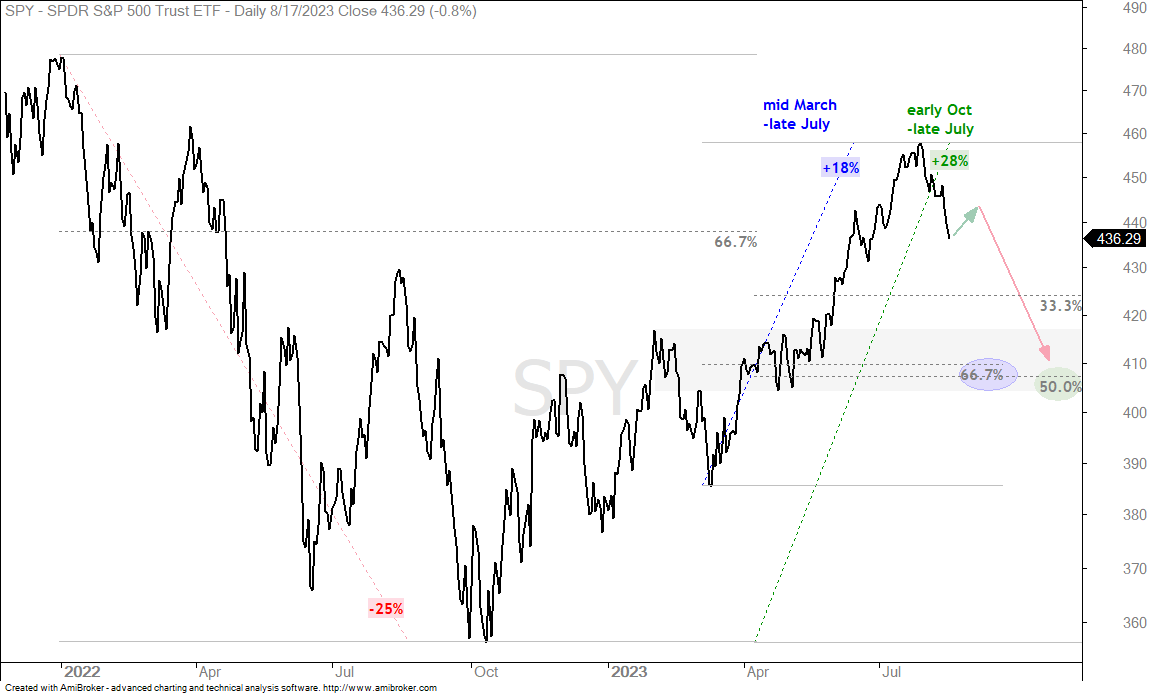
Stocks are short-term oversold now and ripe for some sort of bounce. Should selling pressure resume after a bounce (green arrow) and continue into September (red arrow), I would mark support in the 410 area. A decline to this area would be around 10% from the July 31st high. This may seem drastic, but such a decline would represent a 33 to 50 percent retracement of the October-July advance. A 66.7 percent retracement of the 18% advance from mid March to late July would extend to the 410 area as well. Both retracement amounts are normal for corrections within bigger uptrends.