IWM Reverses Short-term Downswing within Trading Range
Technology SPDR Sums Up the Situation
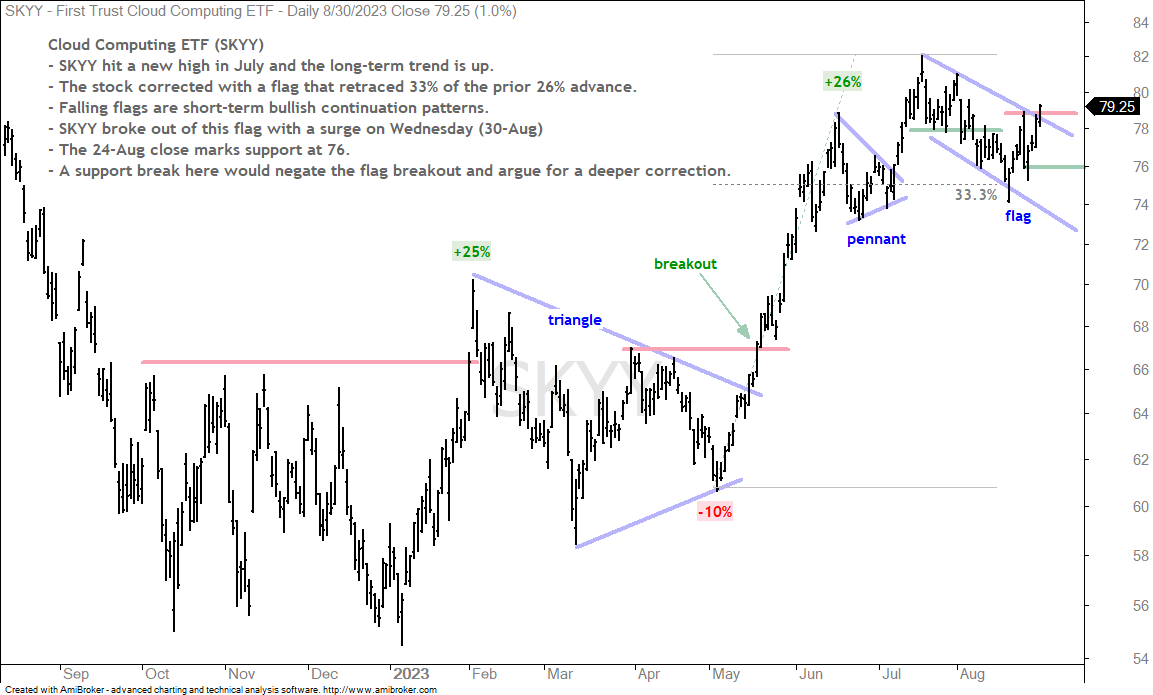
Cloud Computing ETF (SKYY)
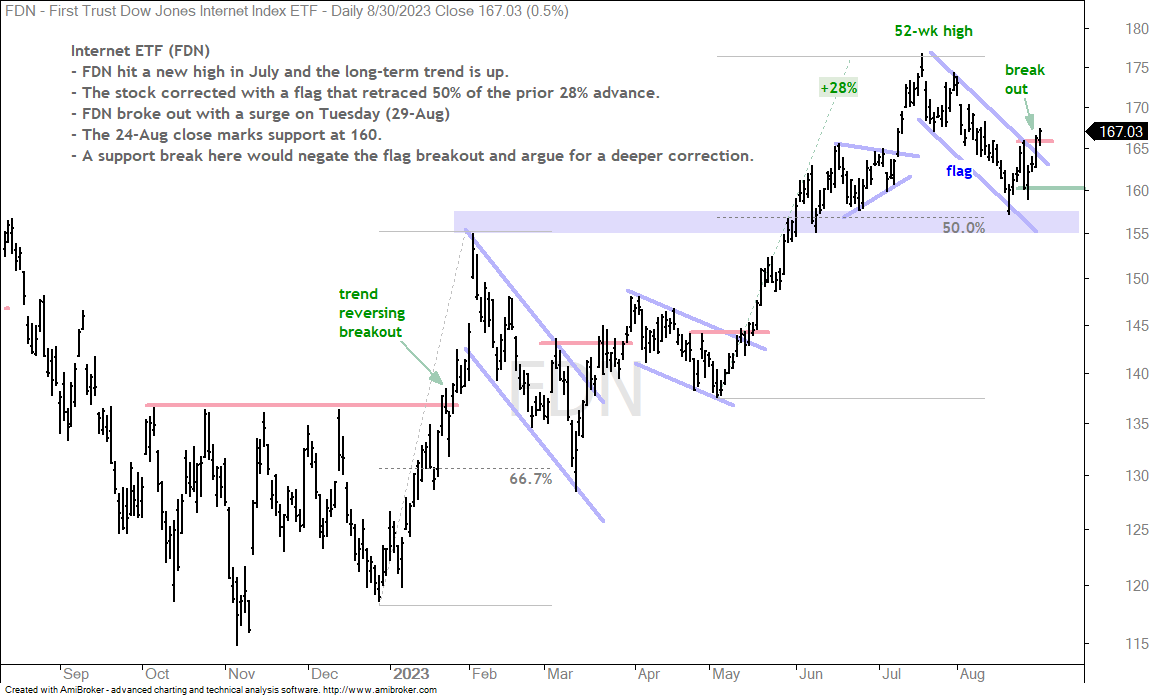
Internet ETF (FDN)
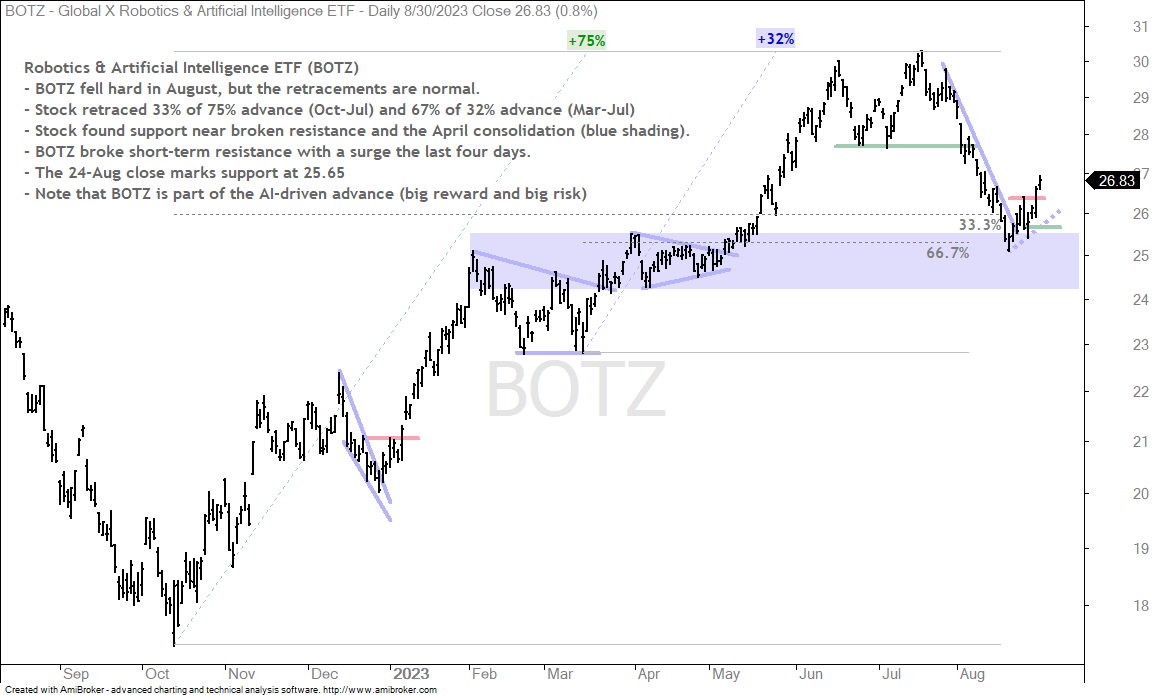
Robotics & Artificial Intelligence ETF (BOTZ)
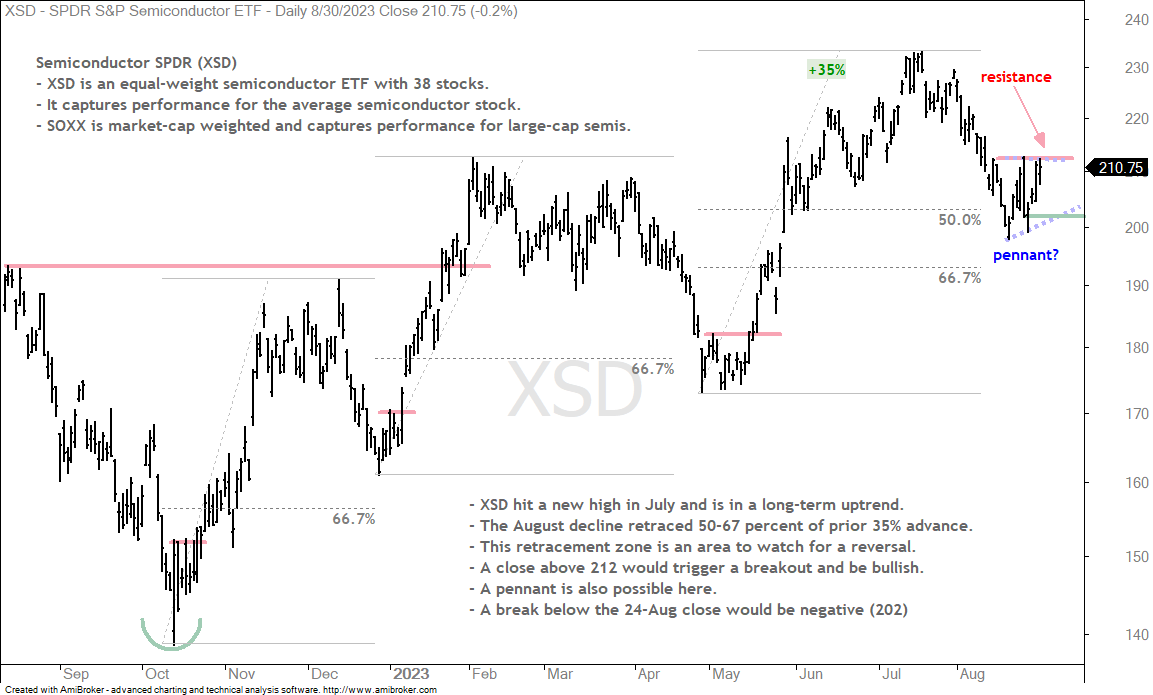
Semiconductor SPDR (XSD)
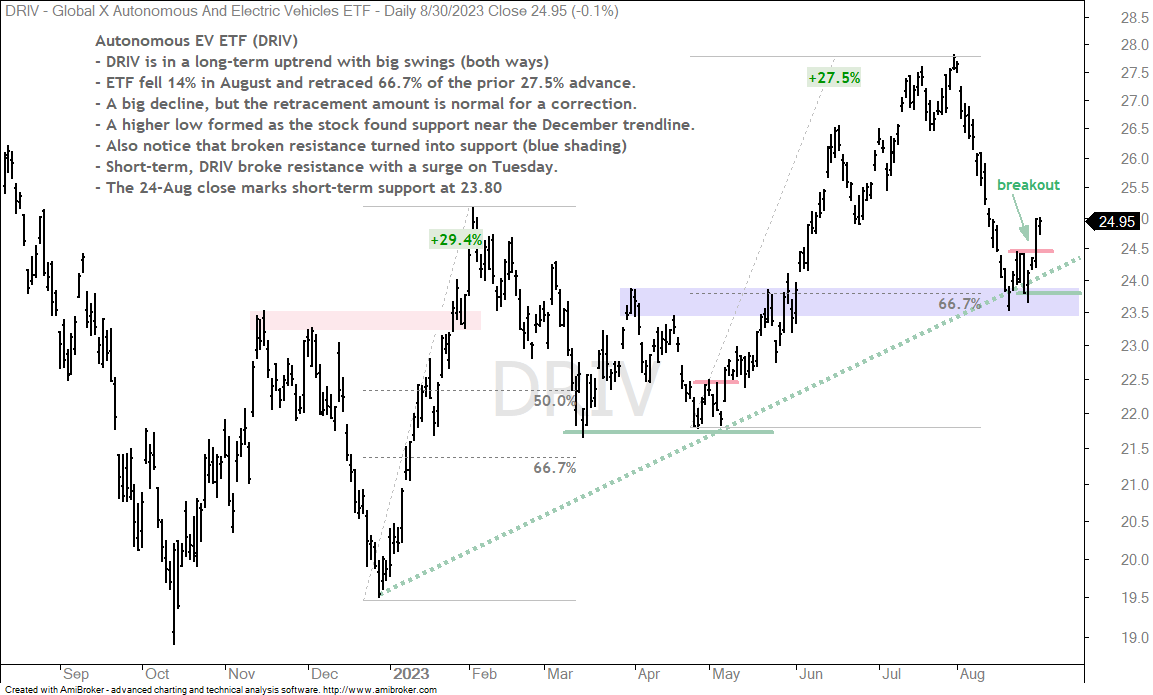
Autonomous EV ETF (DRIV)
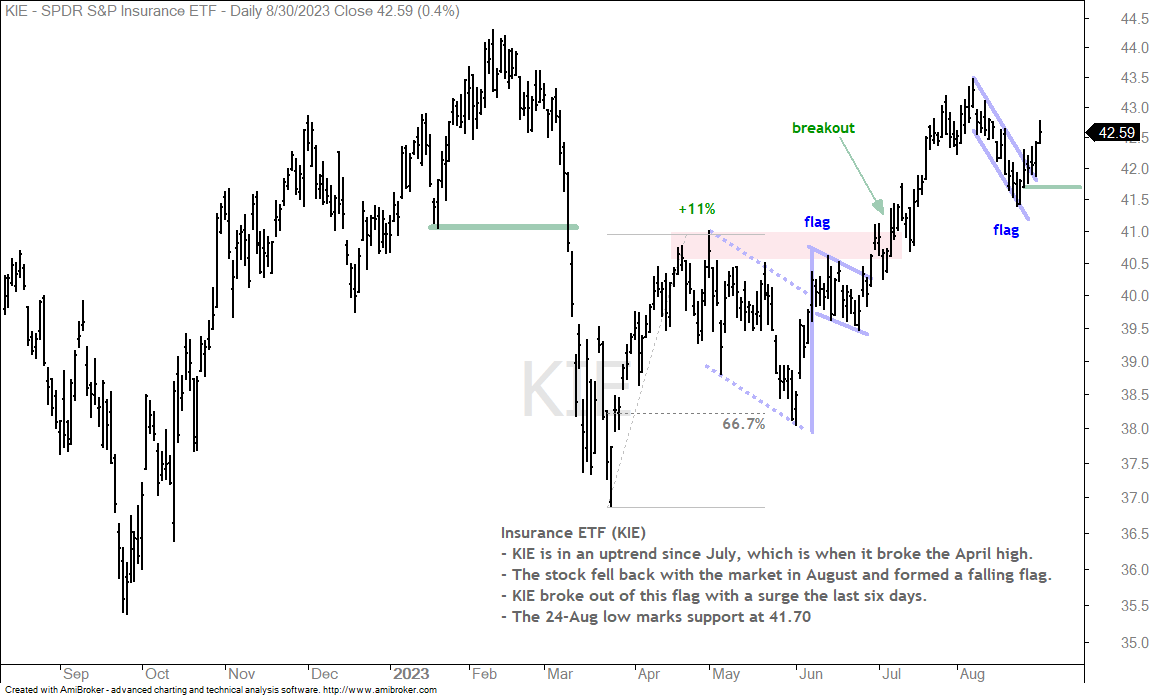
Insurance ETF (KIE)
Transports ETF (IYT)
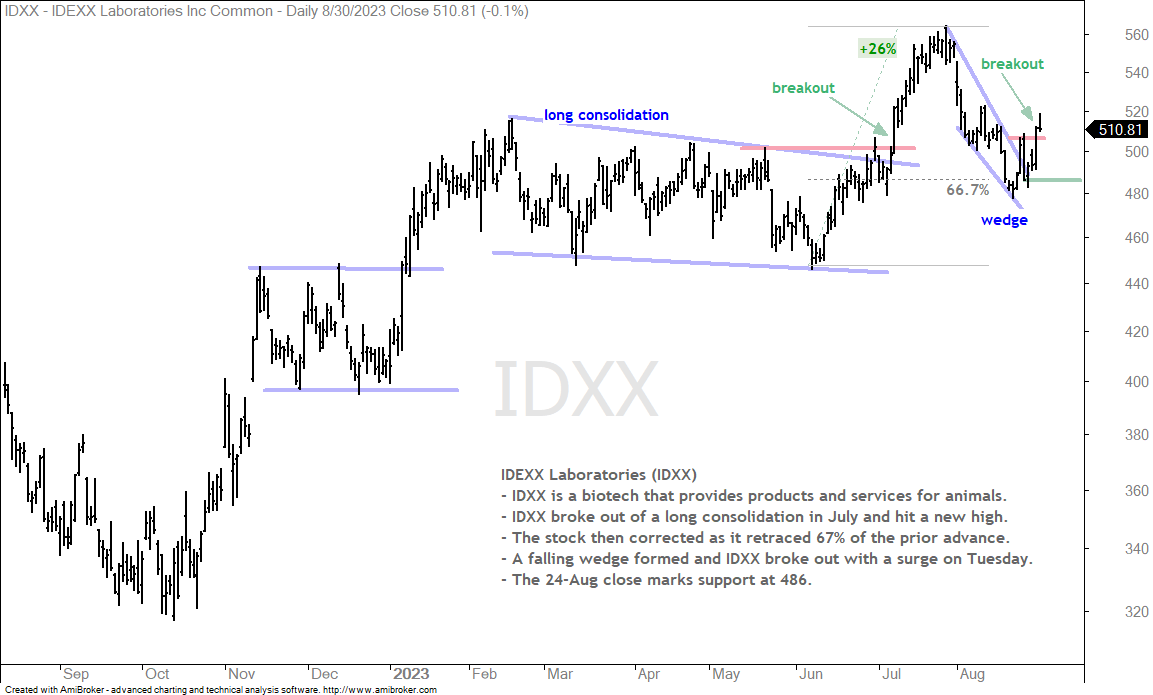
IDEXX Laboratories (IDXX)
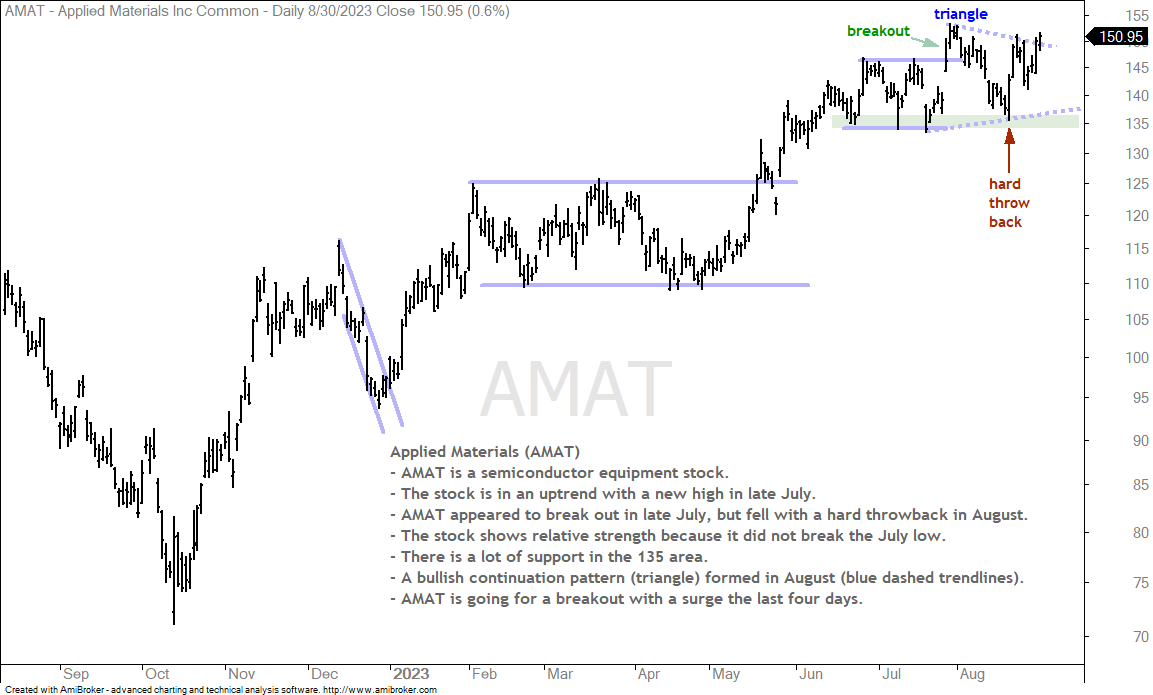
Applied Materials (AMAT)
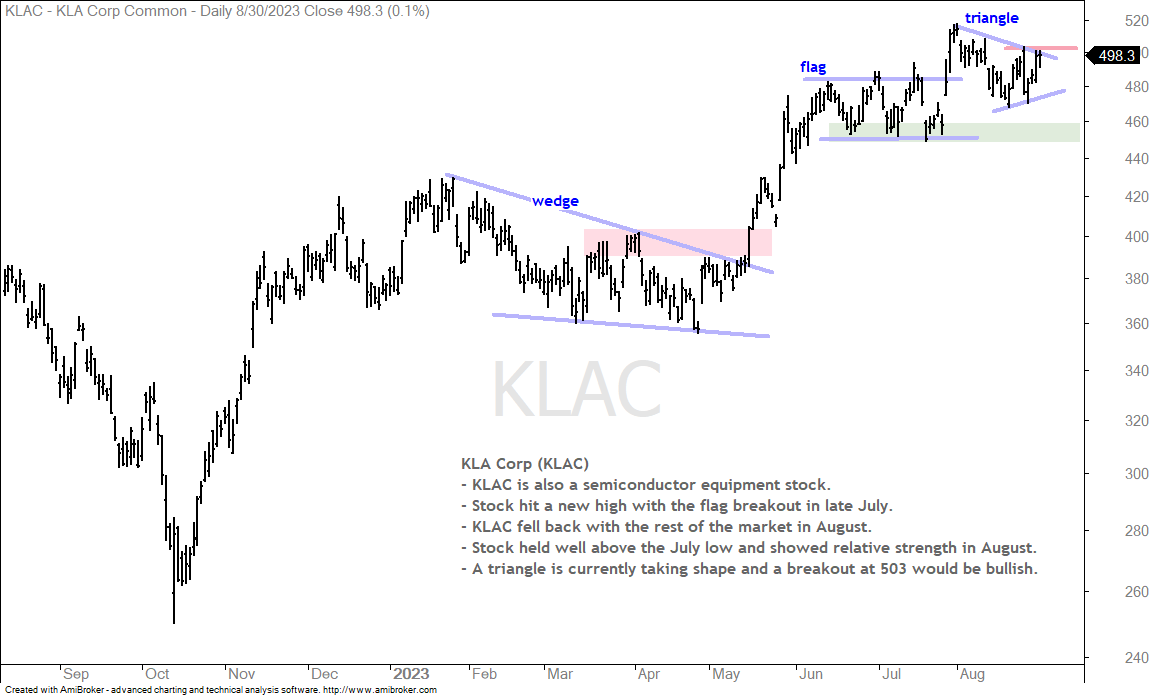
KLA Corp (KLAC)
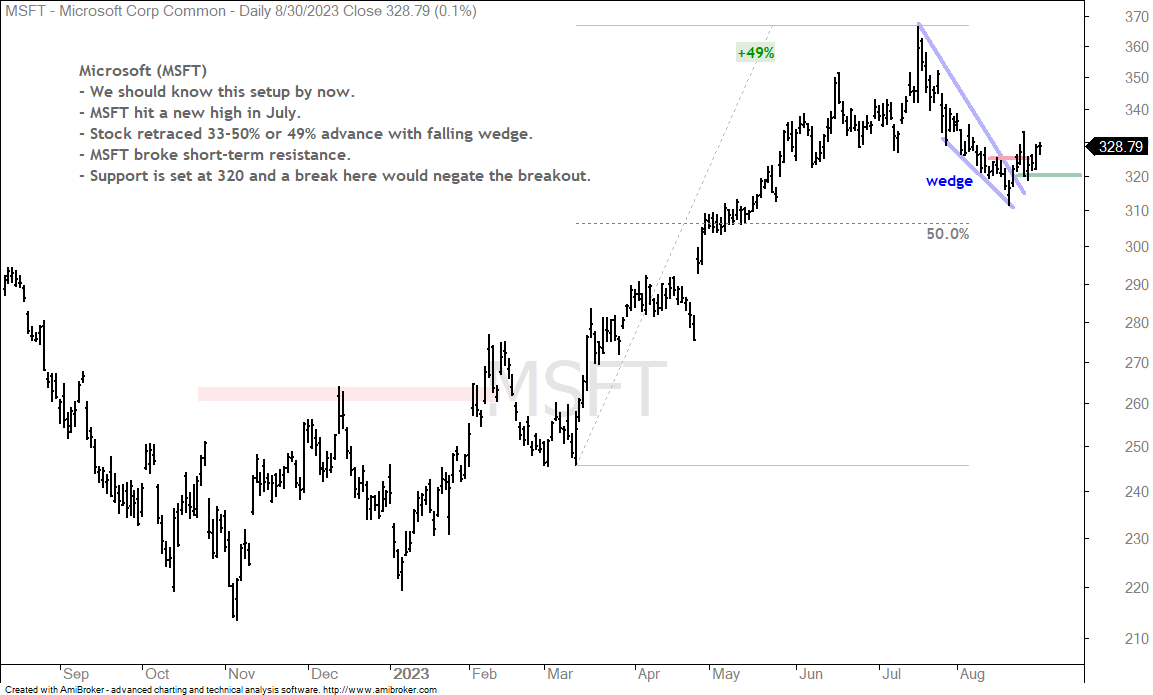
Microsoft (MSFT)
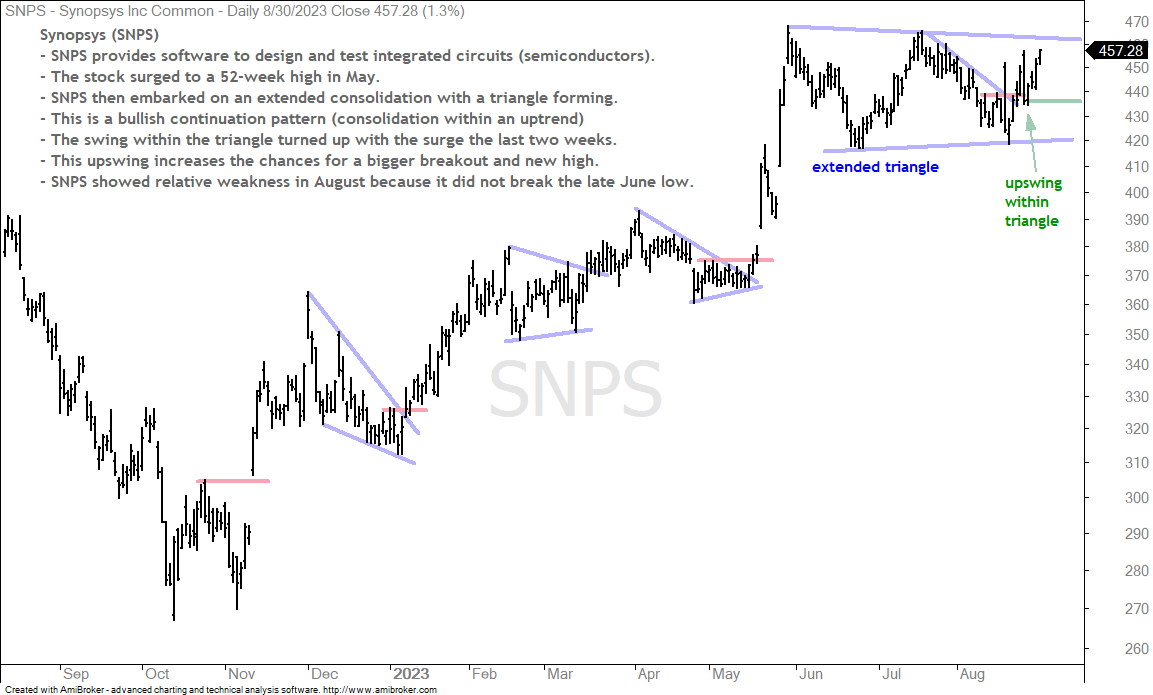
Synopsys (SNPS)
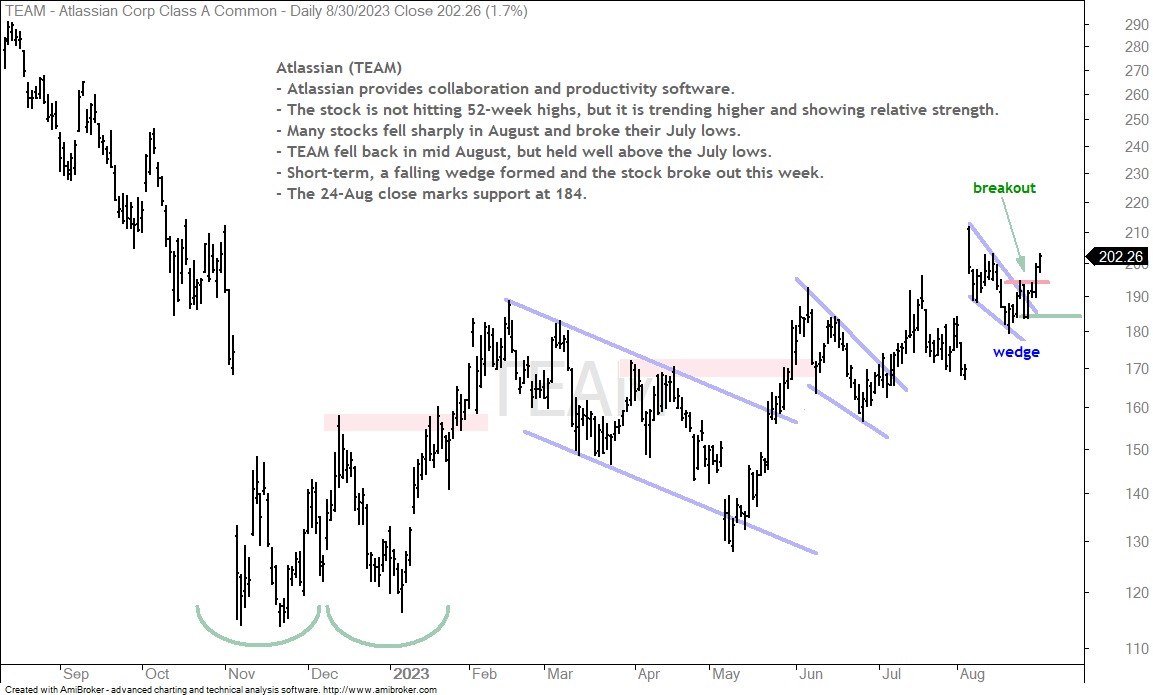
Atlassian (TEAM)
System Trader and Chart Trader
As many of you already noticed, I made some modifications to the main member pages and the offerings. The offerings are split into two: System Trader and Chart Trader. System Trader covers the quantified strategies and signal tables (pure systematic). Chart Trader covers the reports with chart setups, trading ideas and analysis (discretionary).
It takes considerable time to develop new trading strategies. In fact, the time required for strategy development is indefinable. I cannot promise a new strategy every month and do not know when a new strategy will pass rigorous testing. I have a few in the pipeline, but need more development time.
In the meantime, I separated the systematic offering from the discretionary offering. Chart Trader reports and videos will be posted on Tuesdays and Thursdays before 8AM ET. We will cover the major index ETFs for broad market analysis and bring trading ideas for stocks and ETFs.
There are quick access links at the top of the main member pages. “Strategies & Updates” covers the strategy reports and updates. “Signal Pages” contains the signal table pages for the active strategies. “Market Timing” is the market regime page with the Composite Breadth Model, yield spreads and Fed balance sheet. “Chart Trader” contains the reports with chart analysis and trading ideas.
The next Chart Trader report/video will be posted on Tuesday, September 5th.
SPY Breaks Pop-Drop High
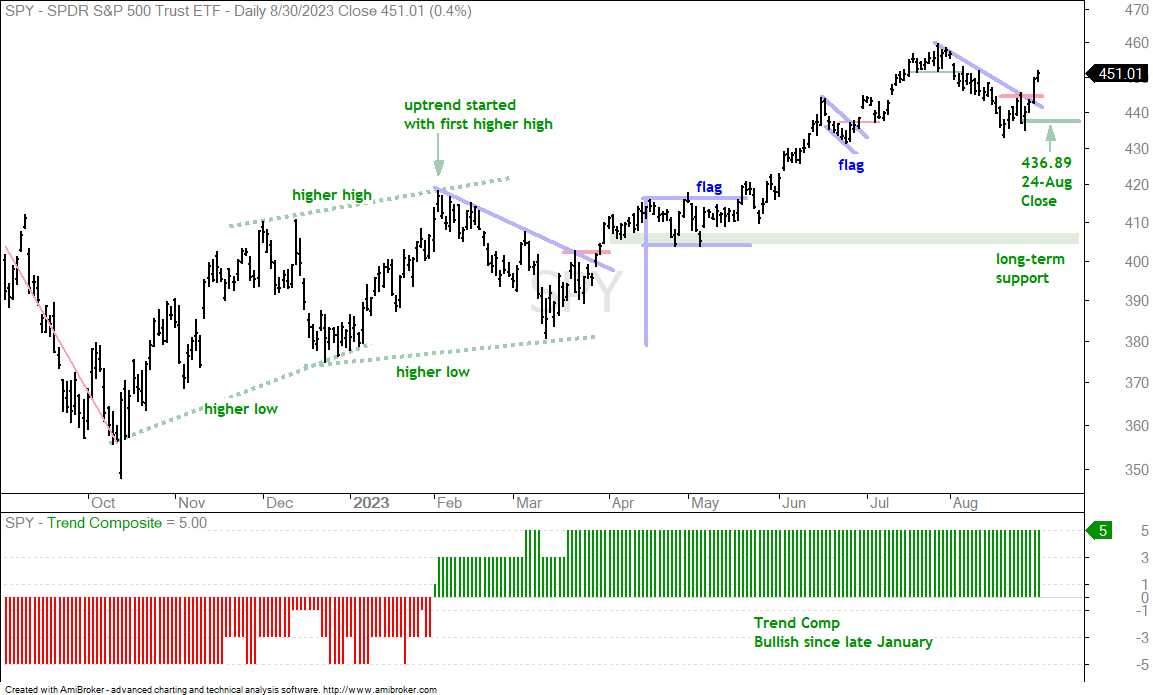
The big trend is the dominant force at work and SPY remains in an uptrend since the higher high in early February. Seasonal patterns, even when strong, are secondary to the bigger trend. Seasonal weakness in September could still materialized, but the market has other ideas right now as SPY broke above the pop-and-drop high from last Thursday. The chart below shows SPY laughing at my pennant prediction on Tuesday. Instead of turning lower, the ETF surged and broke out with a big move the last four days. The breakout zone in the 440-445 area turns first support should we see a throwback. I am marking short-term support at the close on Thursday, August 24th (436.89).
QQQ Breaks Short-term Resistance
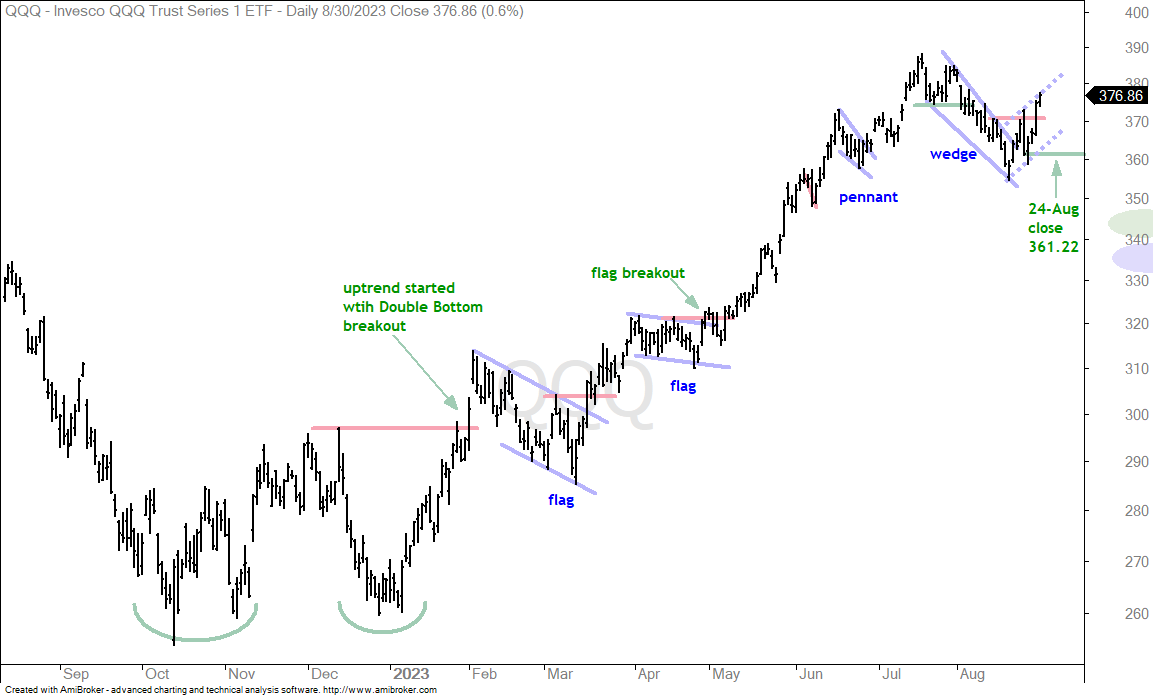
The next chart shows QQQ surging above short-term resistance on Tuesday and triggering a short-term breakout. A re-draw (hindsight analysis) shows a falling wedge correction. The breakout reversed the short-term downtrend with a higher high. As with SPY, I am marking short-term support using the close on Thursday, August 24th (361.22)
Technology SPDR Sums Up the Situation
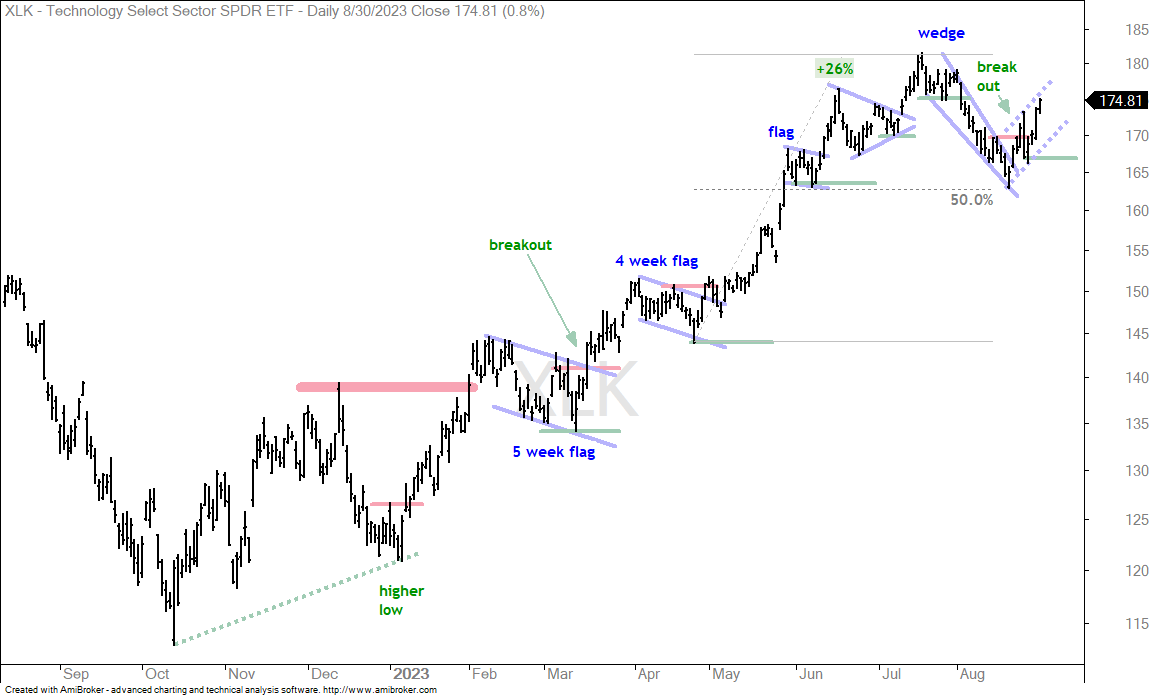
The next chart shows the Technology SPDR (XLK) breaking out of a falling wedge on 23-Aug and extending higher. Also note that this wedge retraced 50% of the prior 26% advance (late April to late July). The pattern and the retracement amount are typical for corrections after big advances. At this point, the long-term trend is up and the wedge breakout reversed the short-term downtrend. As with SPY and QQQ, I will set support using the close on 24-August (167.01). A close below this level would negate the wedge breakout and put the correction back in play. Watch XLK and QQQ closely because most tech-related ETFs will follow their lead.
IWM Reverses Short-term Downswing within Trading Range
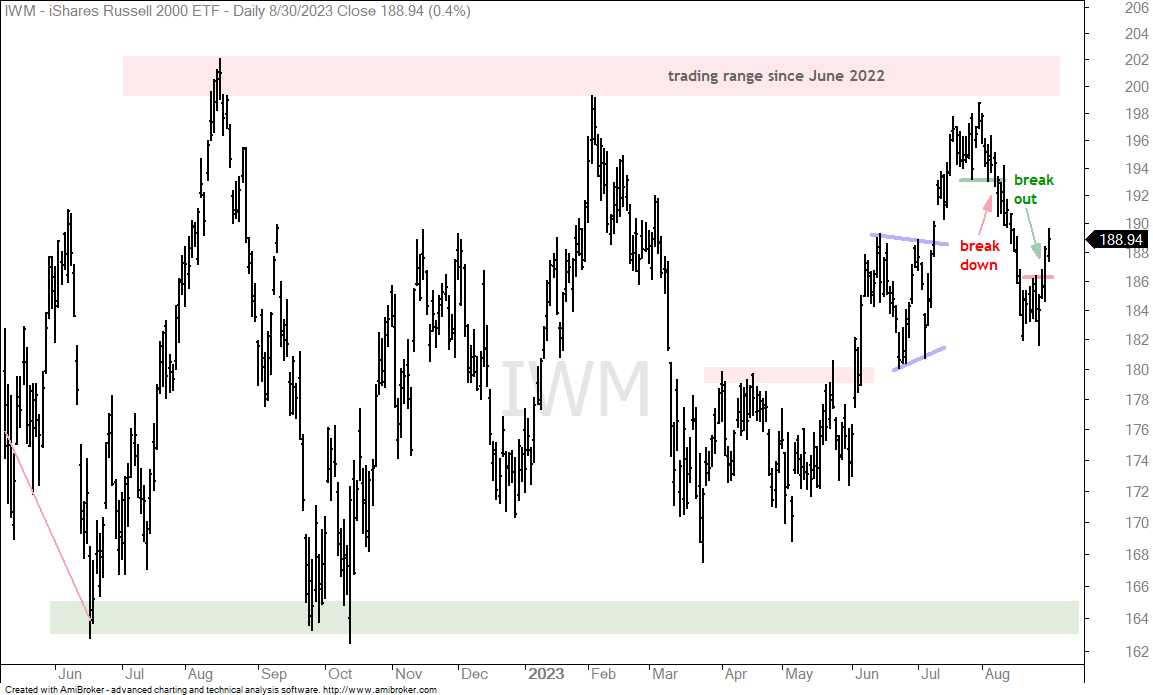
The next chart shows the Russell 2000 ETF (IWM) within a large trading range since June 2022. There is no long-term trend on this chart. IWM is also lagging SPY and QQQ. Short-term, the ETF neared range resistance in late July and fell sharply in August. IWM firmed in the 182 area for a week or so and broke short-term resistance with a surge the last four days.
Leading Groups
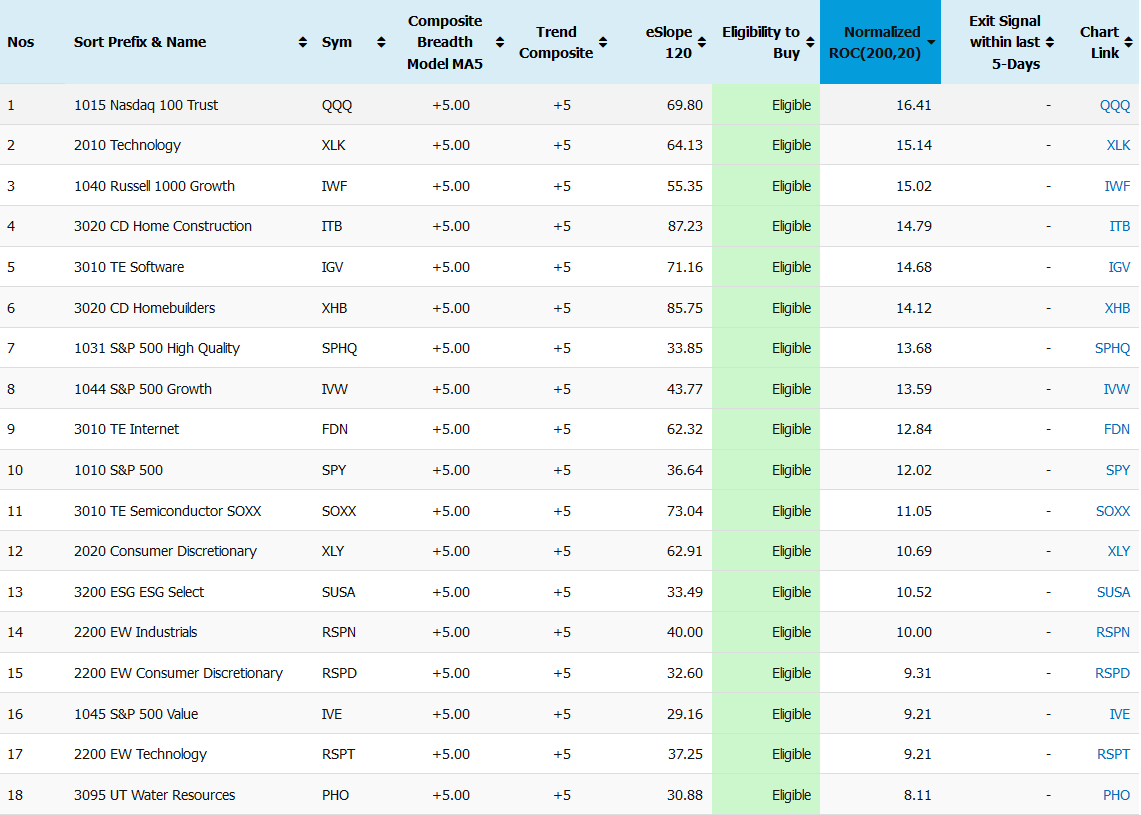
The table below comes from the signal page for the Trend Momo Profit Target Strategy that trades stock-based ETFs. These ETFs are ranked by Normalized-ROC, which is the 200-day point change divided by ATR(20). It basically shows the point change in ATR terms. QQQ is leading because it is up 16.41 ATR values over the last 200 days. The other leading groups are Technology (XLK), Growth (IWF), Housing (ITB), Software (IGV), Internet (FDN), Large-caps (SPY), Semis (SOXX), Consumer Discretionary (XLY) and Water (PHO).