
")

Even though trading based on chart analysis involves some discretionary decisions, chartists can improve the odds of success by systematizing their process. This report will show four prerequisite filters based on a top-down approach. We will start with the broader market, look at the sector, and then apply two qualifying filters to the stock. First, I would make sure
Four Prerequisites to Improve Your Odds – A Live Example (Free) Read More »

The iShares Semiconductor ETF (SOXX) is lagging the VanEck Semiconductor ETF (SMH) as it broke the 200-day SMA and confirmed a bearish pattern. SMH is holding up because its top component remains strong. Nevertheless SMH is at a moment of truth ahead of a big earnings report from Nvidia.
A Tale of Two Semiconductor ETFs – Why is SOXX Weaker than SMH? (Free) Read More »

There is only one way to trade in a long-term uptrend: long. Forget about picking tops and breaks below short-term moving averages. Leaning bearish within a long-term uptrend is not a profitable strategy. Instead, we should lean bullish and use oversold conditions to our advantage. In a long-term uptrend, I am only interested in
Finding and Trading Oversold Conditions within Long-term Uptrends (Free) Read More »

The Cybersecurity ETF (CIBR) is resuming the lead as it surged to new highs this past week. It is important to note that CIBR began its leadership role a lot earlier because it hit a new high in late August. Today’s report will analyze the recent breakout and suggest some possibilities in the future.
Cybersecurity ETF Comes to Life with New Trending Phase (Free) Read More »

Extended trends often start with big bangs and major breakouts. Chartists can identify “big bang” moves by showing price change in ATR terms. We can use the price charts to identify big breakouts. Today’s example will show
It all Started with a Big Bang! (Free) Read More »

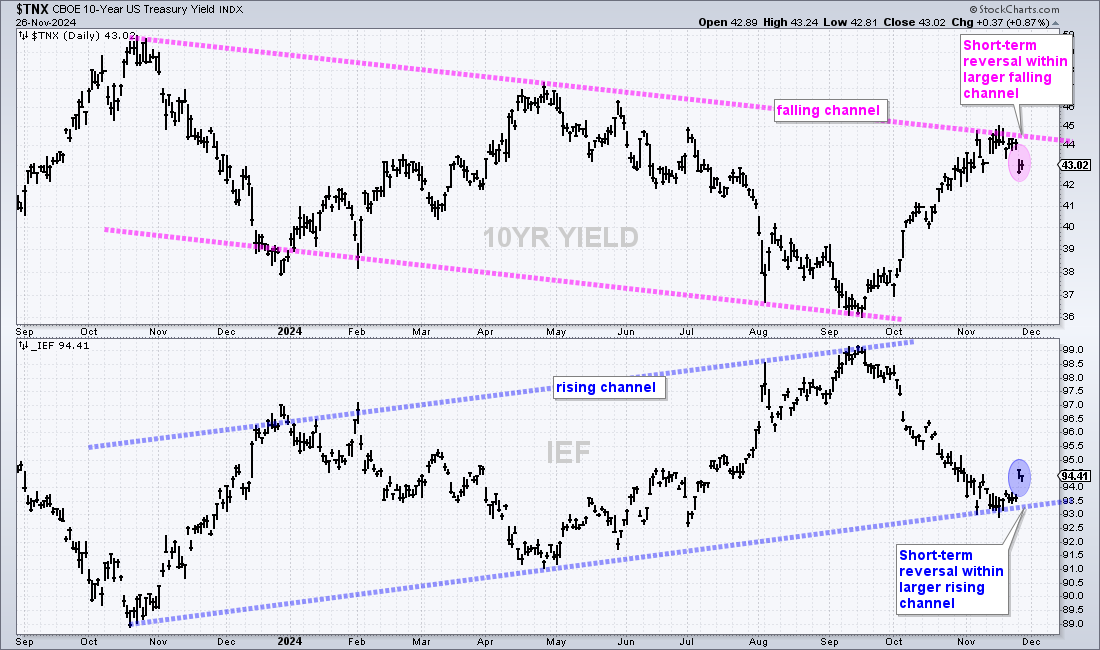
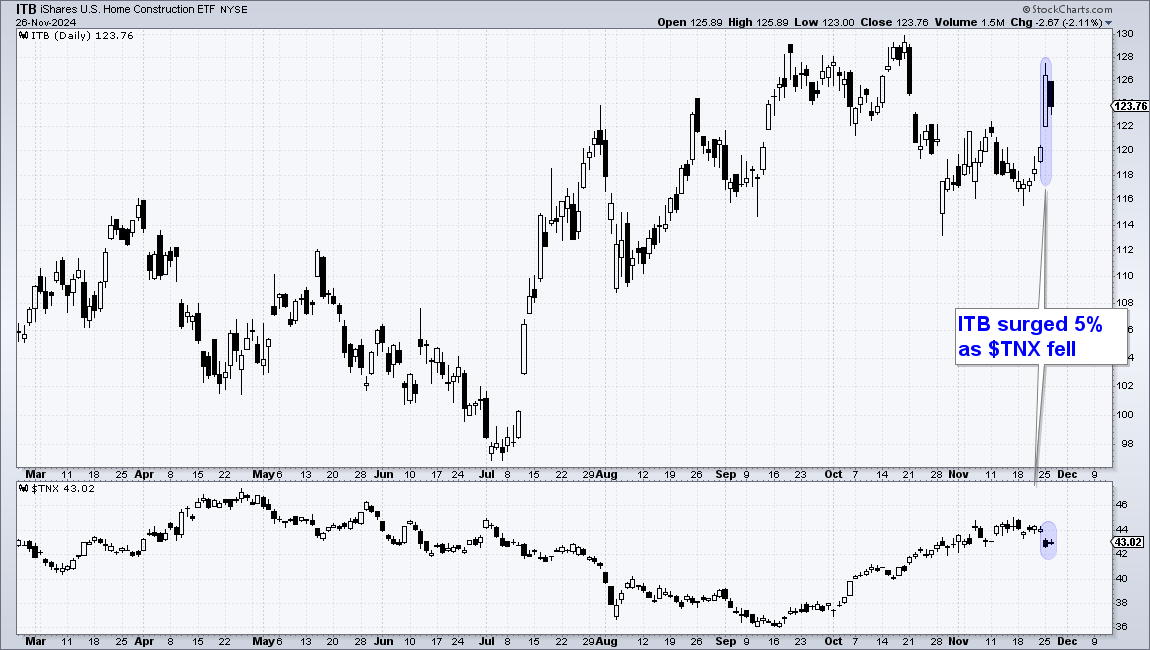
The Home Construction ETF (ITB) is leading the market as it surged to a new closing high this week. While this high is certainly bullish and points to upside leadership, the real signal triggered back in early July as the Trend Composite turned bullish with an outsized move. Let’s review this signal and then look at a recent signal in
This Housing-Related Stock Just Printed a 5 for the Trend Composite Read More »

The 20+ Yr Treasury Bond ETF (TLT) is turning the corner as a long-term trend indicator turns bullish and price extends on a breakout. TLT is also starting to outperform the S&P 500 EW ETF (RSP), for the first time in a long time.
TLT Turns the Corner and Starts to Lead Read More »

QQQ is leading the market lower and weighing on tech stocks. The long-term trend is up and oversold breadth could present an opportunity. Short-term breadth has yet to become oversold and this means we may have further downside first.
This Breadth Indicator Points to More Downside – And a Potential Opportunity Read More »

After a big run this year, Nvidia (NVDA) fell over 15% from its high and broke its 50-day SMA. On the face of it, a break below this “key” moving average seems like a short-term bearish signal. Such a view, however
Nvidia Breaks the 50-day SMA – Is this a Threat or an Opportunity? Read More »

Small-caps took the lead over the last two weeks with the S&P SmallCap 600 SPDR (IJR) surging over 10% in five days and hitting a new high. IJR also broke out of a long consolidation and this breakout is bullish. There are now three possibilities going forward
Small-caps Break Out and Lead – Now What? Read More »

The broader market is fairly mixed with one clear leader: technology. I am also seeing mixed performance within the technology sector and within specific groups. Semiconductors are strong overall, but groups like cybersecurity
Finding Emerging Leaders within Key Groups Read More »

Chinese stocks wet on a tear from mid April to mid May with the China Large-Cap ETF (FXI) gaining some 40% and breaking its 200-day SMA. FXI then fell back over the last few weeks. This surge and pullback created a potential opportunity because some stocks
Alibaba Returns to the Scene of the Crime Read More »

Traders can improve their odds by ignoring distraction signals and focusing on setups with real potential. In general, short timeframes are better suited for mean-reversion, while long timeframes
Differentiating between Short-term Distractions and Setups with True Potential Read More »

There is a certain ebb and flow in uptrends. Often we see some sort of stair step higher with big advances and smaller corrections along the way. In Dow Theory terms, the primary trend is up and declines within a primary uptrend are
Bitcoin Sets Up with Classic Continuation Signal – Part 1 Read More »

After sharp declines into mid April, stocks rebounded over the last three weeks and the S&P 500 SPDR (SPY) came within 1% of its March high. This March high acts
Six Leaders, but One Is Getting Real Frothy Read More »

Stocks fell sharply into late April and then rebounded over the last two weeks. SPY fell 5.34% from March 28th to April 19th and then rebounded with a 3.26% gain the last two weeks. Does this bounce have legs? Chartists can separate
Is this a Dead-Cat Bounce or a Bounce with Legs? Read More »

Trends often start with outsized moves. But how do we measure and identify such moves? Chartists can measure moves in Average True Range (ATR) terms using the ATR Trailing Stop SAR indicator (ATR-SAR). ATR is a volatility indicator developed by Welles Wilder.
Using Outsized Moves to Identify Trend Reversals – Checking in on ITB and SOXX Read More »
The 20+ Yr Treasury Bond ETF (TLT) failed again at the falling 40-week SMA and looks poised to resume its bigger downtrend. Keep in mind that bonds and yields move in the opposite direction. A resumption of the
20+ Yr Treasury Bond ETF Resumes its Downtrend Read More »

The Oil & Gas Equipment & Services ETF (XES) is showing strength here in March as it breaks back above its 40-week SMA. More importantly, the long-term trend is up and this week’s breakout argues for a continuation of this uptrend.
Oil & Gas Equipment & Services ETF Resumes its Uptrend Read More »

As its name suggests, the ATR Trailing Stop is normally used to trail a stop-loss for a long position. It can also be used to identify an outsized decline that could reverse an uptrend. Today’s example will show how to apply the ATR Trailing Stop on
Using the ATR Trailing Stop to Manage the Trade and Define the Trend Read More »