Our Premium Services include reports to identify leading trends and bullish corrections.
Current Analysis/Videos – These reports focus on stocks and ETFs with strong uptrends, relative strength and tradable setups. We focus on bullish continuation patterns, breakouts and oversold conditions to trade with the trend.
Market Regime Charts – These reports keep you on the right side of the market. Our charts define the broad market environment using long-term breadth indicators. We also cover an array of thrust and sentiment indicators to time market movements.
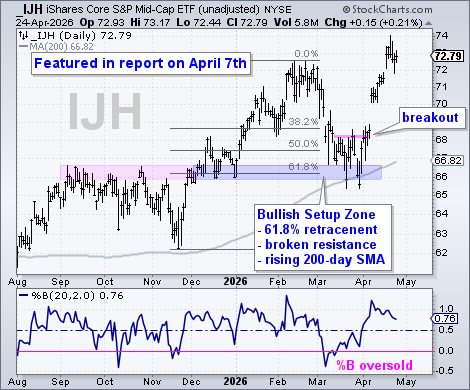
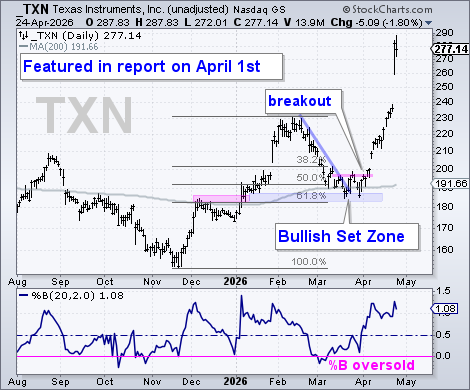
Research & Education – Our research reports explain indicators and trading strategies with real-world examples. When possible, we test these signals and provide performance metrics. Recent reports explained the technical requirements for a Bullish Setup Zone. This is an area to watch for a reversal after a pullback within a long-term uptrend.
Our Premium Services include systematic strategies, signals and ranking tables.
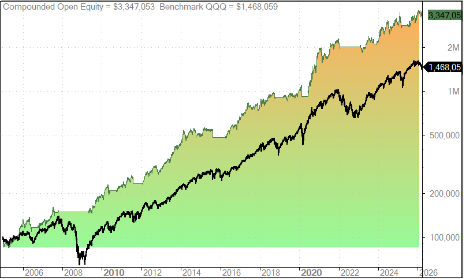
Systematic Strategies – To complement our chart analysis, we also offer fully automated rules-based strategies. These strategies use trend and momentum to rotate into the strongest names within the Nasdaq 100, S&P 500 and our all-weather ETF universe.
NDX Rotation Strategy 2005 to 2026 Compound Annual Return 17.96% Max Drawdown: 21.61%
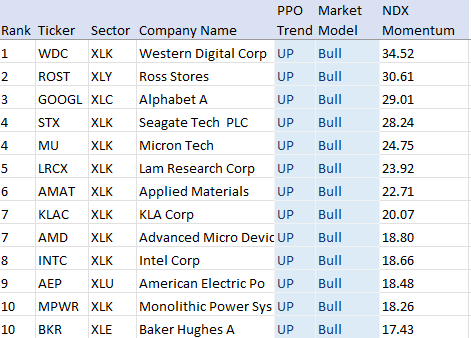
Nasdaq 100 Stocks: Trend and Rank
Signals & Ranking Tables – The systematic strategies trade weekly with signal updates every Saturday. These updates include ranking tables based on volatility-adjusted momentum, which ensures that risk is being adequately rewarded. Universes covers the Nasdaq 100, S&P 500 and ETFs.
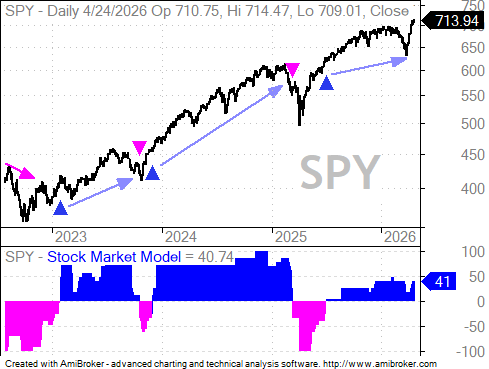
Stock Market Model (SSM) – The SSM quantifies stock market conditions using 25 indicators to distinguish between bull markets (risk-on) and bear markets (risk-off). The systematic strategies trade stocks and equity ETFs only in bull markets. SPY Performance Since 2005: Compound Annual Return = +7.63, Max Drawdown = -17.72%, Win Rate = 78%
Bonus 1: Improving Performance for 200-day SMA – This invaluable report shows how to reduce whipsaws and improve returns using SPY and the 200-day SMA. We also offer a performance enhancing twist for QQQ.
Bonus 2: V Reversals – Capitulation, Surge and Broadening – This report explains the market sequence that starts with capitulation to exhaust selling pressure, a breadth thrust to forge a bottom and broadening participation to signal a bull market.
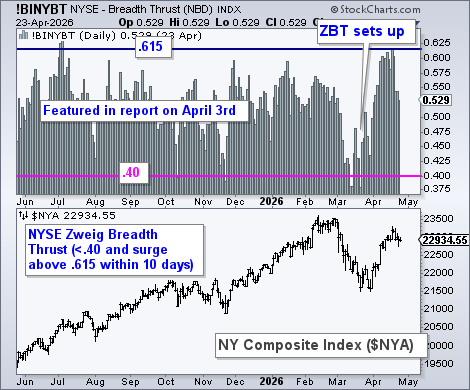
Bonus 3: Three Breadth Thrust Indicators (including Zweig) – A Zweig Breadth Thrust triggered on April 24th. This signal was widely reported, but without an exit strategy. We published a research report showing past signals and detailing an exit strategy.
Bonus 4: ETF ChartList – There are 1000s of ETFs, but many are redundant and/or thinly traded. We narrowed the universe down to 74 core ETFs that cover all areas (equities, bonds, commodities and crypto).
Disclaimer: This information is issued solely for informational and educational purposes and does not constitute an offer to sell or a solicitation of an offer to buy securities. None of the information contained on this blog constitutes a recommendation that any particular security, portfolio of securities, transaction, or investment strategy is suitable for any specific person. From time to time, the content creator or its affiliates may hold positions or other interests in securities mentioned on this blog. The stocks presented are not to be considered a recommendation to buy any stock. This material does not take into account your particular investment objectives. Investors should consult their own financial or investment adviser before trading or acting upon any information provided. Past performance is not indicative of future results.