
")

Today’s weekend video starts with the indicators that make up the breadth model and their individual signals. We then add some basic market timing and show the model signals over the last 20 years. I will also provide a preview of a short-term breadth model. Attention then turns to potential reversals in SPY and TLT, the rising wedges in RSP and IWM, the StochClose rankings and the ChartBook
Weekend Video – Breadth Model Indicators, the SPY/TLT Reversals and the ChartBook Read More »
Stocks took it on the chin Thursday with the biggest weekly decline since declines began (March). Once again, small-caps and mid-caps led the way lower with outsized declines. Even more disconcerting, we saw outsized declines in some key large-cap sectors as the Consumer Discretionary SPDR fell over 5%, the Industrials SPDR fell over 8% and the Finance SPDR fell 7%.
Timing Models – Here we Go Again – Models Flip as Outsized Declines Hit Key Areas Read More »
The broader environment for stocks is technically bullish, but risk remains well above average. The S&P 500 moved above its 200-day SMA and the 5-day SMA moved above the 200-day SMA. The %Above 50-day SMA indicators surged above 80% to trigger bullish and the Index Breadth Model based on StockCharts data triggered bullish on June 5th with five of nine indicators on bullish signals. That’s the bullish part.
ETF Ranking and Grouping – Volatility and Risk Remain High as Bonds and Gold Perk Up Read More »
It was a big week on Wall Street as stocks surged with the biggest weekly gains since the initial lift off started (late March and early April). Small-caps and mid-caps led the way with gains exceeding 8%. Large-caps lagged as SPY gained a measly 5% and QQQ advanced a paltry 2.71%. These moves triggered

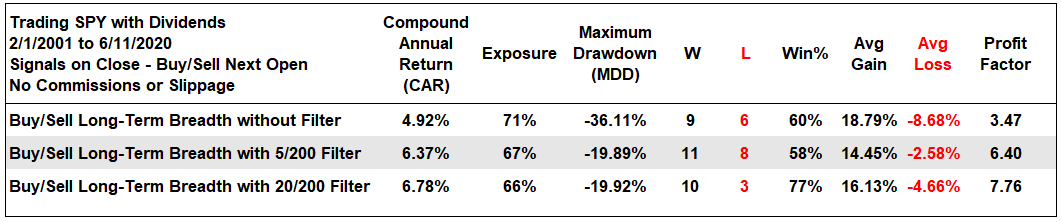
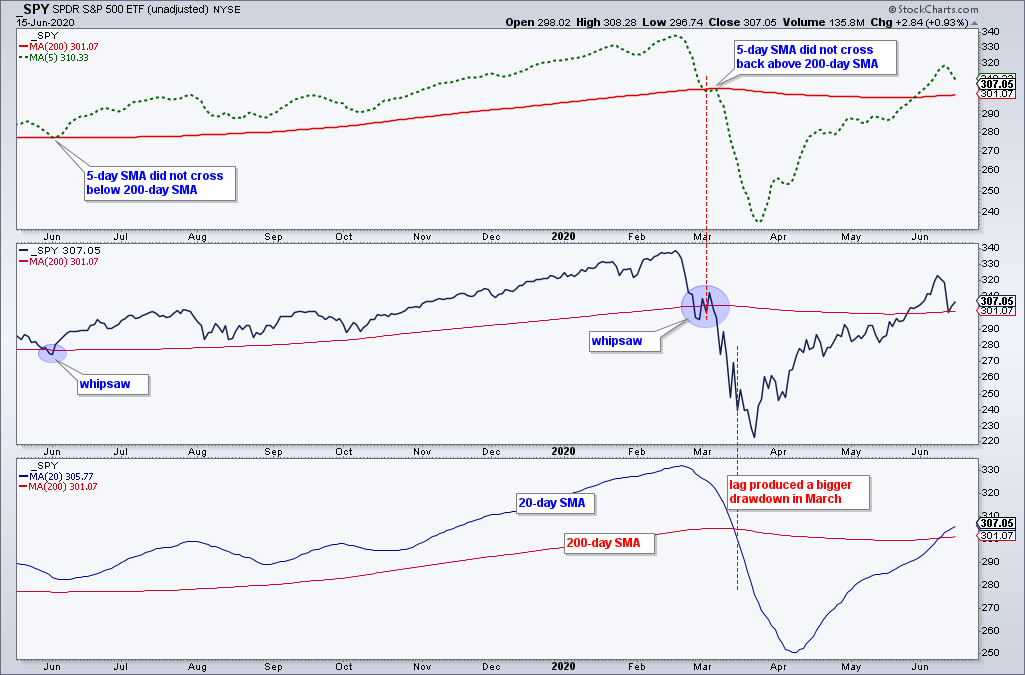
The market is a forward looking beast and we are seeing some pretty strong signals from short-term and medium-term breadth indicators. The long-term breadth indicators, however, are still lagging and have yet to trigger. Today I will put a medium-term breadth model to the test and show how to improve results with a simple timing mechanism.
Before looking at the ETF rankings and charts, note that the S&P 500 closed above its 200-day SMA at the end of May and this signaled the all clear for some trend-following and momentum strategies. Many trend-following and momentum strategies are only active when the S&P 500 is in a long-term uptrend because
ETF Ranking and Grouping – More Uptrends and More Overbought Readings Read More »

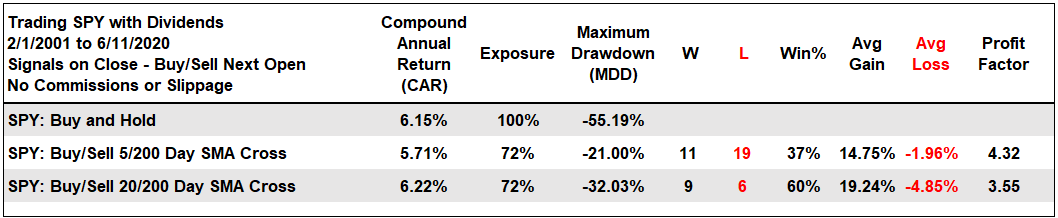
Today’s video will start with a 16+ year backtest of a slightly modified version of the Index Breadth Model. These results will be compared to buy-and-hold and a 5/200 cross for the S&P 500 SPDR. I will then review the current signals in the StockCharts breadth indicators. The upswing since late March dominates right now so
Weekend Video – Short-term Breadth Indicators to Watch, ChartBook and Yield Spreads Read More »
Today we will dive into breadth indicators and test a modified version of the Index Breadth Model here at TrendInvestorPro. First, however, I will review the S&P 500 SPDR as it toys with its 200-day SMA here at month end. In particular, I am monitoring upswings in four key major index ETFs. After the breadth dissertation
Market Timing Models – Backtesting Breadth Signals and Focusing on the Big Swings Read More »
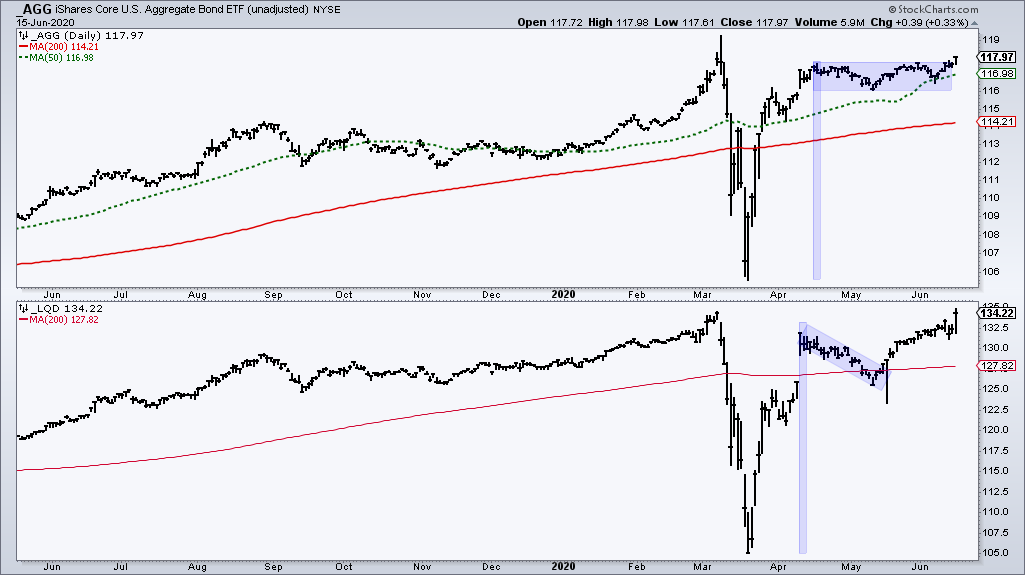
We are seeing some rotation in the market as the leaders stall and the laggards get in gear. The leaders from mid March to mid May lagged over the last two weeks, while the laggards from this period led. ETFs related to bonds, gold, healthcare and technology led the market during the rebound period and were the first to move back above their 200-day SMAs
ETF Ranking and Grouping – Rotation Takes Hold as Flag Breakouts Extend Read More »
The S&P 500 is at a moment of truth and the direction it takes will have ramifications throughout the stock market. Today we will review the indicators in the Index Breadth Model, show that the large-cap Bullish Percent Indexes are holding up better and cover the rising High-Low Lines. I will then turn to the QQQ effect on SPY and look at recent signals in SPY
Weekend Video – Breadth, Flags, Narrow Ranges, the QQQ Effect and the ChartBook Read More »
The market, as measured by the S&P 500 SPDR, is at make or break level. Analysts love to talk about key levels and it seems that there is a new “key” level every week if you watch the wrong news outlets. Well, the S&P 500 is at a key level that we should watch closely. The long-term trend remains
Market Timing Models – This Really is a Make or Break Level Read More »
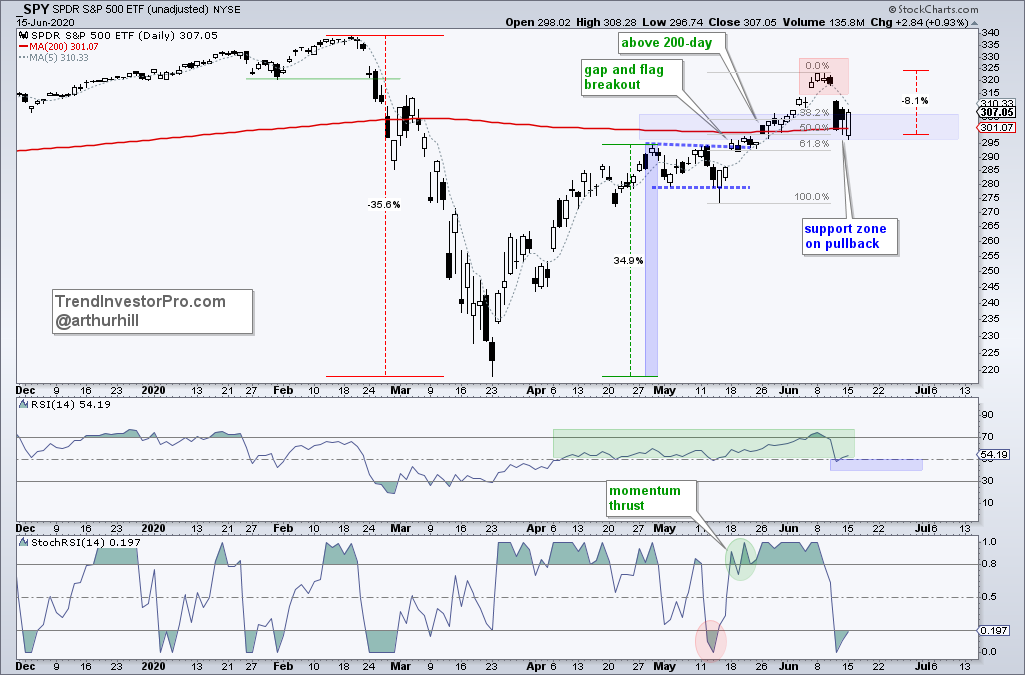
Several key ETFs broke down last week and then recovered with big gap-surges on Monday. SPY was also seemingly on the verge of a breakdown, but snapped back with a gap and flag breakout. Today’s charts are littered with gaps and flag/pennant breakouts so we will focus on these.
ETF Ranking and Grouping – From Breakdowns to Breakouts Read More »

Stocks surged on Monday with QQQ closing at its highest level since February 21st, SPY closing at its highest level since March 6th and IWM closing at its highest level since April 29th. And there you have the pecking order. QQQ is back to late February levels, SPY is back to early March levels and IWM has yet to exceed its April high. To record a 52-week high
What Drives SPY?
Hint: It has 3 Letters and Begins with Q Read More »
Topics covers in today’s video: top ranked ETF by StochClose, short-term signals in two breadth indicators, small-caps and banks lead lower, Fed balance sheets expands as junk bond spreads widen, short-term support levels to watch going forward, gold breaks out, junk bonds remain weak and TLT bounces off support.
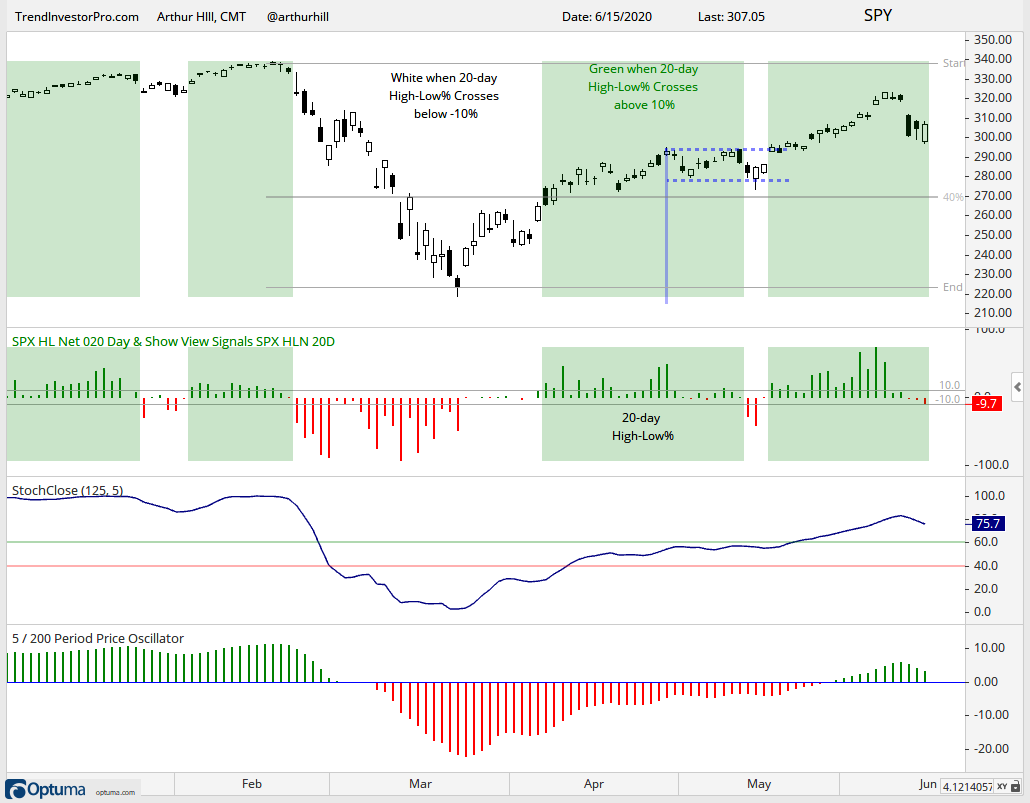
Today’s report will start with the everywhere and nowhere chart for the S&P 500. We will then weigh the broad market evidence by looking at the weekly RSI range, the S&P 500 Bullish Percent Index and the breadth models. Short-term, the 20-day High-Low Percent indicator triggered a signal on Wednesday’s close and we are seeing short-term breaks in three key equal-weight sectors.
Market Timing Models – The Big Three Sectors versus the Three Next Biggest Sectors Read More »
Tech and Healthcare led the market higher over the last eight weeks and these two groups are still holding up, as are their related ETFs. Despite leading, note they fell short of their February highs and could still be vulnerable to broad market weakness. Correlations tend to rise in bear market downturns. Some of the lagging groups are already breaking down, such as industrials and finance, and the SPY is also breaking down.
ETF Ranking and Grouping – Weakest ETFs Already Breaking Down Read More »

This is an update for the big three major index ETFs: SPY, QQQ and IWM. Stocks started strong on Tuesday, but ran into selling pressure and bearish candlestick patterns formed. SPY and IWM are in long-term downtrends and showing signs of weakness near key retracements. QQQ remains stronger, but I still think the big surge is a counter-trend bounce.
Update for the Big Three: SPY, QQQ and IWM Read More »
Today’s video starts with an overview of monthly seasonality and the equity curves for each month over the last 30 years. We then dive into the Index Breadth Model charts and show how the average stock in the S&P 500 is still struggling. I then look at SPX 20-day High-Low% and show the key levels to watch for SPY going forward. We finish with a ChartBook overview and StochClose rankings.
Weekend Video – Seasonality, Breadth, Short-term Uptrend and ChartBook Read More »
Today’s report shows that the S&P 500 equal-weight index has underperformed the S&P 500 since 2017 and the performance differential surged over the past year. Moreover, the average stock in the S&P 500 is still struggling. We also have an important bearish signal in the Sector Breadth Model and continued weakness in three key sectors.
Market Timing Models – Three Big Sectors are Dragging – Could Tech Be Next? Read More »
In broad terms, it is a tale of three markets. First, we have a few ETFs near new highs, in clear uptrends and leading. Second, we have ETFs that are above their 200-day SMAs with above average retracements (>61.8%). Despite relative strength, these ETFs remain below their February highs. Third
ETF Ranking and Grouping – A Split Market with Leadership in the Biggest Groups Read More »