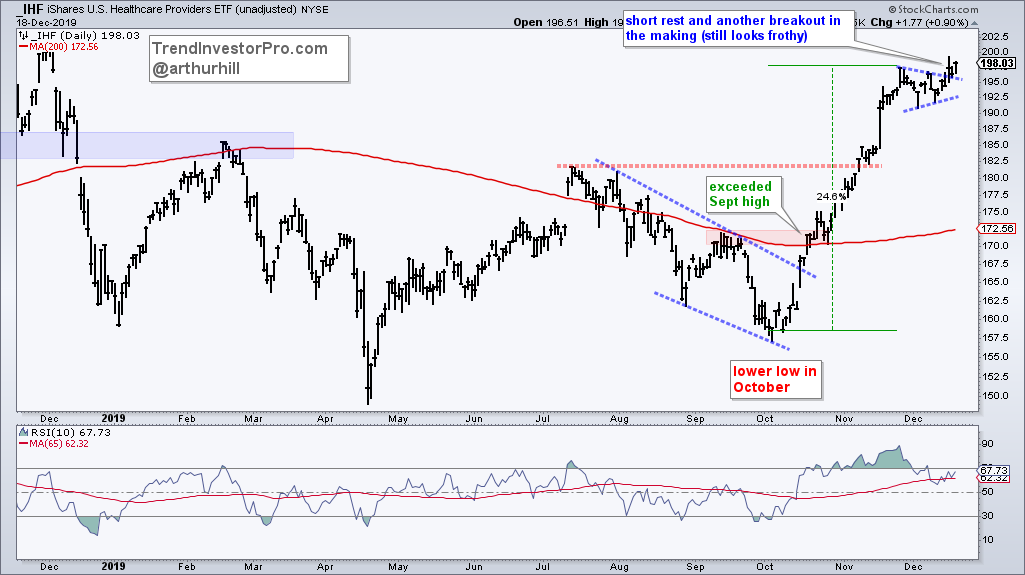
1) Leading Gainer, 52-week High and Overextended
XLV, IBB, IHF, XBI
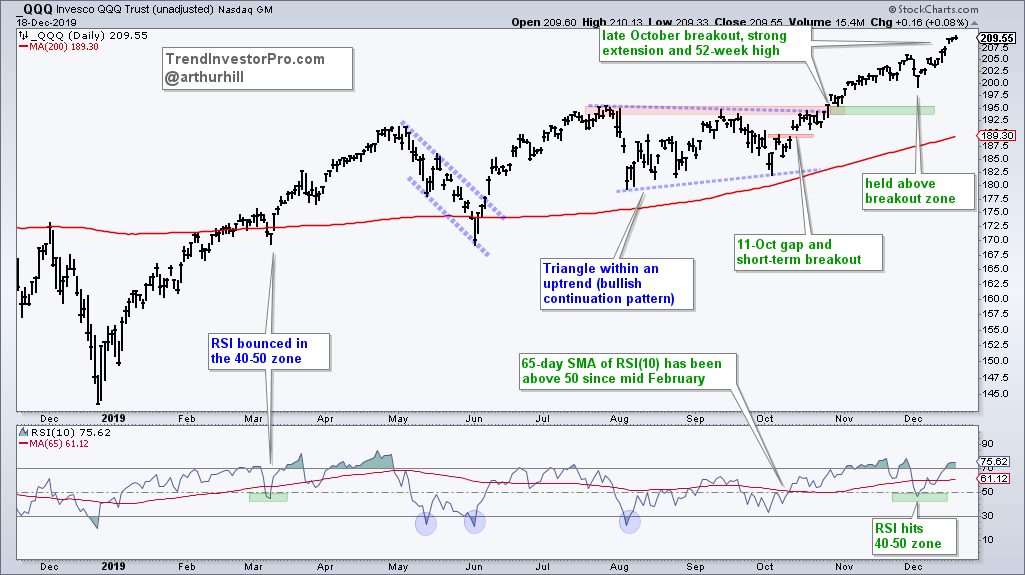
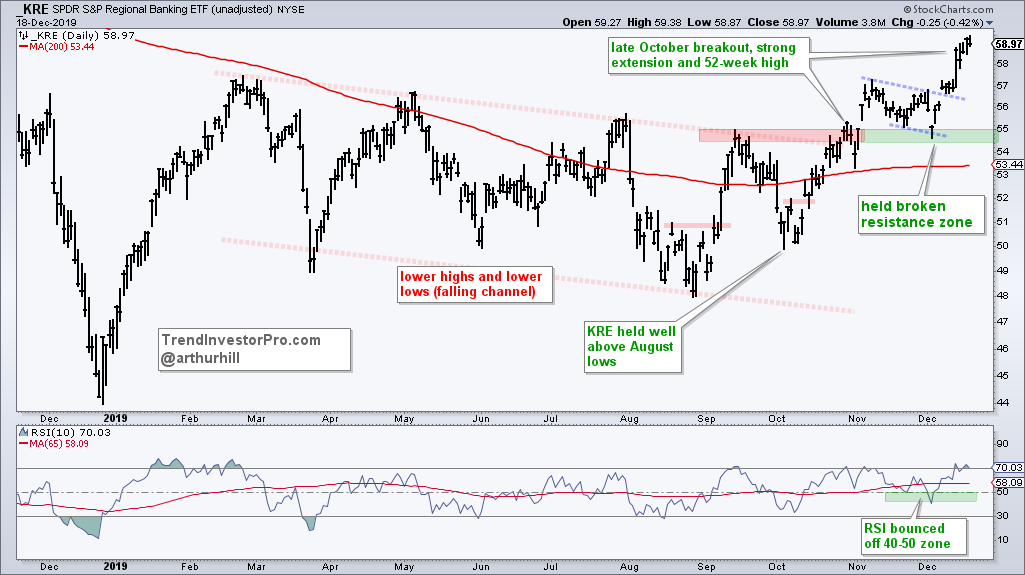
2) October Breakout, Strong Extension and 52-week High
SPY, QQQ, XLK, XLF, SOXX, KBE, KRE, EFA, BOTZ, IEMG
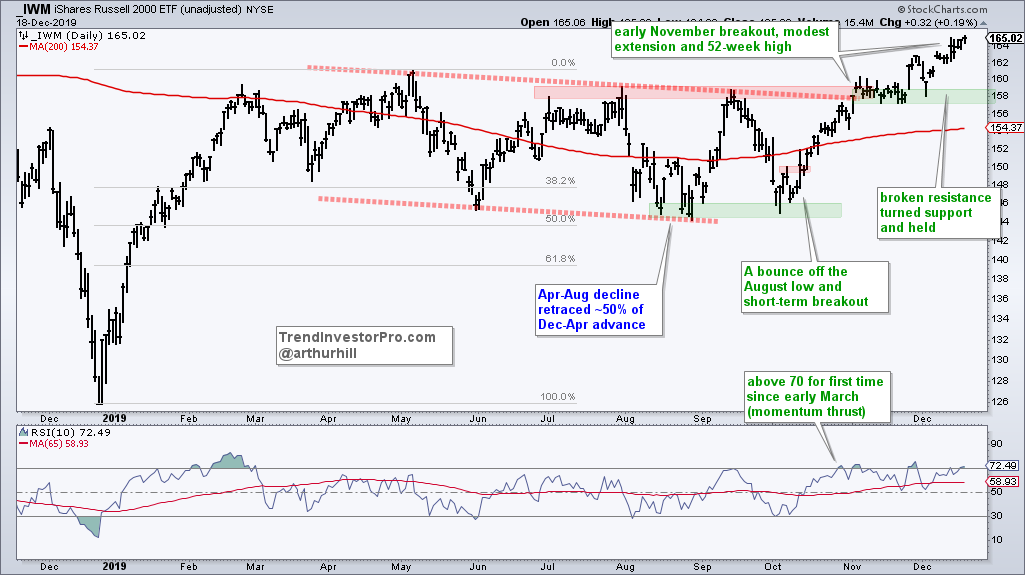
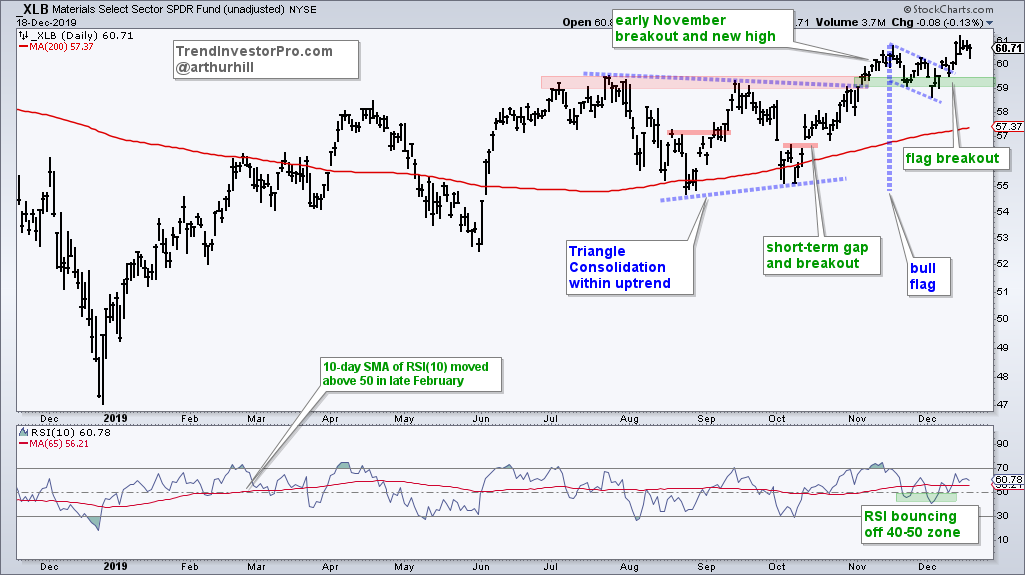
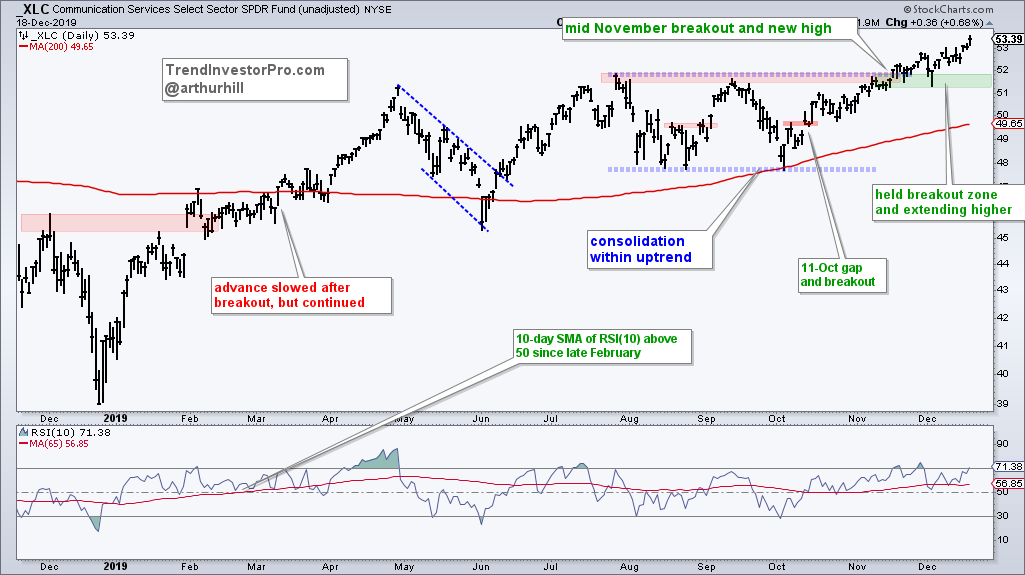
3) Early November Breadth, Modest Extension and 52-week High
IJR, IWM, MDY, RSP, XLB, IHI, XLC
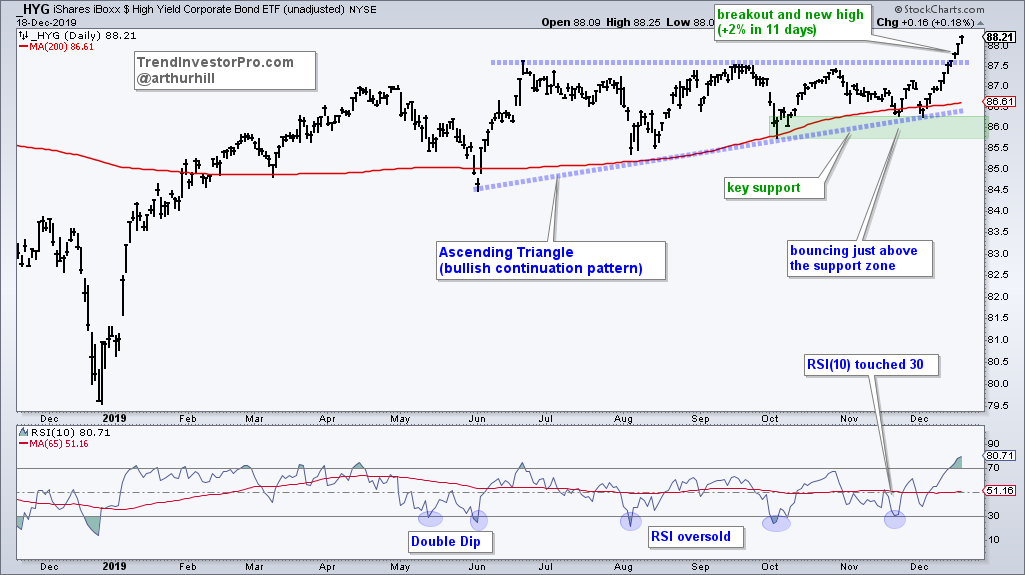
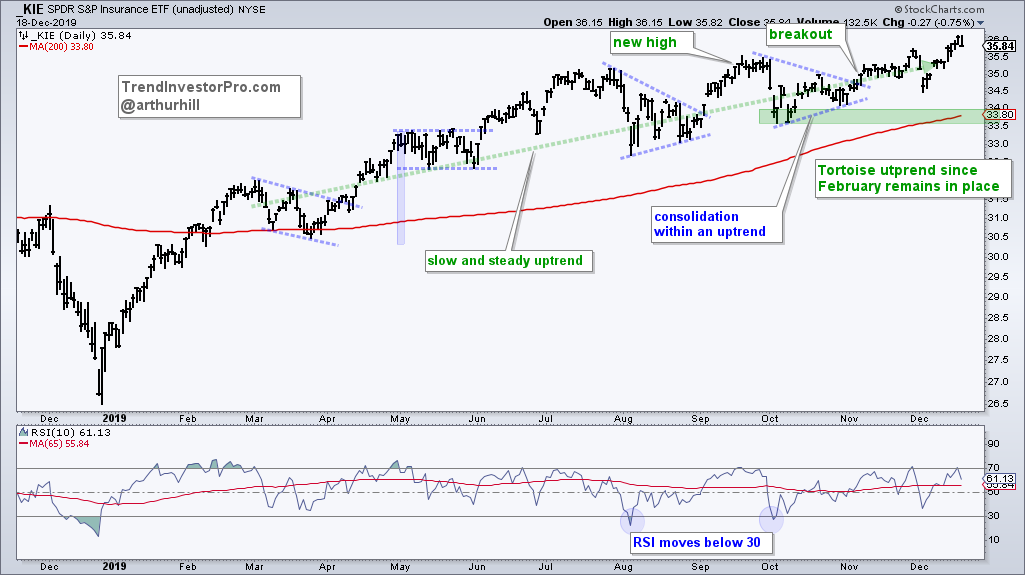
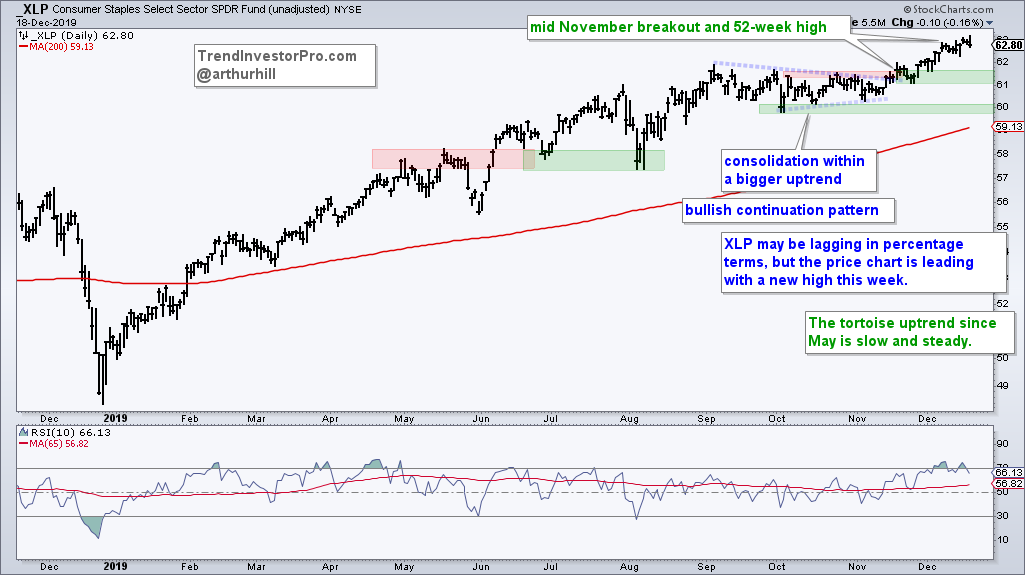
4) Tortoise Uptrend and 52-week High (or near)
KIE, VIG, USMV, XLP, HYG
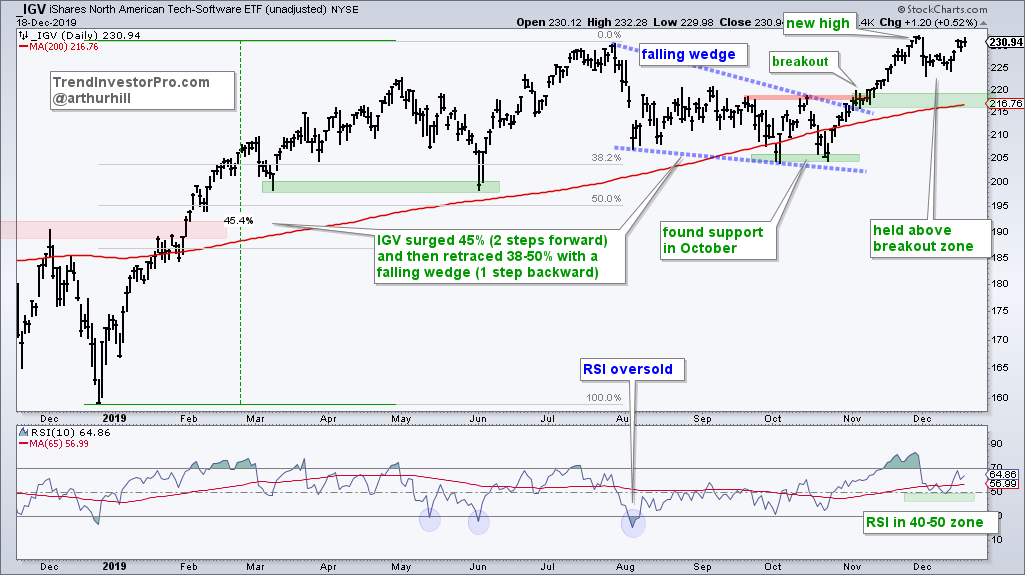
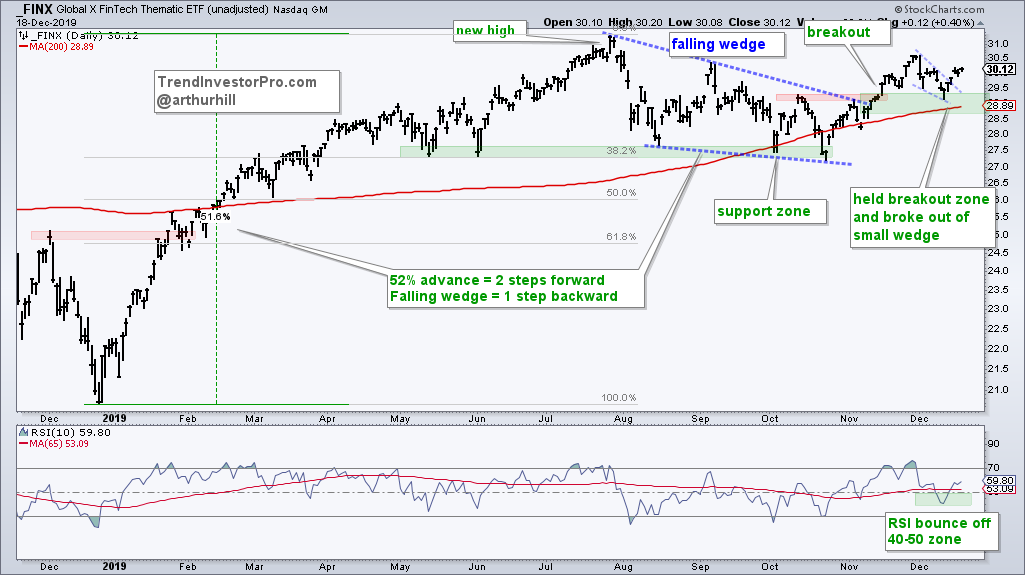
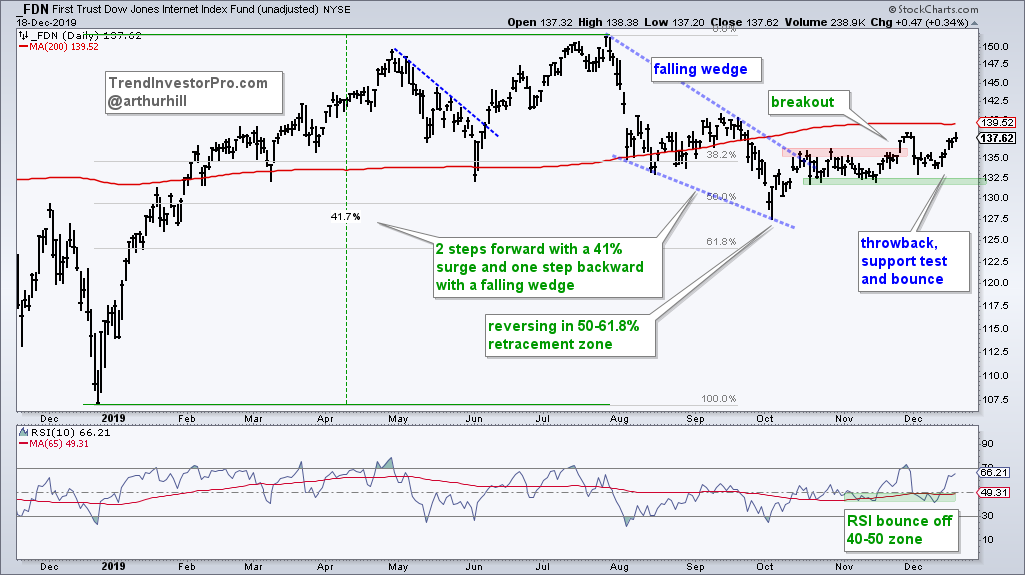
5) Wedge Breakout and Holding Breakout
IGV, HACK, IPAY, FINX, SKYY, FDN
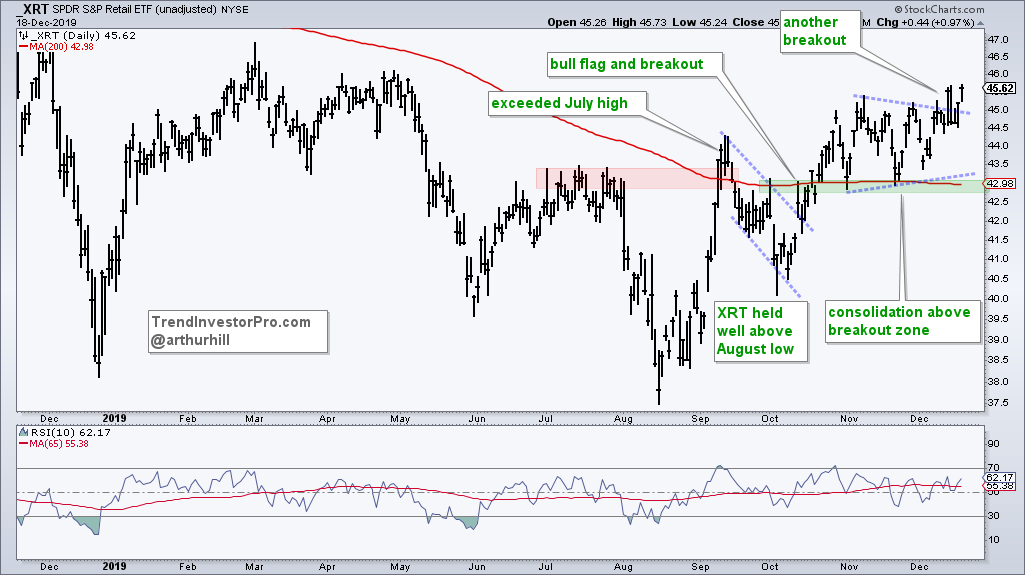
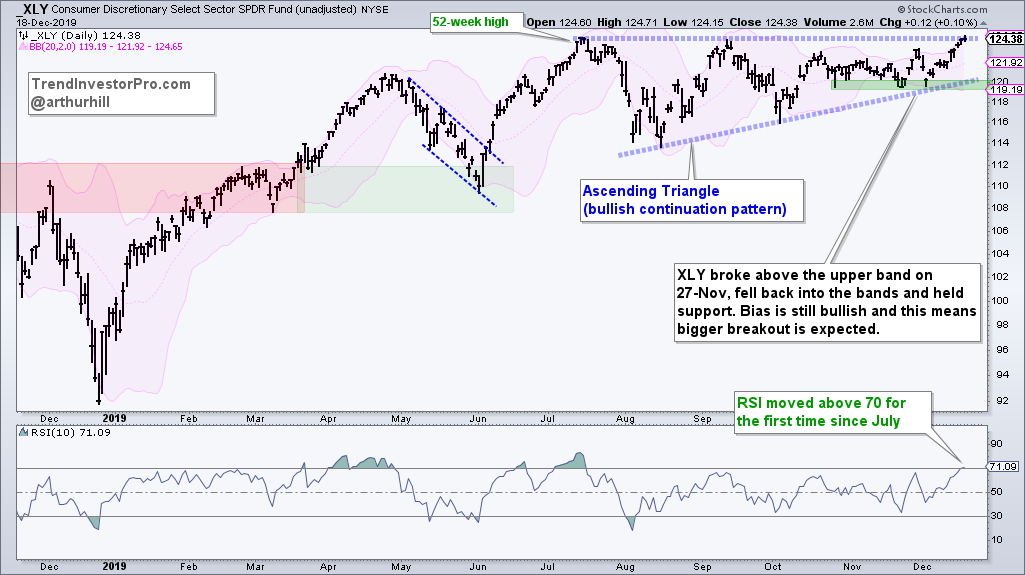
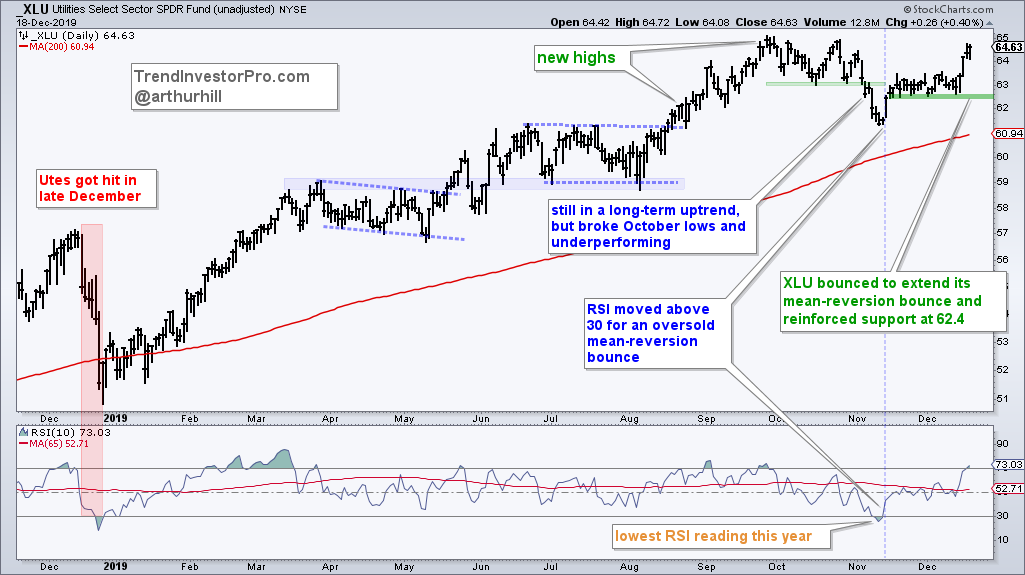
6) Recent Breakout and Reversals
MTUM, XLY, XRT, XME, TAN, PFF, XLU, LQD
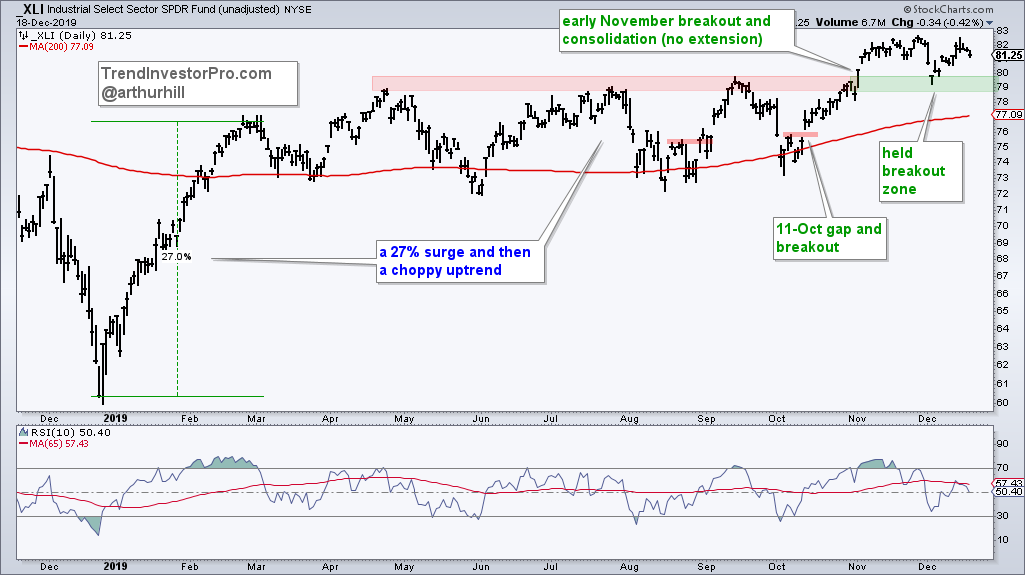
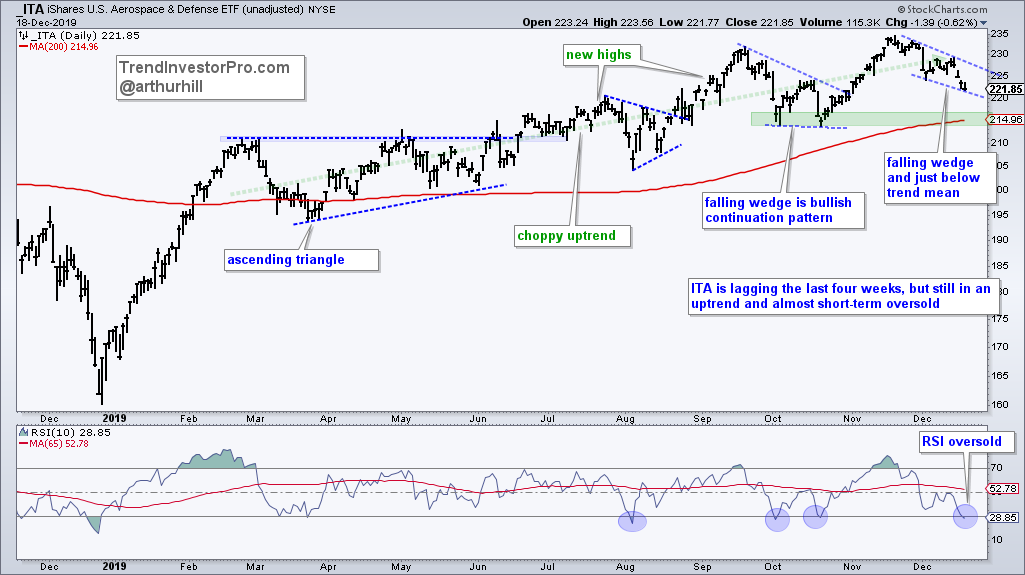
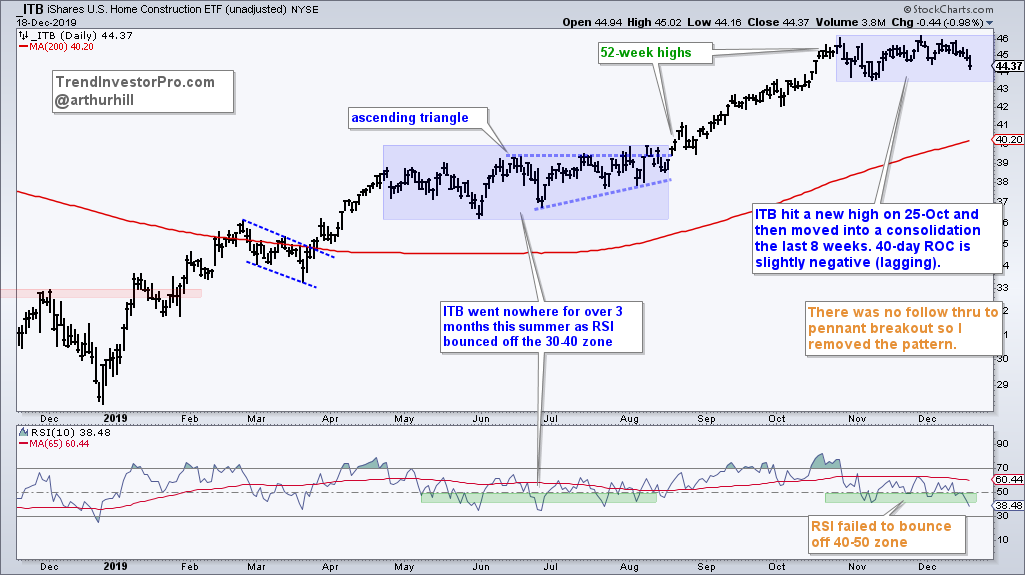
7) Uptrends, but Lagging and Stalling (3-8 weeks)
XLI, REM, ITB, XHB, ITA
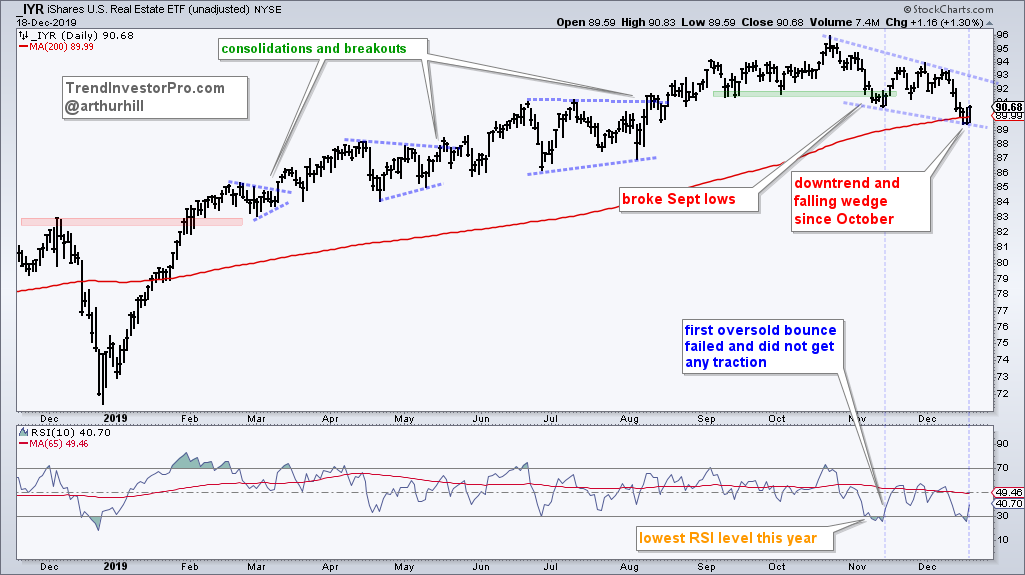
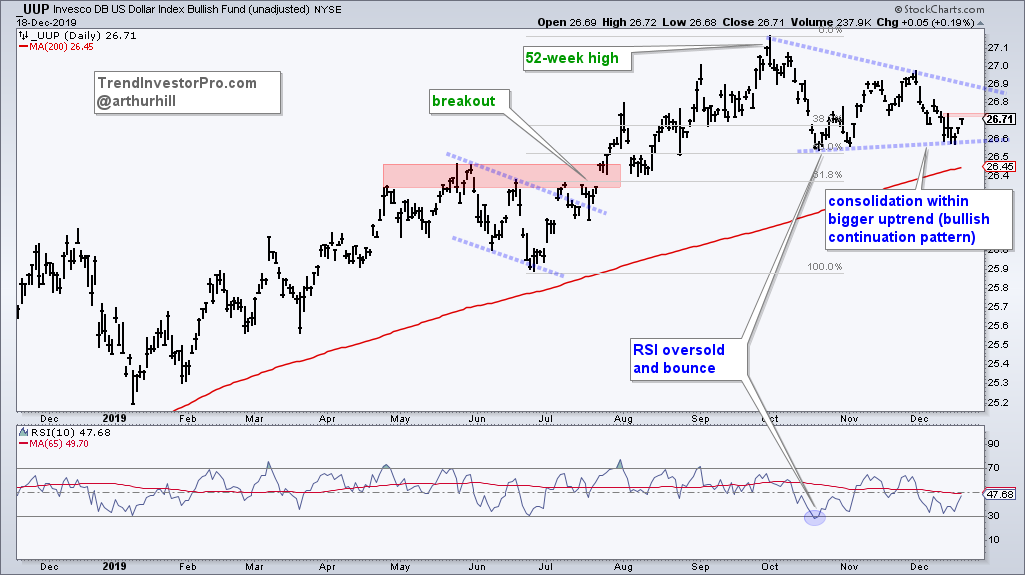
8) Peaked in October and Correcting
XLRE, IYR, UUP
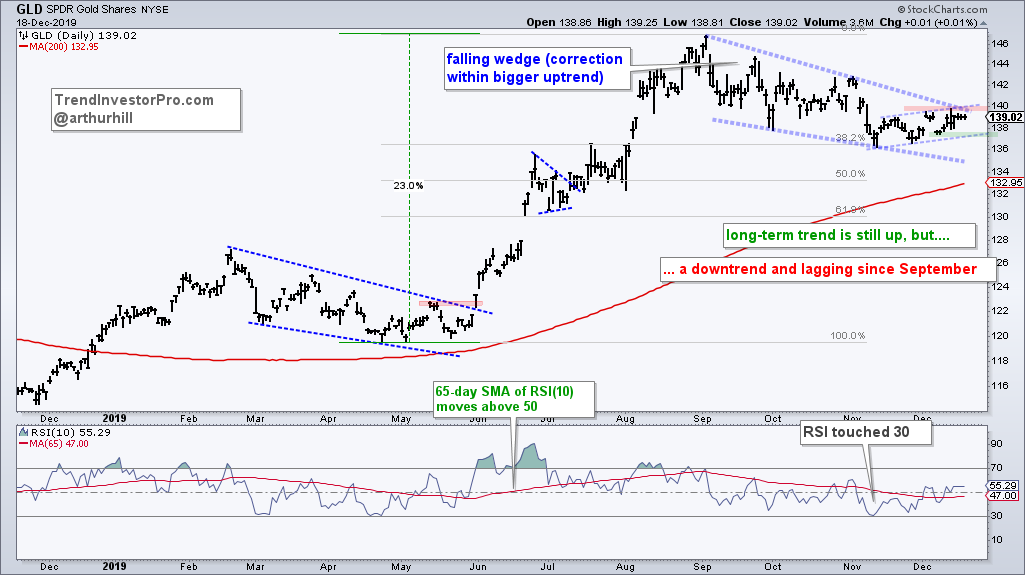
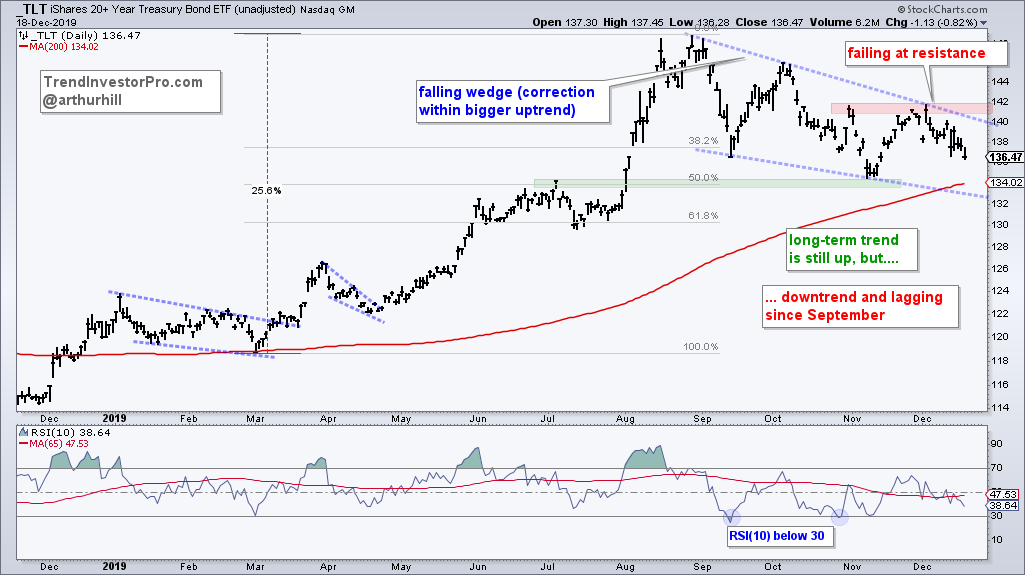
9) Peaked in September with Falling Wedges
GDX, GLD, SLV, TLT, AGG
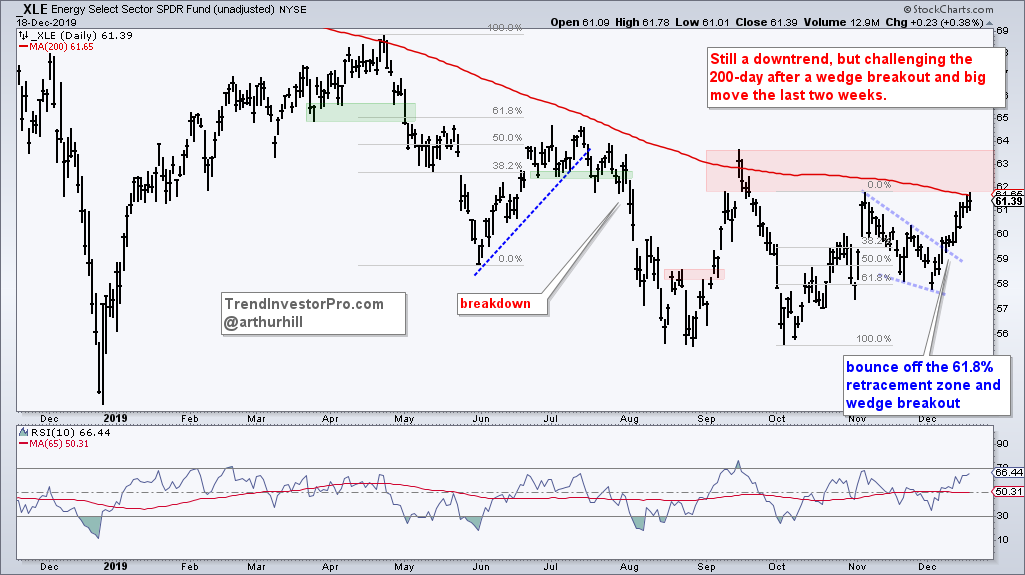
10) Downtrends of Some Sort
XLE, XOP, XES, FCG, AMLP, REMX, MJ
")