Systematic Strategies and Next Level Technical Analysis
Pattern Trading vs A Systematic Approach for ETFs
Arthur Hill, CMT
Archive
Use CRTL+P to Print
Headlines
Diversification within the Industrials and Finance Sectors
Diversification Can Make for Erratic Price Action (XLI)
A Systematic Approach to Trading the Trend (XLI)
The next Premium report/video will be on Tuesday, December 23rd.
Holiday Schedule
Note that the NYSE and Nasdaq close early on Christmas Eve and are closed Christmas Day, as well as New Years Day.
NYSE and Nasdaq Schedule:
1PM Close – Wednesday – December 24th
Closed – Thursday – December 25th
Closed – Thursday – January 1st
TrendInvestorPro will publish reports with videos on the following days:
Monday – December 22nd
Tuesday – December 23rd
Tuesday – December 30th
The normal publishing schedule resumes on Tuesday, January 6th
Diversification within the Industrials and Finance Sectors
Trading short-term patterns can be messy business with whipsaws, failed breakouts and support breaks. This is especially true for ETFs, which have dozens of moving parts (stocks). Each stock has its own characteristics and drivers. Less homogenous ETFs can also be more susceptible to erratic price action because each industry group has its own characteristics and drivers.
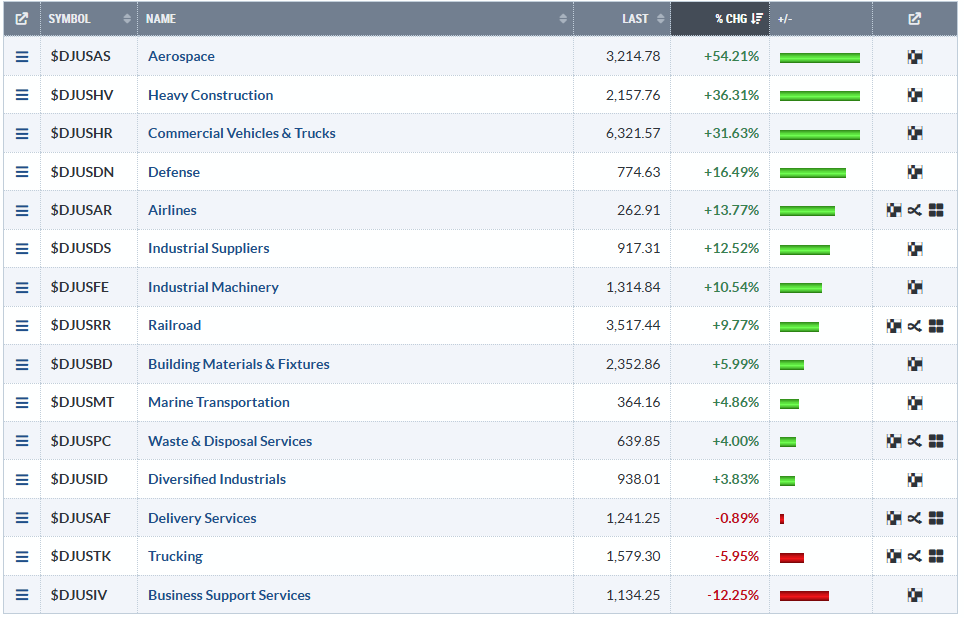
Here are two examples. The Industrials SPDR (XLI) has 79 stocks representing some 15 industry groups. These include Aerospace/Defense, Industrial Machinery and Delivery Services. The sector summary table below shows year-to-date performance for these groups.
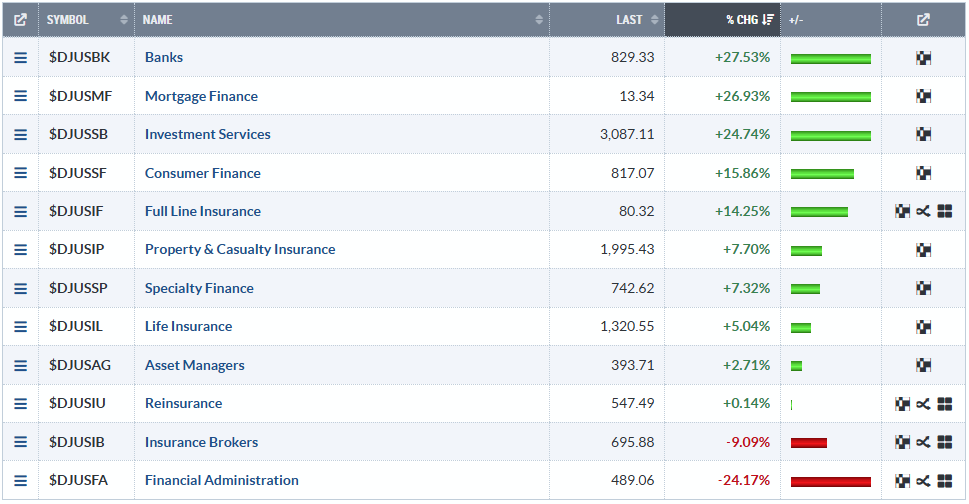
The Finance SPDR (XLF) has 76 stocks from some 12 industry groups. These include Banks, Full-Line Insurance and Financial Administration. The sector summary table below shows year-to-date performance for these groups.
Diversification Can Make for Erratic Price Action (XLI)
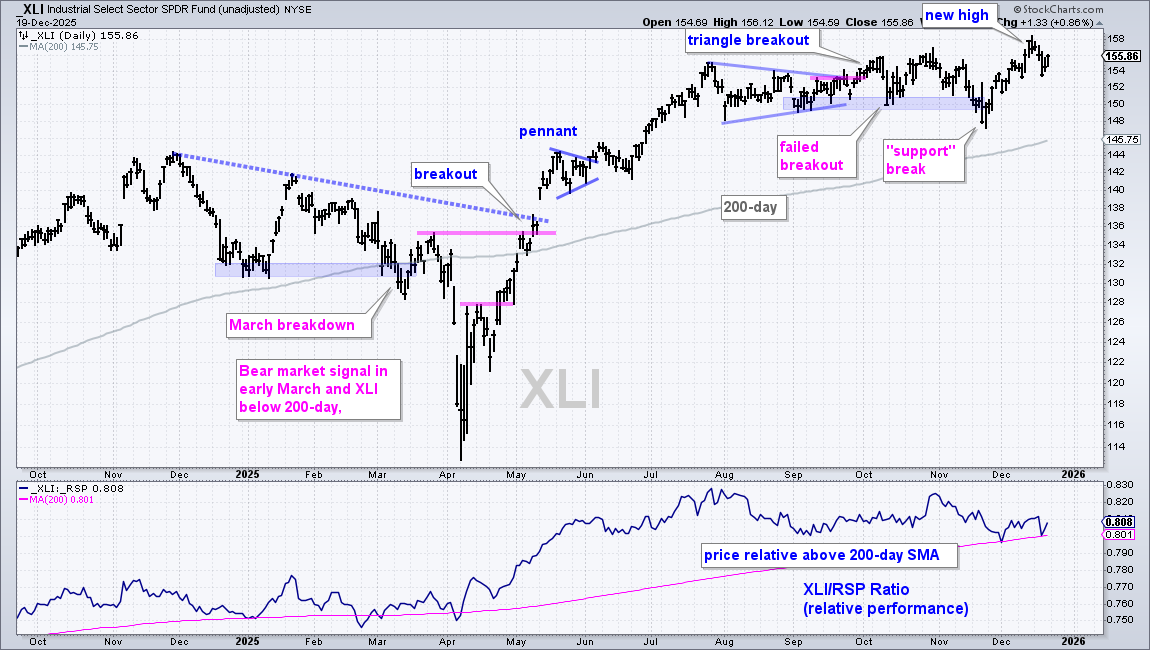
ETFs with dozens of moving parts from different industries can be prone to failed chart signals. The chart below shows the Industrials SPDR (XLI) failing to hold the triangle breakout in late September. XLI recovered into October, but then broke support with a sharp decline into November. This support break did not lead to further weakness. Instead, XLI surged to new highs in mid December.
Hindsight is always 20/20, but we can learn by revisiting past signals, setups and trades. First, what were the extenuating circumstances from September to December? For one, the weight of the evidence was bullish for the stock market (bull market). Second, XLI was above the rising 200-day SMA (long-term uptrend). Third, the price-relative was also above its rising 200-day SMA (long-term relative strength). These three bullish items increased the chances for a bullish resolution to short-term weakness.
A Systematic Approach to Trading the Trend (XLI)
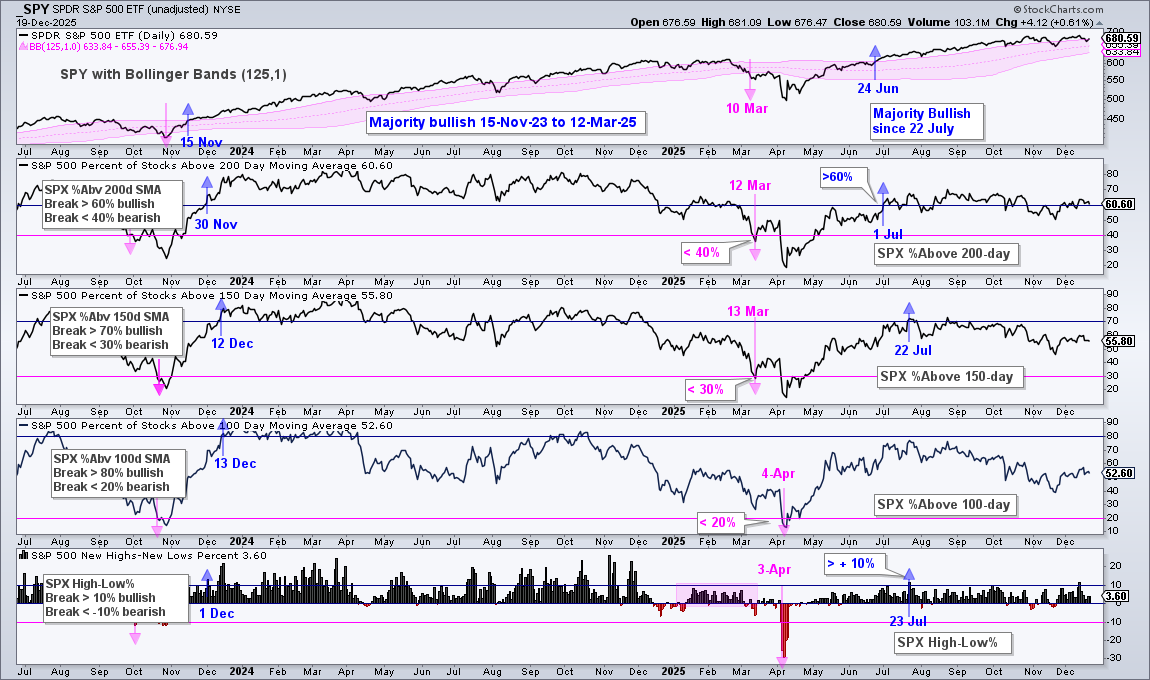
How might a systematic trader deal with XLI? For starters, a systematic trader would not use chart patterns, support or resistance. Instead, a systematic trader would use indicators to quantify conditions. Chartists can use breadth model to define the stock market (bull or bear market) and the 200-day SMA to quantify the long-term trend for an ETF. These two establish the first two prerequisites for a trading setup. The stock market must be in bull mode and the long-term trend must be up for the ETF. See the Market Regime page for more details.
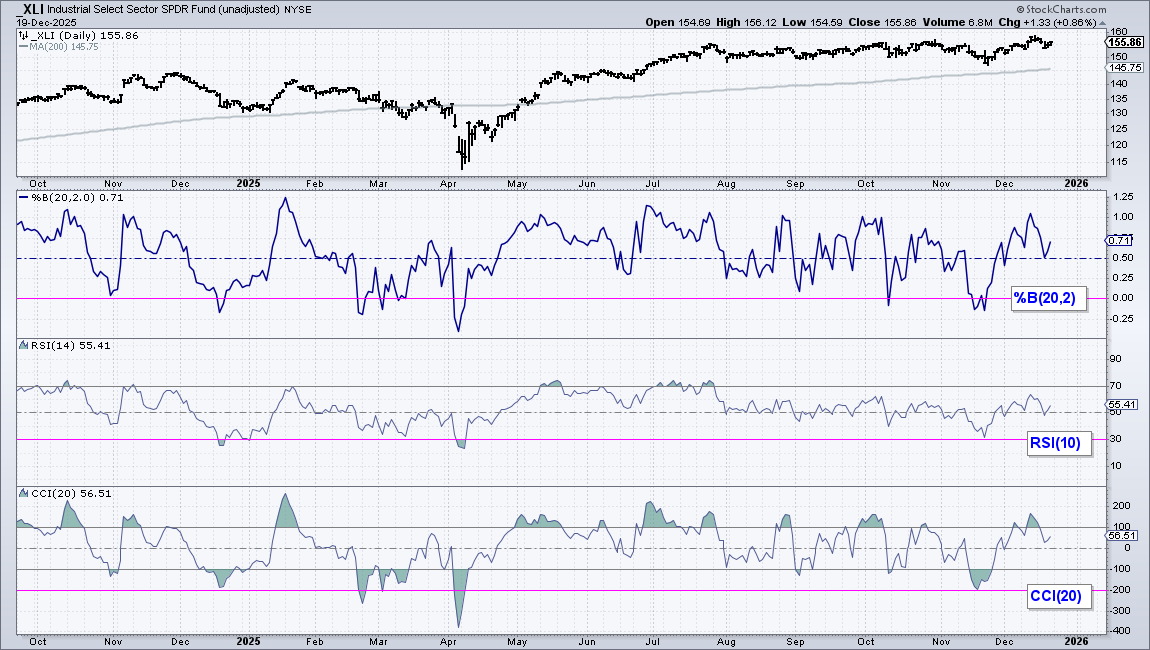
Once an ETF is in a long-term uptrend, a systematic trader would use an oscillator to find oversold conditions. These include %B (20,2) below zero, RSI(10) below 30 or CCI(20) below -200. An oversold condition within an uptrend is an opportunity to enter a trade after a pullback. The assumption here is that the long-term uptrend and bull market will prevail at some point. There will be a bullish resolution after the oversold condition.
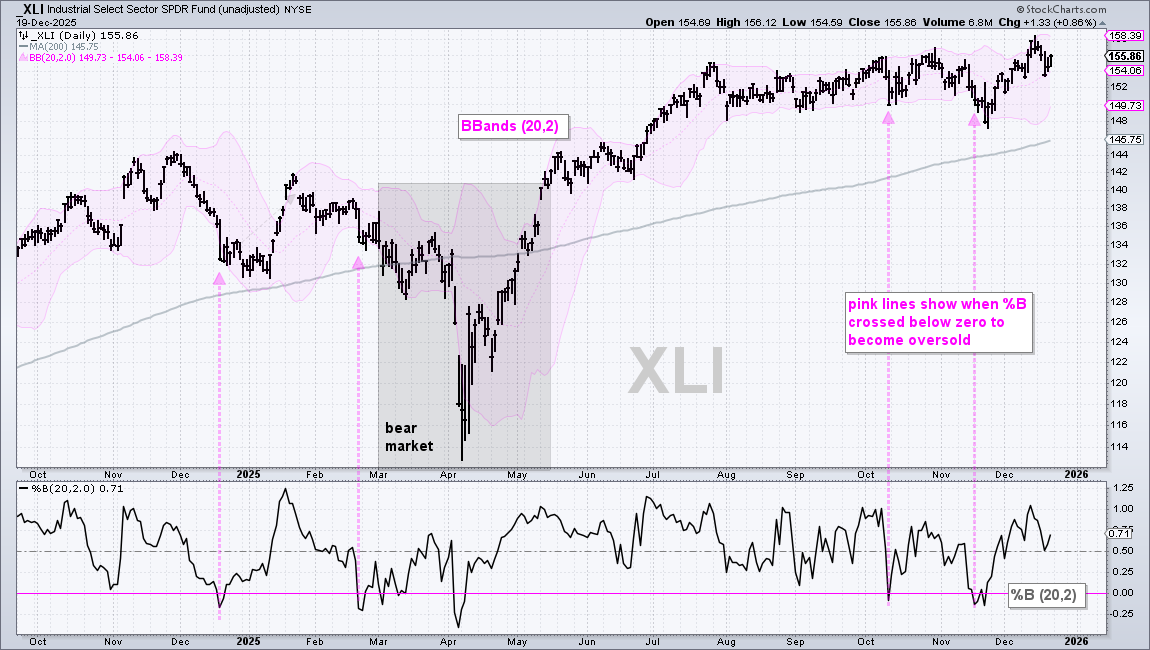
The chart below shows XLI with the Bollinger Bands (pink shading) and %B in the lower window. The dark gray shading shows when there was a bear market and XLI was below the 200-day SMA. A bull market and long-term uptrend were present from October to February and from July to December. This is when chartists would be hunting for oversold conditions. The pink lines show oversold conditions in mid September, late February, early October and mid November.
Chartists can use oversold conditions to establish new positions or add to existing positions. Aggressive traders can move in and out of positions by selling after a bounce. Position traders, on the other hand, can exit when the long-term trend turns down or a bear market signals. Again, this is based on the assumption that prices will move higher as long as the long-term trend is up and a bull market is present. In the example above, XLI triggered an exit when it moved below the 200-day SMA and a bear market signaled in early March. XLI is currently above the 200-day SMA and we are in a bull market.
Homogeneous ETFs
I picked on XLI and XLF because they represent diversification extremes within a sector. Even so, I think similar logic applies to seemingly homogenous ETFs, such as the Semiconductor ETF (SMH) and Home Construction ETF (ITB). These ETFs also have dozens of moving parts (stocks) with different drivers. Nvidia (NVDA) is an AI leader, while Texas Instruments (TXN) leads in analog semiconductors. Within ITB, Toll Brothers (TOL) builds luxury housing, while Sherwin Williams (SHW) manufactures and sells paint.
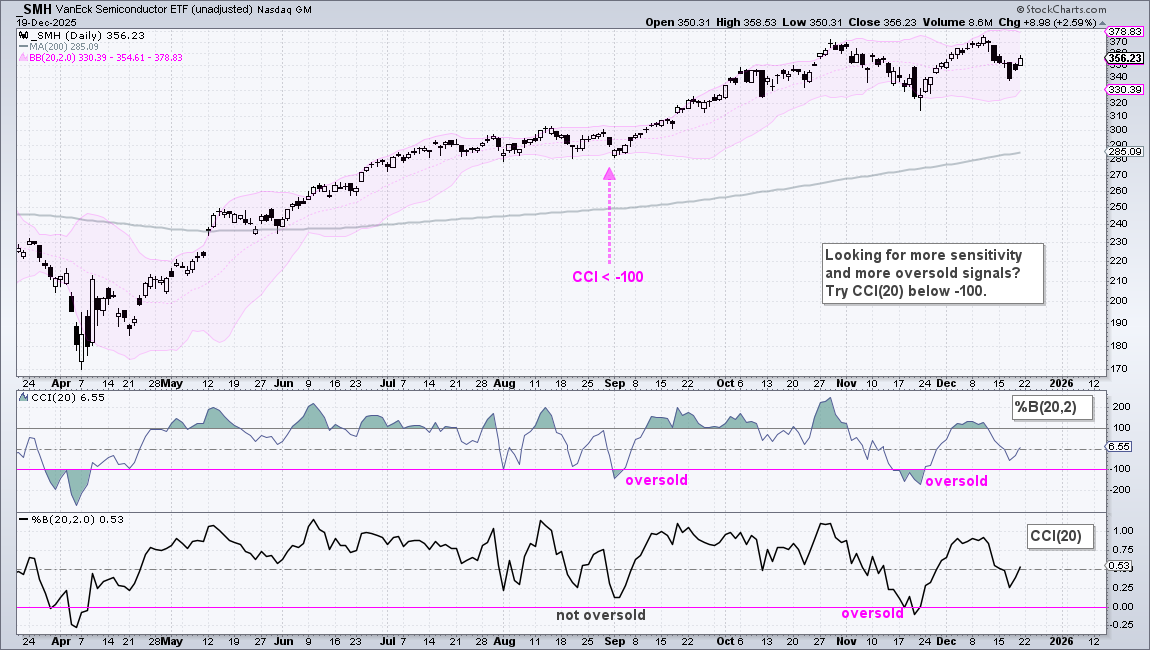
The chart below shows SMH with CCI(20) and %B. Notice that %B did not become oversold in early September. Chartists looking for an oversold setup sometimes have to change their conditions (parameters), especially during strong uptrends. CCI(20) dipped below -100 to become oversold in early September.
DISCLAIMER: This content provided strictly for informational and educational purposes. It should not be interpreted as an offer to buy or sell any security, nor as a solicitation to engage in any investment activity. Nothing here constitutes a recommendation regarding any specific security, portfolio, transaction, or investment strategy.
At times, the author or affiliates may hold positions or interests in securities discussed. Any stocks or examples mentioned are not endorsements or suggestions to purchase. This material does not consider your individual financial goals or circumstances, and you should seek guidance from a qualified financial or investment adviser before making any trading or investment decisions.
Past performance does not guarantee future results.
Send feedback to support(at)trendinvestorpro.com or use the contact form.