Systematic Strategies and Next Level Technical Analysis
Silver Goes Parabolic – IEF Holds Support as SPY Stalls – IBIT Breaks Wedge Line
Arthur Hill, CMT
Archive
Alternative ETFs
Use CRTL+P to Print
Headlines
7-10Yr TBond ETF Holds Support
What Could Cause IEF to Bounce?
Gold Near New High as Silver Extends
Gold and Silver Miners Hit New Highs
Copper and Base Metals Consolidate above Breakouts
Copper Miners ETF Extends on Breakout
Physical Uranium Holds Up, but URA Fails to Hold Breakout
Bitcoin ETF Breaks Wedge Line
The next Premium report/video will be on Monday, December 22nd.
Holiday Schedule
Note that the NYSE and Nasdaq close early on Christmas Eve and are closed Christmas Day, as well as New Years Day.
NYSE and Nasdaq Schedule:
1PM Close – Wednesday – December 24th
Closed – Thursday – December 25th
Closed – Thursday – January 1st
TrendInvestorPro will publish reports with videos on the following days:
Monday – December 22nd
Tuesday – December 23rd
Tuesday – December 30th
The normal publishing schedule resumes on Tuesday, January 6th
Precious Metals Lead as Bitcoin Lags
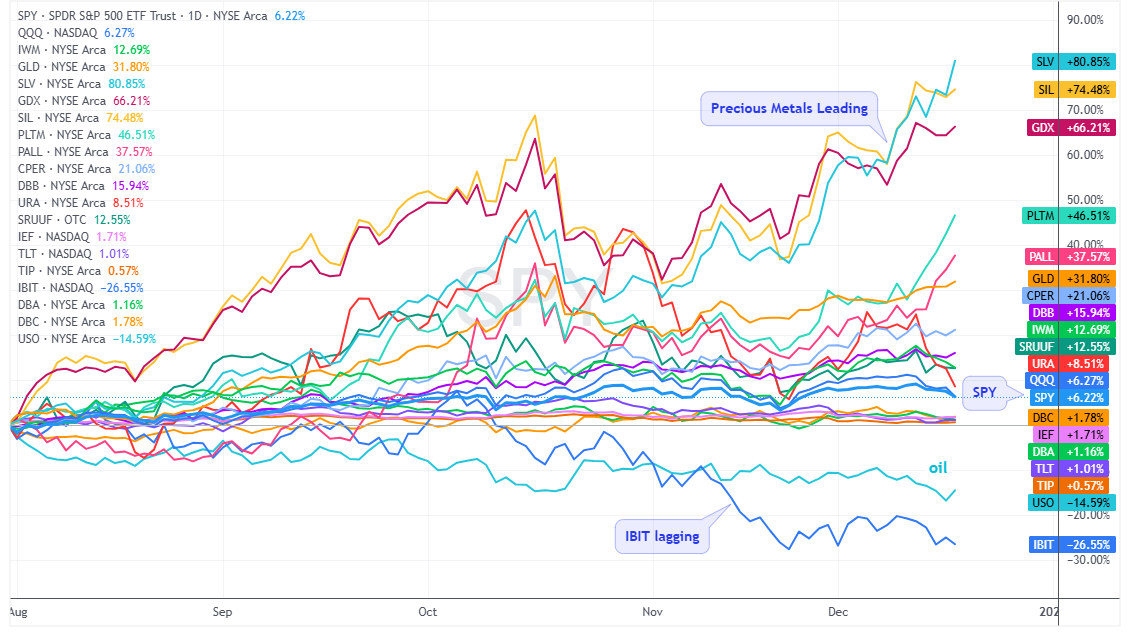
Precious metals continue to lead. Not just one or two, but all precious metals (gold, silver, platinum, palladium) and their respective miners. All are up more than 30% since August. Copper and base metals are also outperforming stocks with CPER up 21% and DBB up 16%. The Russell 2000 ETF (IWM) is the strongest of the major index ETFs with a 12.69% gain. In contrast, QQQ and SPY are up around 6.2%.
The right side of the chart shows performance ranked with the best performers at the top and the worst at the bottom. Underneath SPY, we can see the true laggards. The DB Commodity ETF (DBC), the DB Agriculture ETF (DBA), 7-10Yr TBond ETF (IEF), and 20+Yr TBond ETF (TLT) are up less than 2%. The US Oil Fund (USO) and the Bitcoin ETF (IBIT) are the two weakest assets with double-digit losses since August.
In addition to StockCharts, I use TradingView charts to analyze three different timeframes, create comparison charts and access a wide array of indicators.
7-10Yr TBond ETF Holds Support
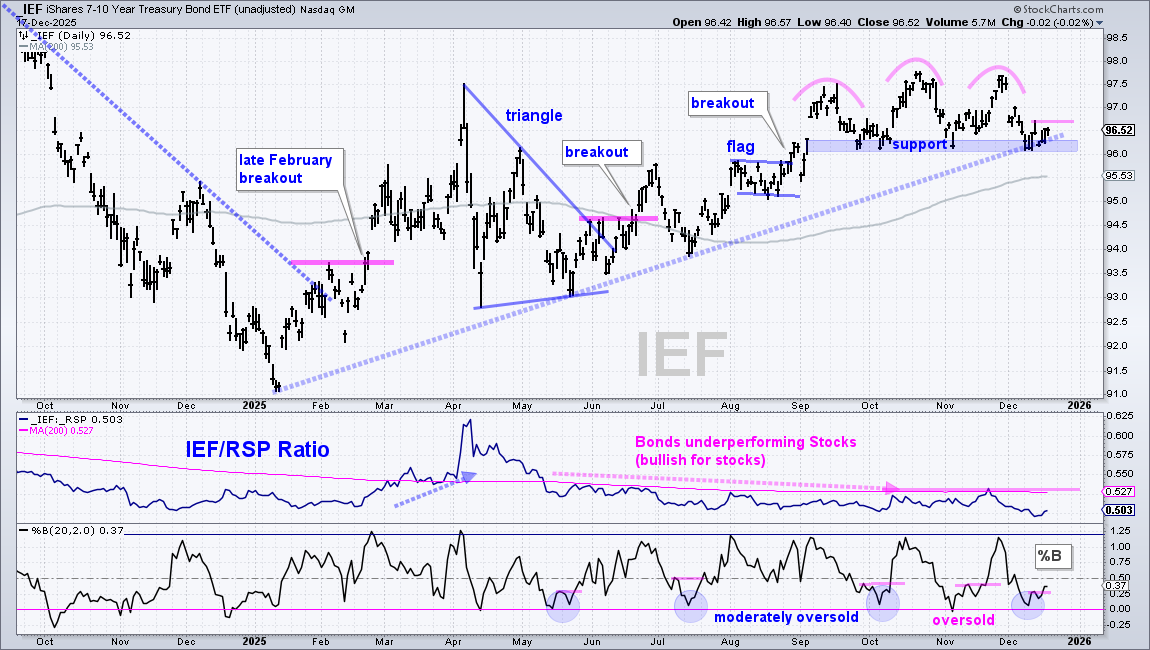
The 7-10Yr TBond ETF (IEF) remains in an uptrend – until proven otherwise with a neckline break. Even though a head-and-shoulders top is very visible on the price chart (pink arcs), it is not bearish until confirmed with a support break at 96. At this point it is simply a consolidation within an uptrend. Until a confirming break down, the long-term trend is up, as shown with the rising trendline (dashed blue). What is the assumption during a long-term uptrend? Pullbacks and oversold conditions present opportunities. One of these pullbacks will cause a trend reversal, but pullbacks are opportunities until a reversal actually signals.
This means IEF is in a uptrend, trading at support and moderately oversold. Technically speaking, this is an opportunity. Notice that %B dipped into the 0-.25 area, which is moderately oversold. The pink lines on %B show higher high breakouts after becoming oversold. IEF is firming at support and a breakout at 96.75 would signal an upturn.
What Could Cause IEF to Bounce?
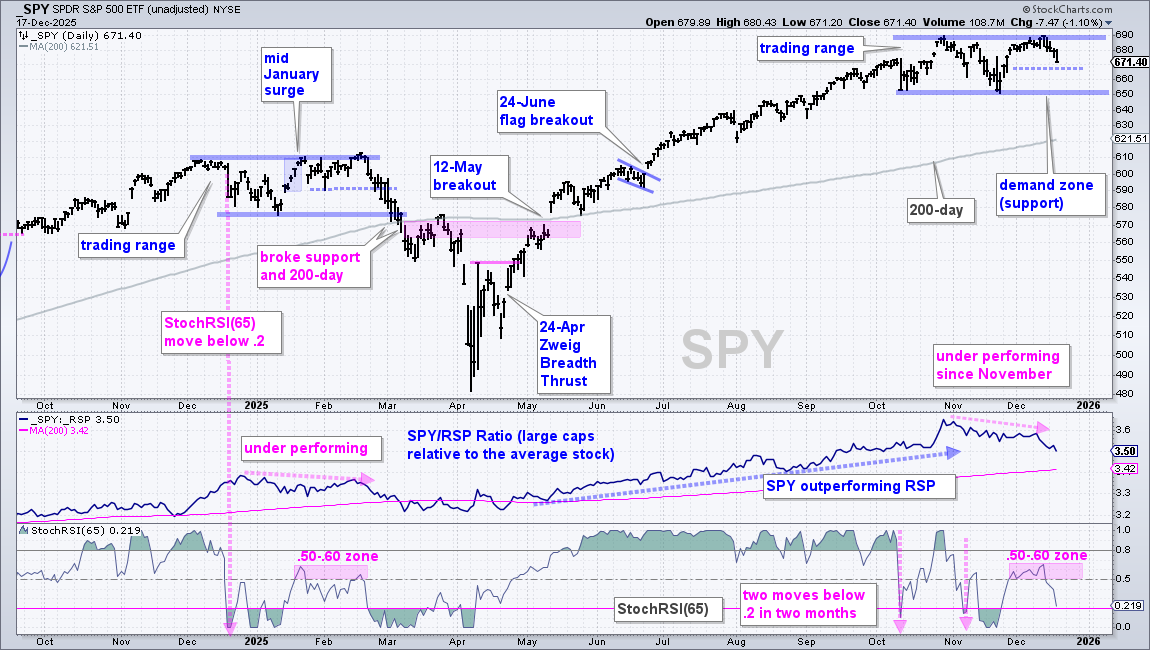
A breakdown in SPY could push money into safe-haven bonds. SPY remains in a trading range and there is no change in the analysis on Tuesday. See this report for details on the price chart and StochRSI(65). The blue dashed line marks the close on November 24th, which is 668.73 (call it 668). This line corresponds with dashed line in February (580). SPY broke 580 in late February, which negated the mid January surge and led to the March breakdown. The chart setup now is similar to that seen from December to February. A close below 668 would negate the Thanksgiving week surge and provide the first signal that SPY will test support at 650. A break below 650 would target a move towards the rising 200-day SMA.
Gold Trades Near October High as Silver Extends
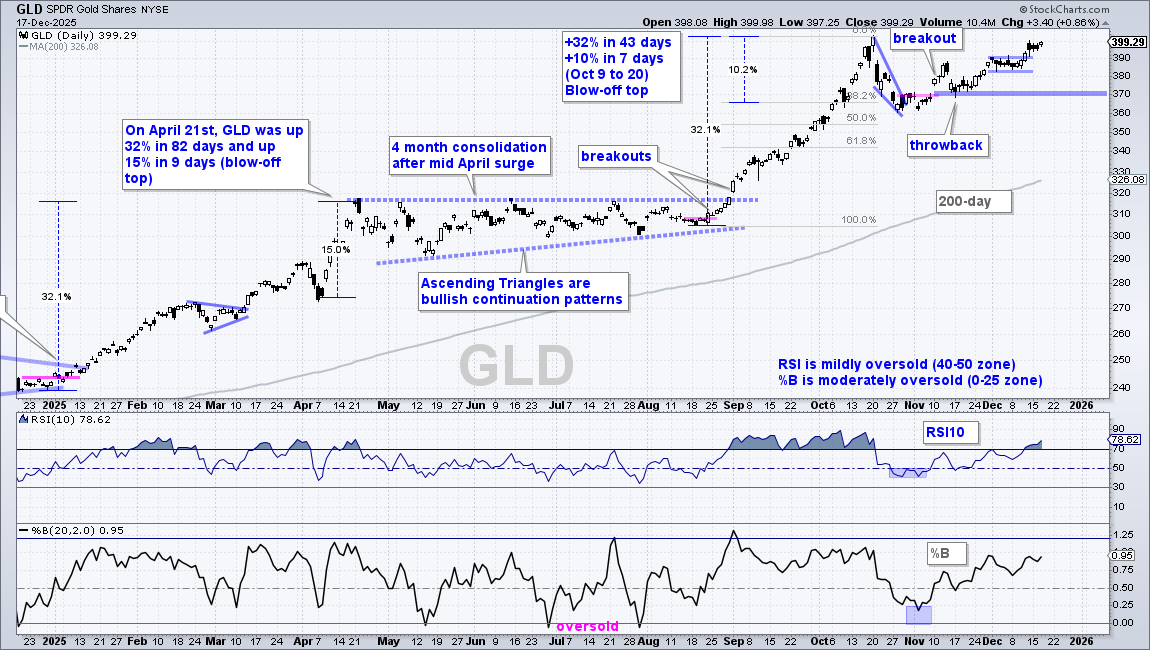
The Gold SPDR (GLD) remains in a strong uptrend with price near the October high and well above the rising 200-day SMA. After a hard pullback in late October, GLD broke out in early November and followed through on this breakout with further gains into December. A small consolidation formed the first week of December. This looks like a small flag and GLD broke out with a surge last Thursday. There is not setup on this chart, just a strong and leading uptrend. The mid November lows mark support at 370.
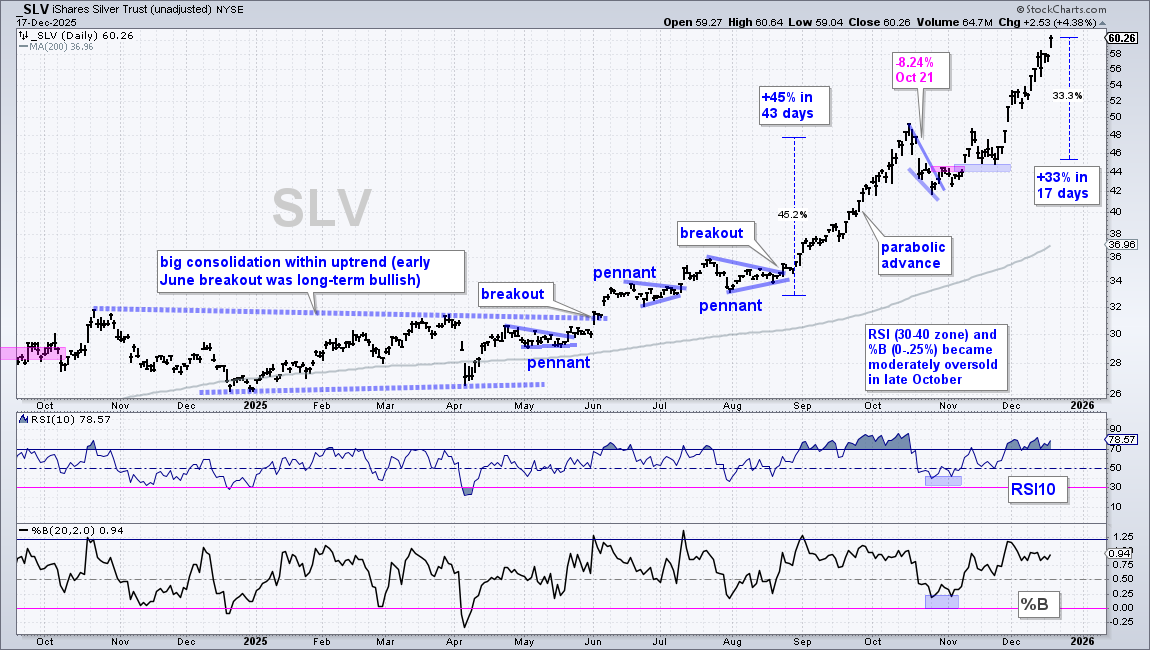
The Silver ETF (SLV) extended its advance, which was already overextended last week. As with gold, SLV corrected with a sharp pullback into late October, broke out in early November and soared into December. SLV is now up 33% in 17 days and going parabolic again. We do not have to look far to see the last parabolic advance, which was +45% in 43 days (late August to mid October). It is impossible to pick the top, but chartists should be prepared for a sharp correction. Notice how SLV fell 8.24% on October 21st. This sudden and sharp decline was part of the short pullback into late October.
Gold and Silver Miners Hit New Highs
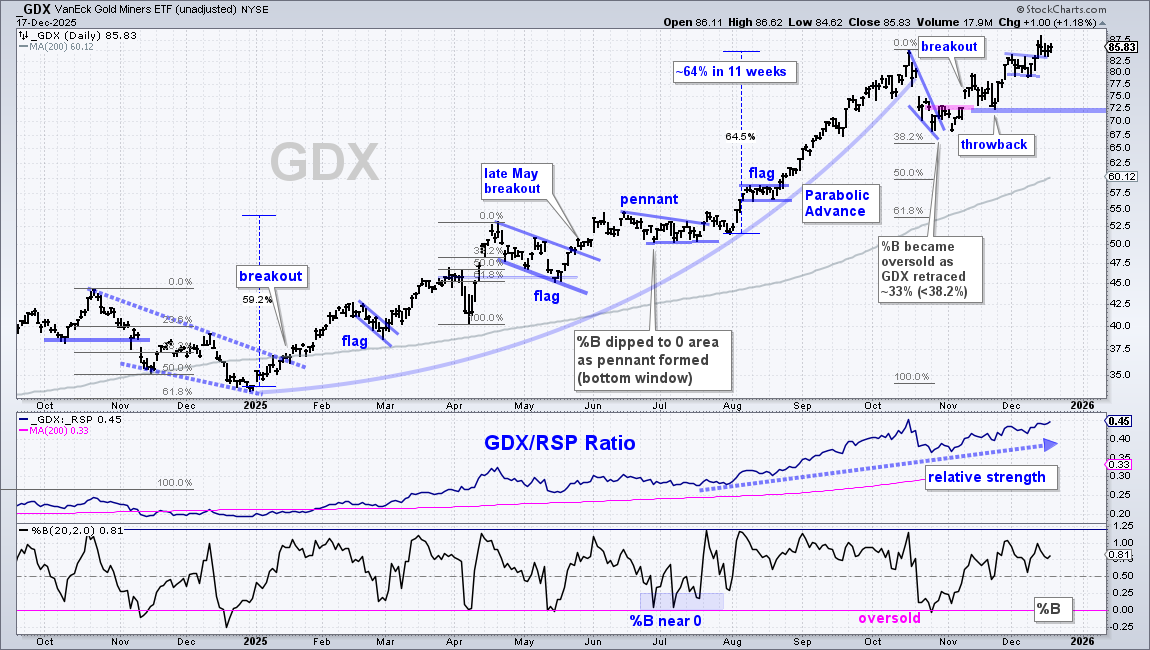
The Gold Miners ETF (GDX) is keeping pace with gold as it hit a new high last week. Other than that, there is no change in the chart. GDX remains in a leading uptrend with a new high in December and price well above the rising 200-day SMA. GDX corrected into late October, broke out in early November and extended to new highs in December. The late November low marks first support at 72.
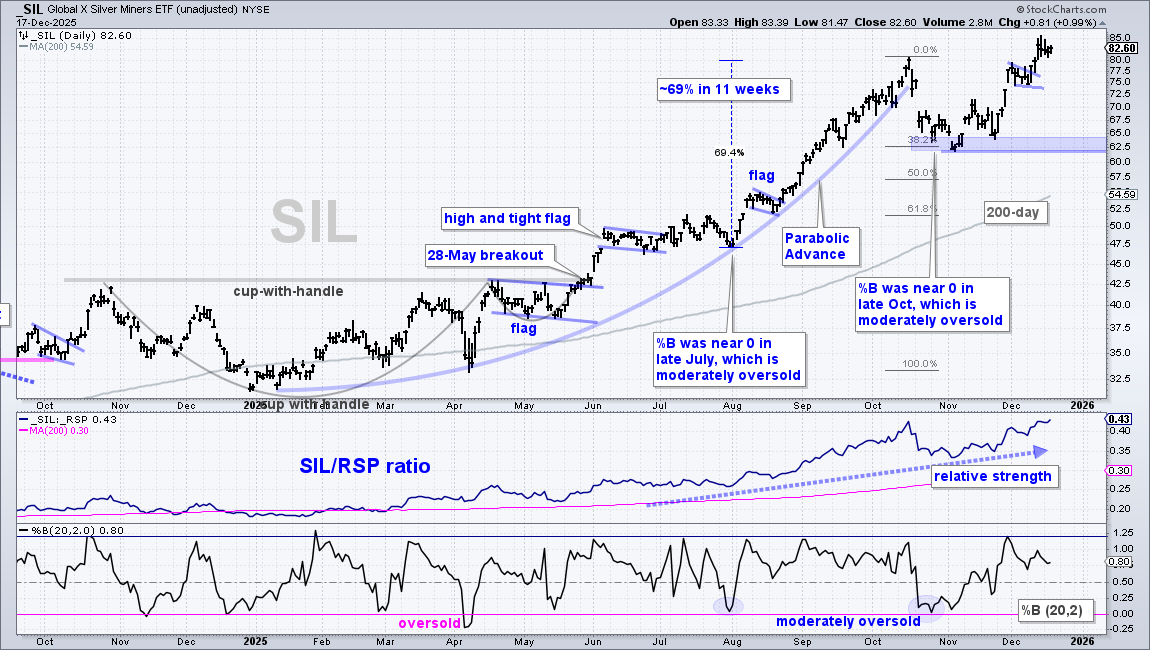
The Silver Miners ETF (SIL) went parabolic into mid October, corrected with a sharp decline into early November, stabilized in the 62-65 area and surged to new highs in December. A small pennant formed in early December and SIL broke out last week. The lows from late October to late November mark a support zone in the 62-65 area (blue shading).
Copper Breaks October High as DBB Hits New High
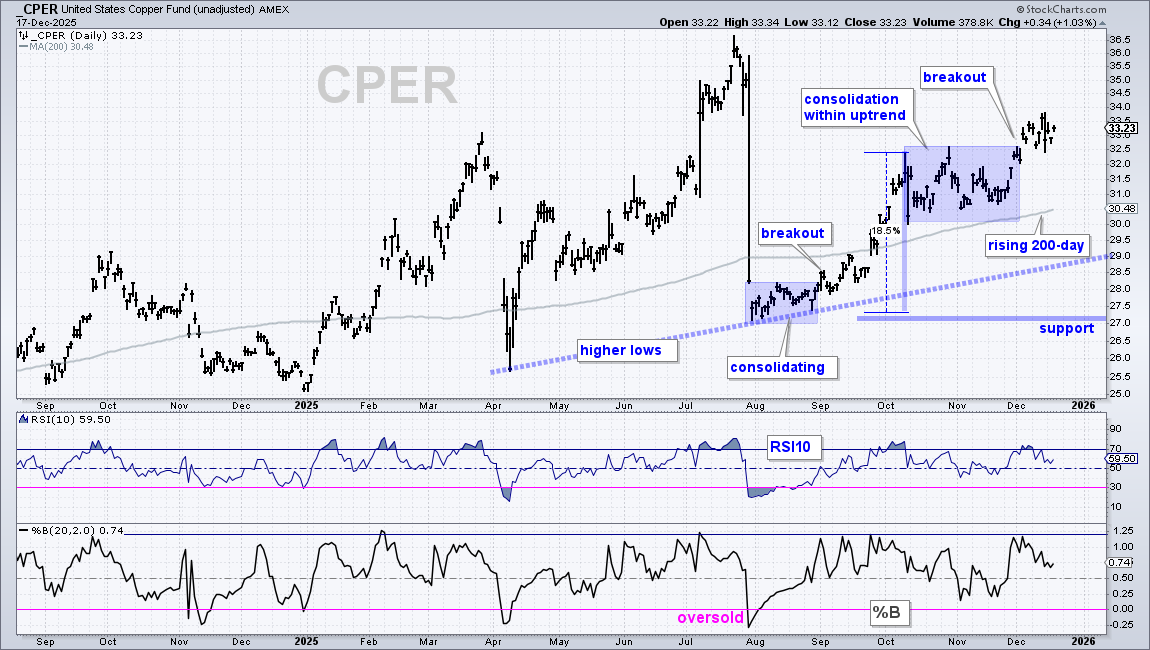
There is no change in the Copper ETF (CPER). CPER remains in a long-term uptrend with higher highs and higher lows since early 2025. CPER is also above the rising 200-day SMA. The ETF advanced from 27 to 32.5 (+18.5%) and then consolidated with a trading range into November (blue shading). A consolidation after an advance is a bullish continuation pattern. It is the pause that refreshes and sets the stage for the next move. CPER broke out with a surge above 32.5 in early December. Note that copper is a pretty volatile commodity, which means CPER could fall back into the consolidation zone and still be in an uptrend. While I am tempted to raise long-term support to 30, I will refrain and leave long-term support at 27.
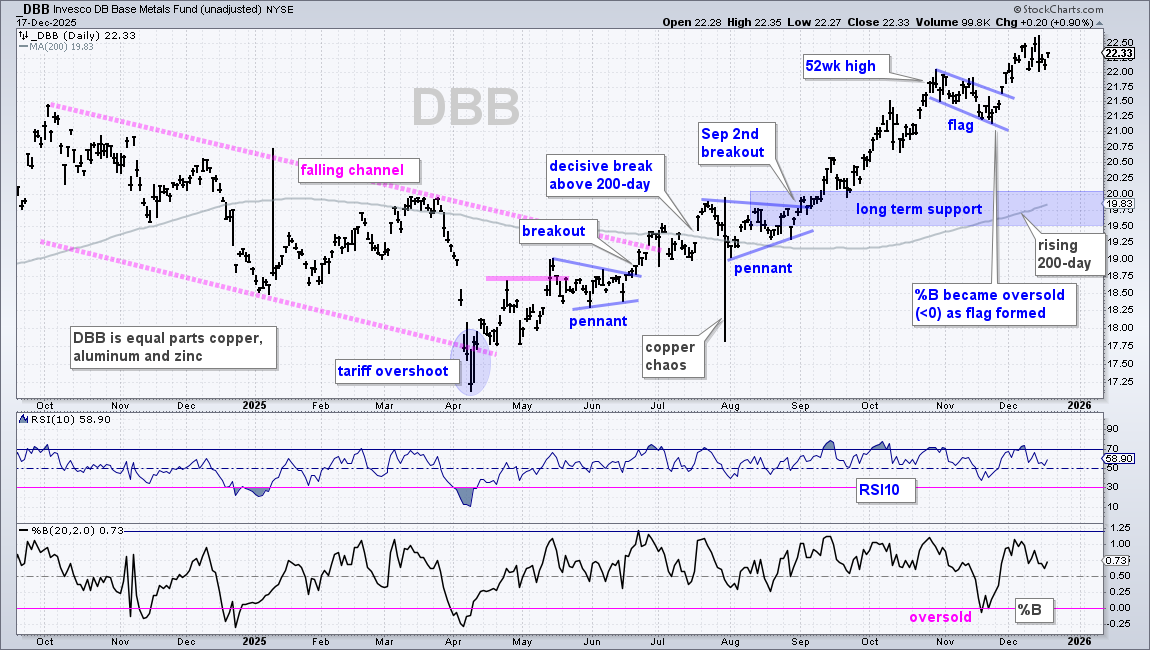
There is no change in the DB Base Metals ETF (DBB) as it consolidates above the flag breakout. DBB surged to new highs in October, corrected with a falling flag into November and broke out in late November. Also notice that %B became oversold on November 18th. This is a classic combination for trading pullbacks within uptrends (bull flag and oversold condition). Trading turned choppy as the ETF consolidated above 22 the last two weeks. There is no setup now, just a leading uptrend.
Copper Miners ETF Extends on Breakout
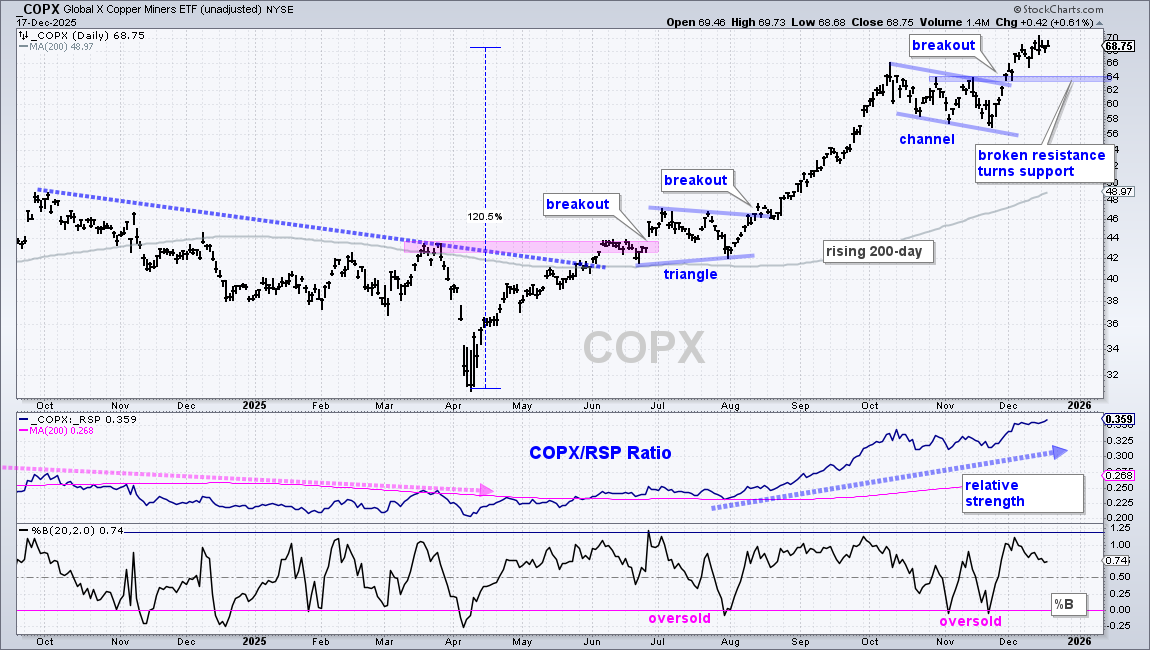
I am adding the Copper Miners ETF (COPX) to the mix. Note that COPX has above average volatility and risk, just like the Uranium ETF (URA). COPX is up over 100% since the April low and 10% corrections are not uncommon. Overall, COPX is in a leading uptrend with new highs in December and price well above the rising 200-day SMA. The ETF corrected with a falling channel in October-November and broke out with a surge above 64. Also notice that %B became oversold twice in November. The breakout zone in the 64 area turns first support to watch should we see a throwback (pullback to test the breakout).
Physical Uranium Holds Up, but URA Fails to Hold Breakout
The Sprott Physical Uranium (SRUUF) is based on the actual commodity, uranium. The Uranium ETF (URA) holds stocks related to uranium and nuclear energy, including Cameco (CCJ), Oklo (OKLO) and Uranium Energy (UEC). Uranium-related stocks are much more volatile than the underlying commodity. These stocks are also following the AI trade, which is in a funk right now because many leading names are 20+ percent below their highs.
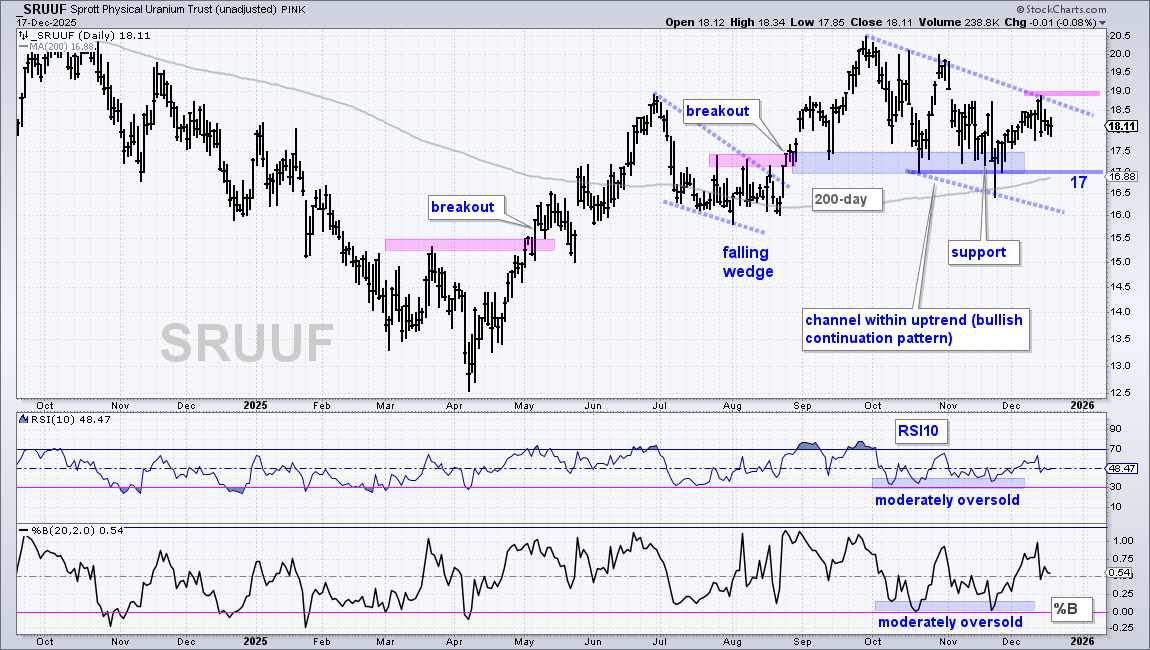
The Sprott Physical Uranium (SRUUF) is currently correcting within a bigger uptrend. The long-term trend is up with higher highs since the May breakout and price above the 200-day SMA, which turned up in September. Medium-term, the trend is down since October as the ETF fell back to the breakout zone around 17. A falling channel defines this downtrend with resistance marked at 19. A breakout here would reverse the slide and signal a continuation of the bigger uptrend. SRUUF defended the 17-17.5 area with at least three bounces since mid September. A close below 17 would break support, arguing for a re-evaluation.
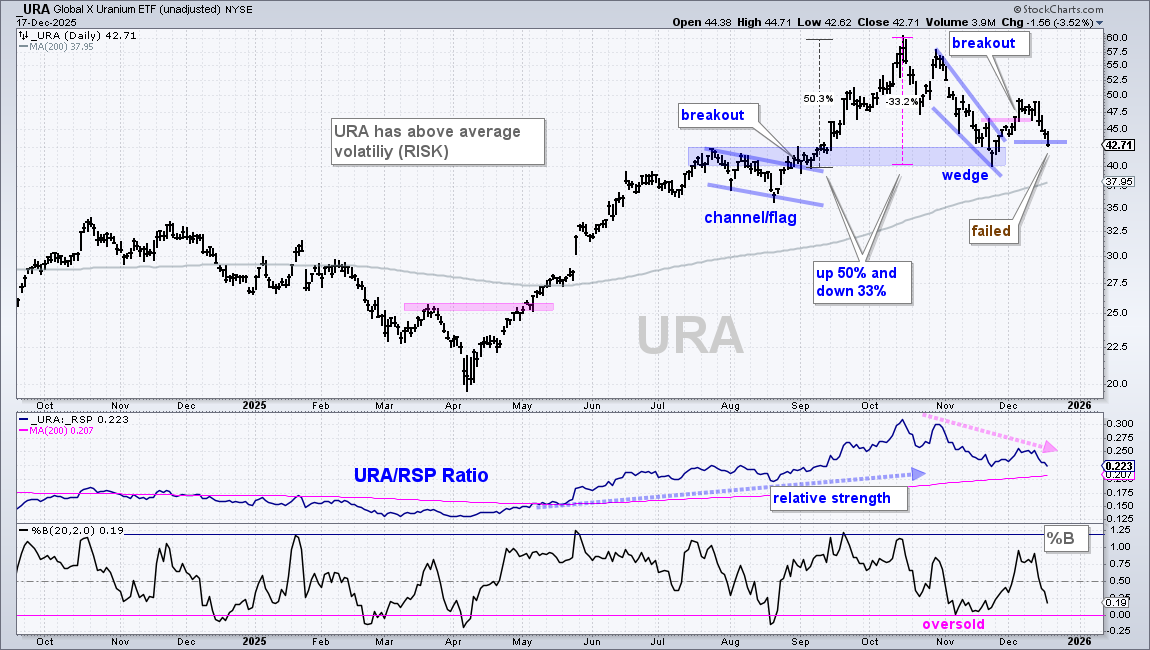
The Uranium ETF (URA) failed to hold its breakout as money moves out of the riskiest areas of the stock market. URA remains in a long-term uptrend with a new high in October and price above the rising 200-day SMA. The ETF corrected with a falling wedge that returned to the breakout zone (blue shading). URA broke out with a surge in late November and early December, but this breakout did not hold as the ETF closed below 43 on Wednesday. URA was outperforming from April to October, but has underperformed since November, much like QQQ and XLK.
Bitcoin ETF Breaks Wedge Line
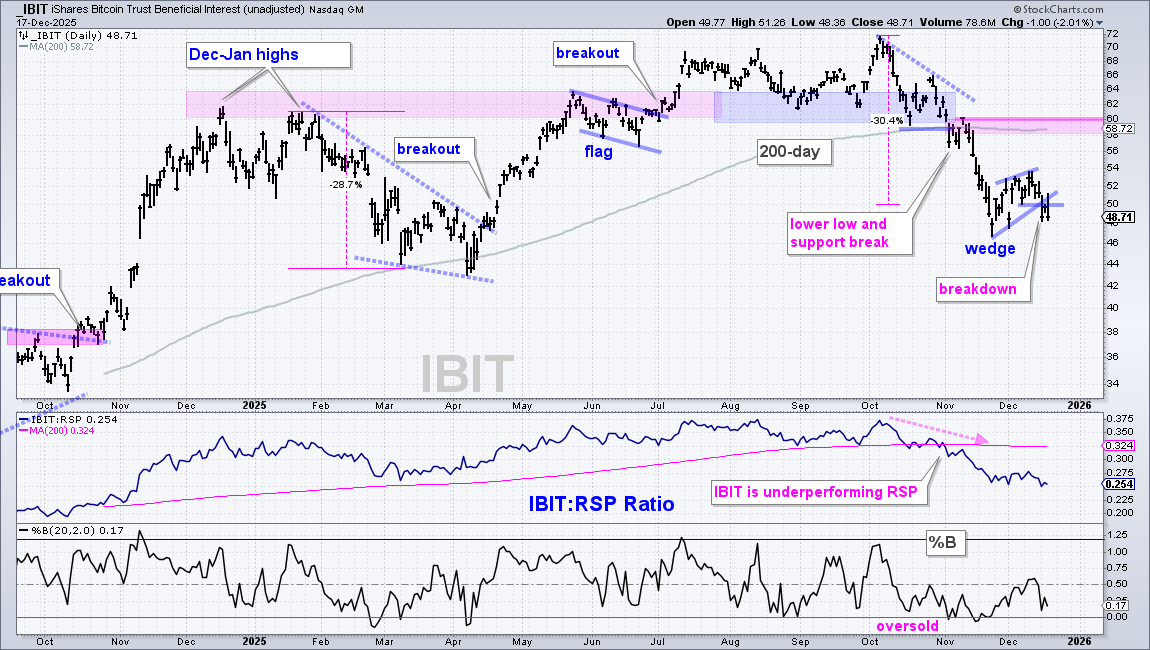
In another sign of risk-aversion, the Bitcoin ETF (IBIT) broke wedge support to signal a continuation lower. First and foremost, IBIT is in a long-term downtrend since the breakdown on November 4th. Broken support and the flat 200-day SMA mark resistance in the 58-60 area (pink shading). Second, IBIT is underperforming the S&P 500 EW ETF (RSP) with the price-relative (IBIT/RSP ratio) falling since October (middle window). After becoming oversold in late November, the ETF rebounded with a small rising wedge, which is a short-term bearish continuation pattern. IBIT broke wedge support on Monday, signaling a continuation of the downtrend.
DISCLAIMER: This content provided strictly for informational and educational purposes. It should not be interpreted as an offer to buy or sell any security, nor as a solicitation to engage in any investment activity. Nothing here constitutes a recommendation regarding any specific security, portfolio, transaction, or investment strategy.
At times, the author or affiliates may hold positions or interests in securities discussed. Any stocks or examples mentioned are not endorsements or suggestions to purchase. This material does not consider your individual financial goals or circumstances, and you should seek guidance from a qualified financial or investment adviser before making any trading or investment decisions.
Past performance does not guarantee future results.
Send feedback to support(at)trendinvestorpro.com or use the contact form.