
")


Today’s video starts with the medium-term uptrend and key indicators for the S&P 500 because they hold the key as we move into August. The bulk of the evidence remains bullish, but fewer stocks participated in the July advance and the market took a more defensive tone. The breakouts in IWM and XLI were not inspiring, XLF continues to lag and XLU was the top performing sector in July. I will also review the excesses in QQQ, the seasonal patterns, the breadth models, the ChartBook, the Fed balance sheet and yield spreads.

There are times for setups and signals, and there are times to wait. The waiting game is either waiting for the next setup/signal to materialize or monitoring the current signal in play. At this stage, we are in the monitoring stage for several signals that triggered in the first half of July.

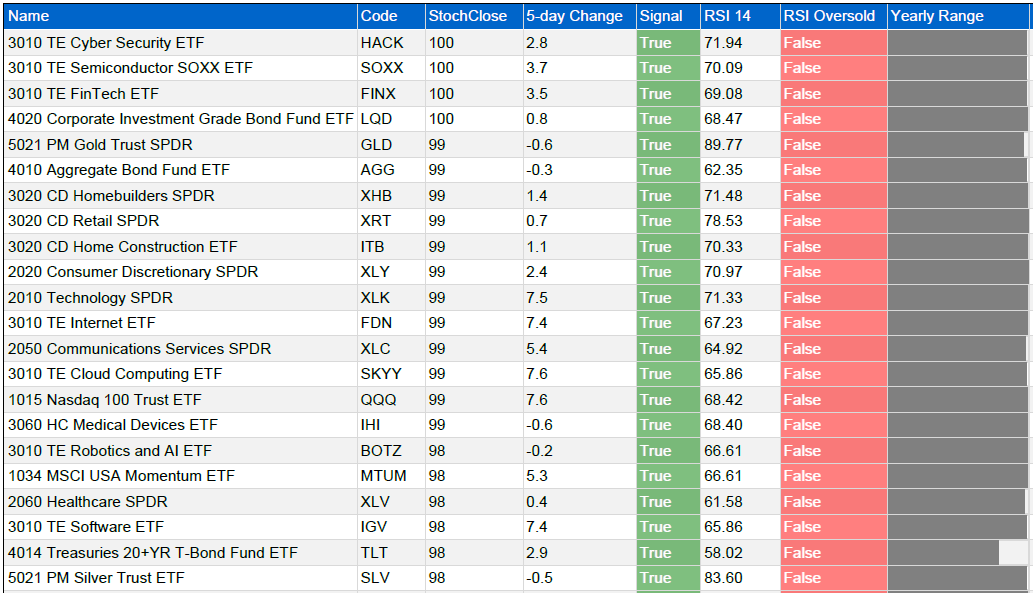
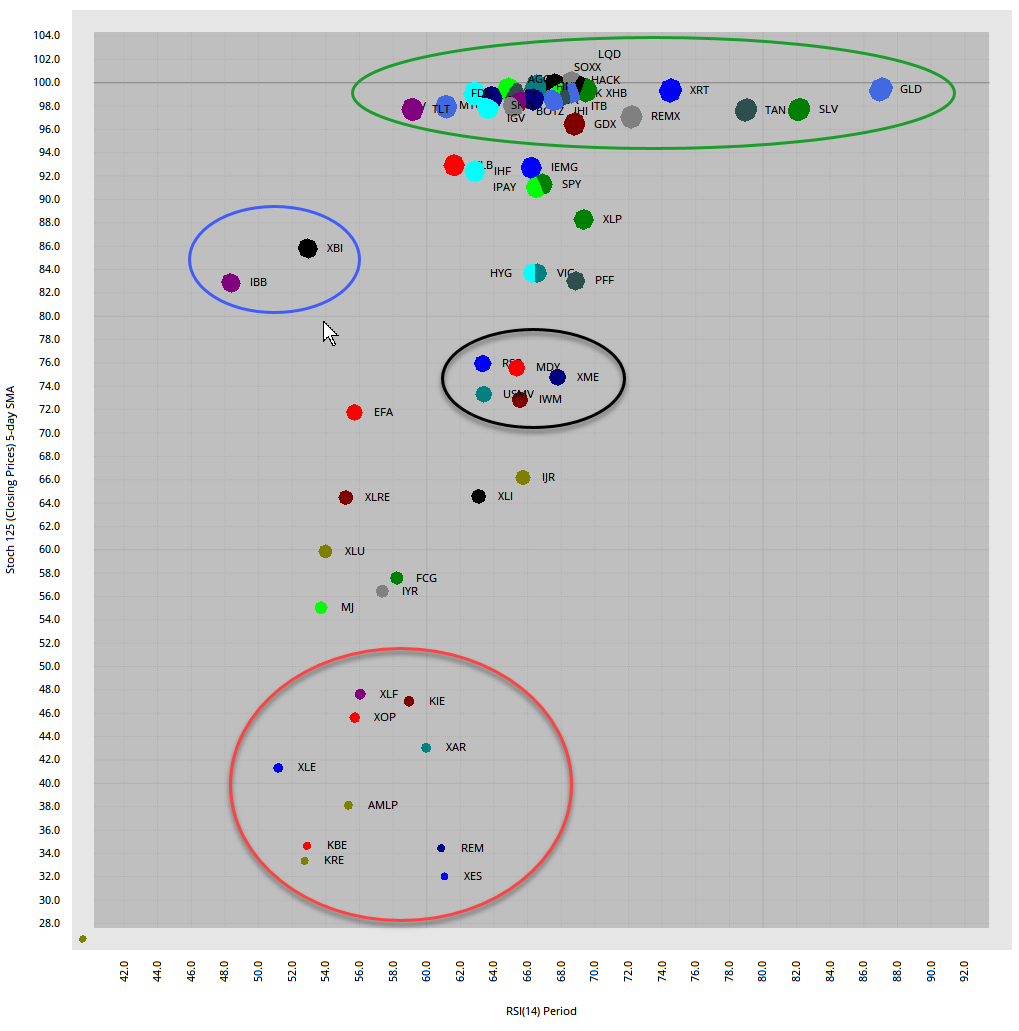
The slow rotation continues in the stock market. Tech and biotech related ETFs lagged over the last five days with declines, while ETFs related to housing, retail, banks and small-caps picked up the slack. Note that SPY is down .53% the last five days and the S&P SmallCap 600 SPDR (IJR) is up 1.94%.
ETF Ranking and Grouping – Slow Rotation, BB Breakouts and Stock Alternatives Read More »
QQQ and tech stocks took a breather this week, but the Consumer Discretionary sector, Housing and Retail picked up the slack. SPY and IWM were down fractionally, while QQQ fell around 1.5% on the week. Today’s video starts with a new signal in the S&P 500 breadth model. Despite this signal, the medium-term uptrend remains the main focus and we will cover the key indicators.
Weekend Video – SPX Model Turns, QQQ Gets Frothy and IWM Holds BB Breakout Read More »
My current focus remains on the medium-term up trends, which began with the surge in late March. The bulls are still in control of these medium-term trends and we saw several short-term breakouts in July. Some breakouts were strong as price exceeded the June high (SPY), while some were feeble as price remains well below the June high (RSP). Strong or feeble, the breakouts are still holding and have yet to be proven otherwise.
Timing Models – Medium-term Uptrends, Short-term Breakouts and QQQ Exuberance Read More »
After a dip in June, stocks and ETFs bounced back in July with several breakouts occurring over the last few weeks. In addition, groups that were lagging from April to June are leading over the last two weeks. It is positive to see some of these laggards play catch up and it is also positive to see the advance broadening.
ETF Ranking and Grouping – Breakouts Hold as Participation Broadens Read More »
Today’s video starts with the long-term trends, which reflect strength in large-caps, and the breadth models, which show a mixed market overall. I will review the medium-term uptrend and indicators because these hold the key right now. We will then turn to the Bollinger Band and consolidation breakouts working in SPY and RSP. What would it take to proven them otherwise? Seasonality gets interesting in August and September so we will cover these patterns for stocks, small-caps, gold and bonds.
Weekend Video – Mixed Market, BB Breakouts, Seasonal Patterns and ChartBook Read More »

There were a number of Bollinger Band squeeze plays over the last two weeks and also a number of breakouts. These breakouts are bullish until proven otherwise, but chartists should also be aware of the head fake. In his book, Bollinger on Bollinger Bands, here’s how John Bollinger puts it: Traders beware! There is a trick to The Squeeze, an odd turning of the wheel that you need to be aware of, the head fake.
A Bollinger Band Breakout or the Dreaded Head Fake? Read More »
The stock market remains mixed, which means it is a stock picker’s market. As the broad breadth measures suggest, this is not a bull market that lifts all boats and makes everyone look smart. This is a relatively narrow bull market with tech, healthcare and communication services leading the way.
Timing Models – Small and Mid Caps Perk Up and Join the Breakout Parade Read More »
The leading ETFs took a breather over the past week and the laggards picked up the slack. The Nasdaq 100 ETF and Technology SPDR are down slightly, while the Regional Bank ETF and Metals & Mining SPDR are up sharply. Even though the rotation into the lagging groups may seem healthy, keep in mind that the Technology sector is still the biggest driving force in the S&P 500.

The cup remains half full for the S&P 500 SPDR, but half empty for the S&P 500 EW ETF. This could change as RSI firms in a potential reversal zone with a Bollinger Band contraction. Bearish candlesticks are not slowing down QQQ and even IWM could be ripe for a breakout.
Candles to Ignore and Bollinger Band Contractions to Watch Read More »
The mixed market is reflected on the ETF charts with tech-related ETFs hitting new highs and underperforming ETFs testing support levels. Will the leaders pull the laggards up or will the laggards drag the leaders down? Or, do we just need to analyze each chart on its own merits? Probably the latter. Several ETFs are at a moment of truth as their medium-term breakdowns collide with short-term support and reversal zones.
The stock market remains mixed overall with pockets of serious strength and pockets of weakness. The Technology and Healthcare sectors continue to lead, while the Finance and Energy sectors lag. QQQ hit a new high and is leading SPY, while large-caps are leading small and mid caps.
Timing Models – Broad Market is Mixed, but Large-caps Maintain Bullish Edge Read More »
The weekend video starts by reviewing year-to-date performance for the major index ETFs, some key groups, the sector SPDRs and the equal-weight sectors. It is mixed, at best. We then turn to the breadth models. The Nasdaq 100 is the only one of the four breadth models that is bullish. Two of the three medium-term indicators are bullish as SPY consolidates above the 200-day and support. I will then update the Fed balance sheet, the yield spreads, the ETF ranking tables and the ChartBook.
Weekend Videos – Breadth Model Review, ChartBook and Seasonality Read More »
The mighty Nasdaq 100 and related technology groups continue to lead the market. In fact, one could even suggest that they are holding up the broader market, with some help from the Communication Services and Healthcare sectors. Together, these groups account for a big chunk of the S&P 500. Despite a big pocket of strength
Timing Models – A Three Legged Bull Read More »
There is a lot of stalling going on out there. A stall can be the pause that refreshes or it can signal a stalemate that leads to a trend reversal. Several ETFs broke their mid June lows, but the tech and healthcare related ETFs are holding up and have yet to break their mid June lows. Some tech-related ETFs are even trading well above these lows. Outside of tech
ETF Ranking and Grouping – Lots of Consolidations Appear and Bond ETFs Remain Strong Read More »
The 200-day SMA is a long-term trend indicator that chartists can use across the equal-weight sectors to measure the balance of power in the broader market. The more sectors trading above their 200-day SMAs, the more bullish the market. The more sectors trading below their 200-day SMAs, the more bearish the market.
Measuring the Balance of Power in the Equal-weight Sectors Read More »
Today’s video starts with the four long-term breadth models, of which three are in bear mode. We then turn to the three dynamics at work in the stock market: the broad market environment, the medium-term trend and the short-term condition. I will review the weight of the evidence with the equal-weight sectors and intermediate-term indicators. And finally, we will finish with the Fed, yield spreads, the ETF rankings and the ChartBook.
The rock and the hard place is back. The major index ETFs are in medium-term uptrends that started in late March and have yet to reverse. These uptrends, however, are hitting resistance as the 200-day SMAs come into play for SPY and IWM. QQQ left its 200-day in the dust a long time ago.
QQQ, XLK and some tech-related ETFs moved to new highs again this week, but these new highs were not matched elsewhere and non-confirmations are building. For example, QQQ forged a higher high from June 10th to June 24th, but SPY and IWM did not. QQQ and techs have been leading for some time, and they continue to lead. However,
ETF Ranking and Grouping – Tech ETFs Holding Up, but other Groups Breaking Down Read More »