
")
New ETF with Big Potential
There is a new ETF in town that promises big potential. The Invesco Next Generation Nasdaq 100 ETF (QQQJ) is based on an index with the same name. As the Invesco web site explains, 90% of its total assets will come from the underlying index and this index is based on the 101st to 200th largest stocks in the Nasdaq. This makes it a small and mid cap version of the Nasdaq 100. The ETF is rebalanced quarterly and reconstituted annually. This article will look in-depth at QQQJ and provide a component list at the end.

Rebalancing and Reconstituting
Before getting into QQQJ, let’s talk about rebalancing, reconstitution and the momentum effect. These are issues affecting most market-cap weighted ETFs, such as SPY and QQQ.
Rebalancing keeps the component weights in line with changing index weights. If a stock’s price rises, it’s weight in the index will also rise. Of course, the opposite is true when a stock’s price falls. During a rebalancing, the ETF will buy shares of the winners to increase their weight and sell shares of the losers to decrease their weight. This is usually done quarterly.
Reconstitution is different because this is when components are added and dropped because they no longer meet the requirements of the ETF. A stock that rises in price and moves into the top 100 for Nasdaq market cap will be dropped from the QQQJ and added to QQQ. Similarly, stocks that fall in price and drop below 200th in market cap will be removed. QQQJ only holds stocks in the 101st to 200th largest stocks.
Recently, Marvell Technology (MRVL), Atlassian (TEAM) and Okta (OKTA) were elevated to first division (QQQ) because of the increase in their market cap. On the other side, Ultra Beauty (ULTA), News Corp (NWS), Biomarin (BRMN) and Citrix (CTXS) were relegated to second division (QQQJ) because their market cap dropped.
The Momentum Effect of the Few
ETFs weighted by market cap benefit from momentum. Basically, SPY is a momentum fund that rewards winners and punishes losers. Winners become bigger and more important to performance, while losers become smaller and less important. Citing research from Eric Crittenden, Ben Carson notes that 20% of stocks in the S&P 500 accounted for the index’s entire gain from 1989 to 2015. The other 80% were just filler. We can try to pick the top 20% or hold them all and benefit from the momentum of a few.
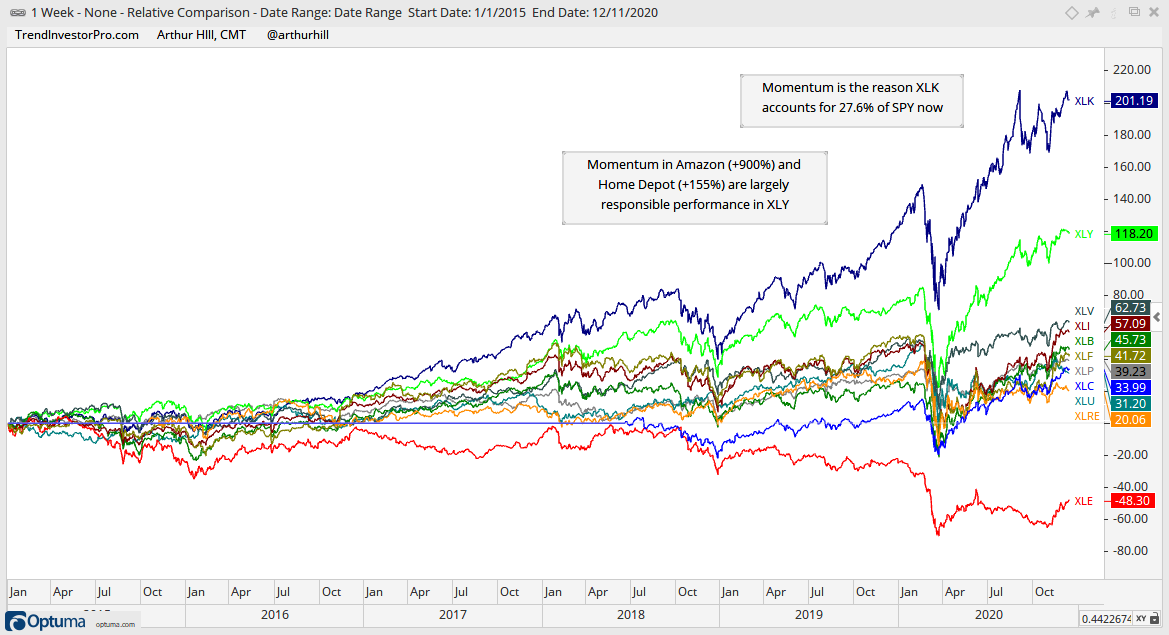
The momentum effect also triggered big changes in the sector weightings within the S&P 500 over the last five years. The Technology sector accounted for around 20.7% at the end of 2015 and is now 27.6% (Source: Siblis Research). Conversely, the Energy sector accounted for 6.5% in 2015 and is currently just 2.33%. This was not a conscious decision based on a fundamental outlook. The weightings changed because price advanced for the Technology SPDR (XLK) and declined for the Energy SPDR (XLE). SPY as a whole benefited from the outperformance.
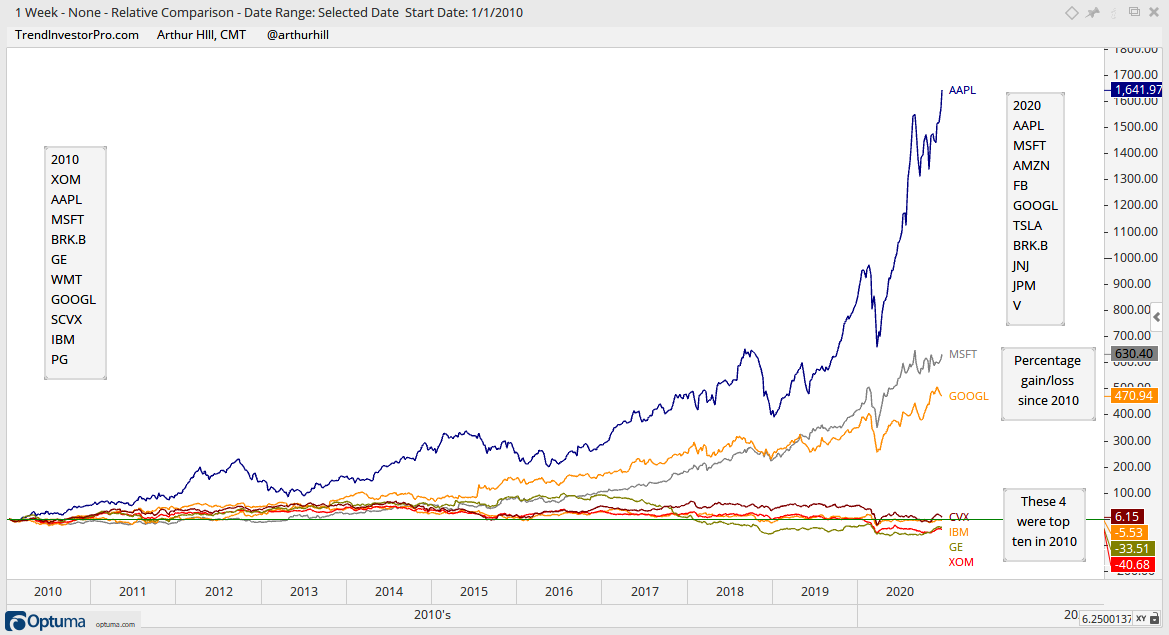
Similarly, momentum driven price moves in individual components drive the index weightings and performance. ExxonMobil was the biggest stock in the S&P 500 in 2010. General Electric was still prominent at number 5, IBM was 9th and Chevron made the top ten at number 8 (Source: ETFDB.com). These four are clearly out of the top 10 in 2020. Apple, Microsoft and Alphabet became even bigger. Meanwhile, Amazon became huge, Facebook was added in December 2013, NVDA soared some 2000% the last five years and NetFlix replaced the NY Times in December 2010.
Momentum stocks overpower the duds and drive the S&P 500. The S&P 500 and SPY as a whole capture these changes and benefit from momentum leaders. The winners become bigger and contribute to gains in an outsized manner. The losers become smaller and less significant to performance. This is also very similar to letting your profits run and cutting your losses. Investors benefit because the market-cap weighted SPY is rewarding price gains (uptrends) and punishing price declines (downtrends). This is also true for QQQ and other market cap weighted ETFs.
ETFs as Big Shareholders
In a separate, but possibly momentum-related, development, note that ETFs have become HUGE shareholders in individual stocks over years. As an example, three of the top four institutional holders for Apple are Vanguard (7.53%), Blackrock (6.29%), Berkshire Hathaway (5.55%) and State Street (3.96%). Source: Yahoo! Finance. These three hold almost 18% of the outstanding shares in Apple and there are probably a few smaller ETF holders. Berkshire and the non-ETF holders have company driven reasons to own Apple. ETFs have price-driven reasons.

Tracking the Big Movers in SPY, QQQ and QQQJ
Stocks that move from the Nasdaq 100 Next Gen ETF (QQQJ) to the Nasdaq 100 ETF (QQQ) are the momentum leaders that are growing their market cap. This is also true for stocks that move from the S&P SmallCap 600 to the S&P MidCap 400, and from the S&P 500 to the S&P 100. A few of these stocks in QQQJ will make probably make it to the S&P 100 in the next five to ten years.
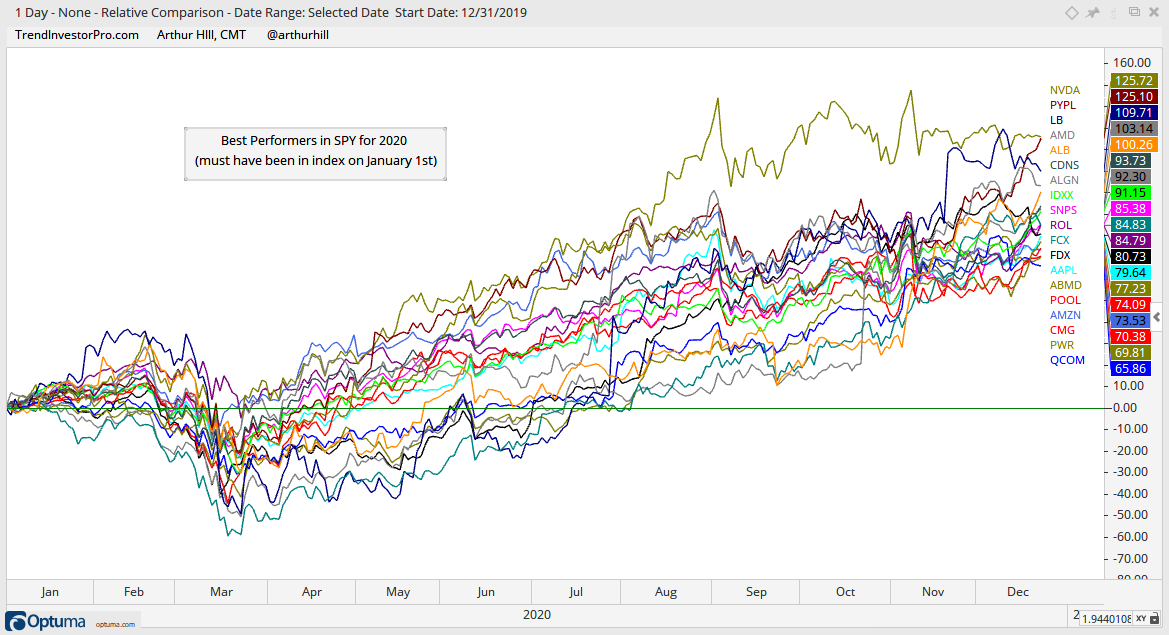
Turning back to the idea that some 20% of stocks in the S&P 500 account for 80% of the gains, the chart below shows the top 20 performers within SPY this year. Note that I am only counting stocks that were in the ETF the entire year. Thus, Tesla does not make the cut because it has been part of SPY for just one day. Here is a symbol list: nvda, pypl, lb, amd, alb, now, fcx, algn, cdns, idxx, rol, fdx, snps, aapl, admd, amzn, pool, qcom, cmg, pwr
The next chart shows 20 biggest gainers in QQQ this year. Eight were added to the ETF during the year and got a running start before being added to the ETF (such as Tesla). Most went through QQQJ first and then jumped to first division. 16 stocks are up between 74% and 289%. Four stand out with gains between 400% and 676% (PTON, ZM, MRNA, TSLA). Here is a list of symbols: tsla, mrna, zm, pton, pdd, docu, meli, okta, nvda, jd, pypl, team, amd, algn, cdns, idxx, mtch, snps, mrvl, aapl

The next chart shows the 20 biggest gainers in QQQJ this year. These are stocks that are currently in QQQJ. Thus, some may have been added during 2020 and a few were added in December. Nonetheless, these are clear momentum leaders. Here is a list of symbols: enph, run, dkng, bili, zs, ttd, sedg, mdb, sedg, mdb, ddog, fivn, qdel, roku, nuan, coup, wix, stne, nvcr, logi, mpwr, iac

QQQ versus QQQJ
The chart below shows QQQ and QQQJ since the latter started trading (October 13th). This is not much of a sample size, but it seems that QQQJ would act like QQQ on Red Bull. The highs will be higher and the downs will be lower. In other words, QQQJ has higher beta stocks that are more volatile and this means it will outperform on the way up and underperform on the way down.

The green lines show the percentage gain since November (35 trading days ago). QQQ is up around 15% and QQQJ is up some 25%. QQQJ closed above its October 14th high before QQQ (red line) and held further above its 20-day SMA than QQQ (dotted green line). QQQJ is showing more beta so far.
Even though QQQJ has smaller stocks with higher betas on average, the weighting of the components distributes the risk more evenly. The top ten stocks in QQQ account for 53% of the ETF, while the top ten stocks in QQQJ account for 18%. TradeDesk (TTD), Crowdstrike (CRWD) and ROKU (ROKU) are the largest holdings in QQQJ and they account for around 2.5% each. QQQJ is not as top heavy as QQQ and this distributes the volatility more evenly. QQQ is very reliant on the performance of five stocks: APPL, GOOGL, FB, AMZN and MSFT.
Conclusions
We never know which stocks will become tomorrow’s mega caps, but the path is pretty clear. Many of these start in the Nasdaq 100 Next Gen ETF (QQQJ) and then graduate to QQQ. Some 85 stocks in QQQ are also part of SPY. These market-cap driven ETFs will capture momentum over time by rewarding outperformance and punishing underperformance in a systematic fashion though rebalancing and reconstituting. Traders looking for a list of high octane stocks can consider the stocks in QQQ and QQQJ. In fact, this pairing is a pretty good alternative to the IBD Growth 250 list, which is part of MarketSmith.