")
This content is for subscribers. (Login or Subscribe)

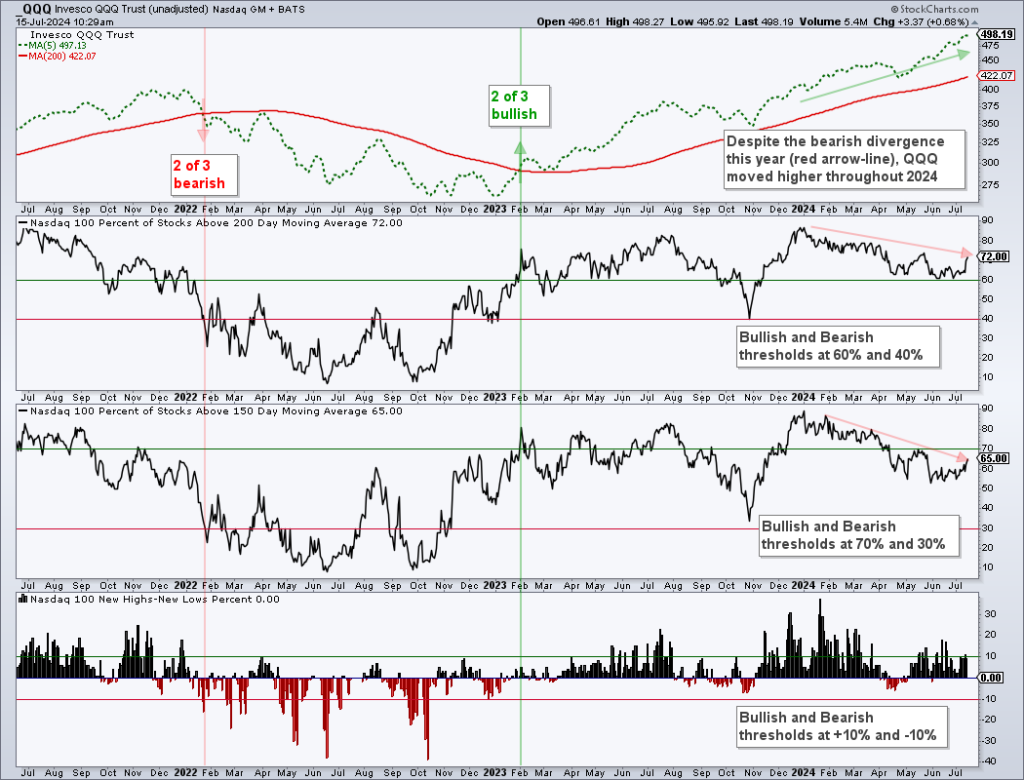
This Breadth Indicator Points to More Downside – And a Potential Opportunity
QQQ is leading the market lower and weighing on tech stocks. The long-term trend is up and oversold breadth could present an opportunity. Short-term breadth has yet to become oversold and this means we may have further downside first.
This Breadth Indicator Points to More Downside – And a Potential Opportunity Read More »