
The next report/video will be on Thursday, April 10th.
Everything, well, almost everything, fell the last four trading days. This includes the gold and US Treasury Bonds. The Dollar was hit hard, which means other currencies gained. Stocks, industrial metals, oil, crypto and foreign stocks were all down the last four days. Within the US stock market, all sector ETFs and all but two industry group ETFs are below their 200-day SMAs. Only the Gold Miners ETFs (GDX and GDXJ) are trading above their 200-day SMAs. This is a bear market.
ETFs Up over the last four days: FXF, FXY, FXI, BWX, IEI, CORN, STIP
ETFs above their 200-day SMAs: CORN, CTA, EPOL, ESPO, EWP, FXF, FXE, GLD, GDX, GDXJ, FXY, GREK, IEI, STIP, UNG
The broadness of the selling pressure is disconcerting, as is this week’s decline in Treasury Bonds, which means long-term yields rose in the face of falling stock prices. There is nowhere to hide and the economy cannot count on lower interest rates. Today’s report will analyze the current SPY chart, show the next twenty support levels and then look at the 2008 meltdown. We then turn to the breakdown in TLT, strength in the Yen and a Bullish Setup Zone for gold.
Report Headlines
- SPY Hits Potential Support Zone, BUT…
- Plenty of “Support” Levels to Watch
- 2008 Plunge and Volatility
- Worrying Price Action in TLT
- 7-10 Yr Treasury Bond ETF Holds Upswing
- Yen ETF Leads in 2025
- Gold SPDR Hits Bullish Setup Zone
I will update the Market Regime page later today and post a video on Thursday.
SPY Hits Potential Support Zone, BUT…
The S&P 500 SPDR (SPY) fell to a potential support zone this week, but support levels are less reliable in bear markets because negative outcomes are more likely in bear markets. It is all about probabilities. Sure, SPY is very oversold and this zone could give way to a bounce, but the bigger downtrend and bear market are the dominant forces at work. These forces can override the bounce at anytime.
Just to review, this weekly chart shows SPY breaking the prior low and 40-week SMA with an 11% decline into mid March. Similar to the breakdown in January 2022, this is the move that broke the bull’s back. SPY stalled around 560 for a couple weeks and then broke down with a plunge to the 480-500 area. The gray shading marks a potential support zone using the 61.8% retracement and the April 2024 low.
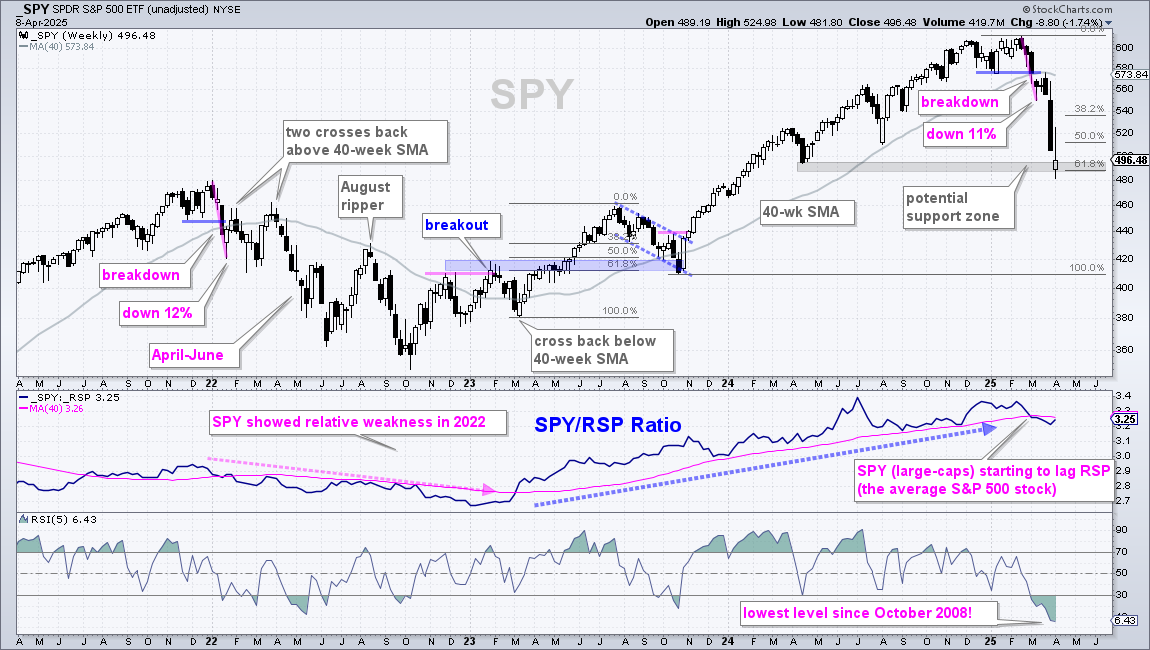
SPY is also oversold with RSI(5) moving to its lowest level since October 2008, which was the middle of the Global Financial Crisis. Perhaps the current crisis compares. Note that RSI(5) moved below 30 on March 7th and continued lower as SPY failed to bounce. SPY was and remains oversold and ripe for a bounce, but the bear market dominates the big picture.
Notice that I am calling this a “potential support zone”, as opposed to a Bullish Setup Zone. I do not consider this a Bullish Setup Zone. Pullbacks within uptrends lead to bullish setups. Plunges and oversold conditions within bear markets are not considered bullish setups, even though they may lead to a bounce.
Plenty of "Support" Levels to Watch
As you may have guessed, I was not serious about the next twenty support levels. Support levels are everywhere, if you look hard enough. I put forth a potential support level on the chart above, but support within a downtrend is a contradiction in terms because lower lows are expected in downtrends. Support breaks are expected. Support levels simply offer hope on the way down (the slope of hope). The chart below shows SPY with lots of possible support levels based on horizontal lines, retracement levels and the 200-week SMA. Take your pick. The final low (support level) is usually not known until after the fact.
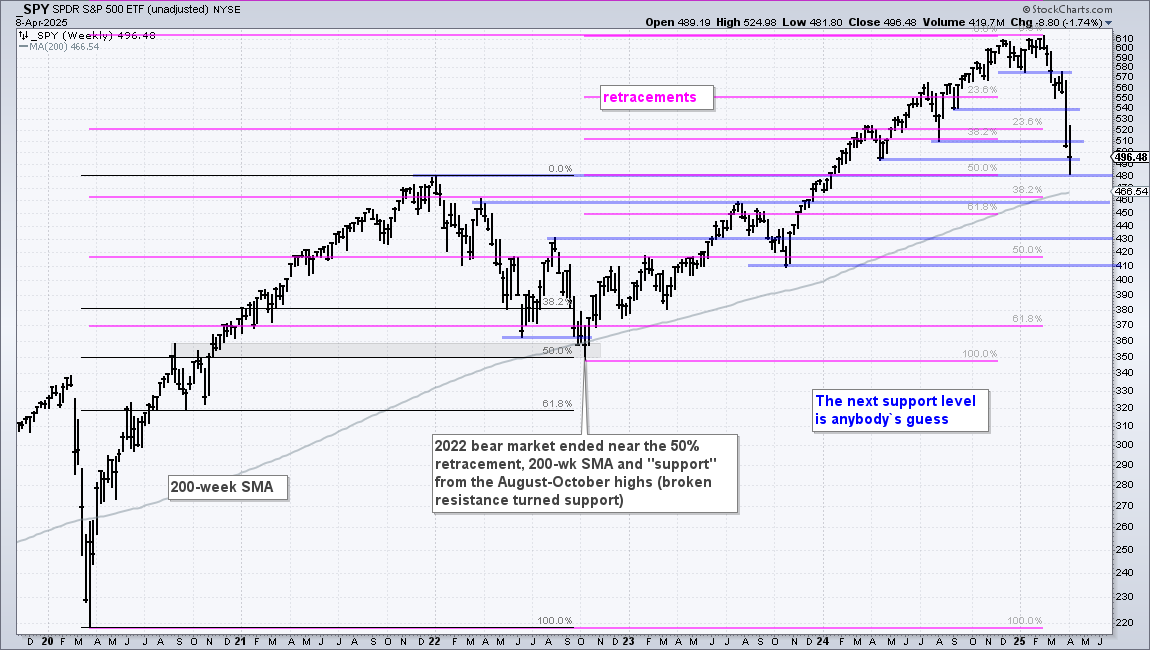
The gray shading shows when the 2022 bear market bottomed. SPY bottomed near the 50% retracement, the 200-week SMA and broken resistance from the August-October 2020 highs. Also notice that SPY bottomed just after breaking the June 2022 low (a fresh support break). One takeaway here is to look for bottoms or bounces just after a support break.
2008 Plunge and Volatility
There are few precedents for what just occurred in the US stock market. SPY fell 18.76% in 34 days (7 weeks), and 12% in four days. Only October 2008 (GFC) and March 2020 (Covid) compare. A bear market was already underway in October 2008 and stocks ultimately bottomed in March 2009. A “V” reversal formed in March 2020 and stocks roared higher into yearend (and throughout 2021). For the current decline, a bear market was already underway because breadth and the long-term trends were bearish since March 12th. We do not know how long or far this bear market will extend. The only thing we really know is that current evidence is bearish, SPY is below its 40-week SMA and volatility is through the roof.
The chart below shows SPY from 2007 until 2010 with the pink shading marking the 40-week SMA. Negative outcomes are more likely when SPY is below the 40-week (in the pink shading). SPY fell 26% in two weeks during October 2008 and then turned very volatile with five 10% swings in four weeks (gray shading). Note that you need a daily chart to see the actual swings. After a brief counter-trend bounce into yearend, SPY fell in early 2009 with the bear market ending after a 4-week 20% decline into March. This is when traders capitulated by giving up and throwing in the towel.
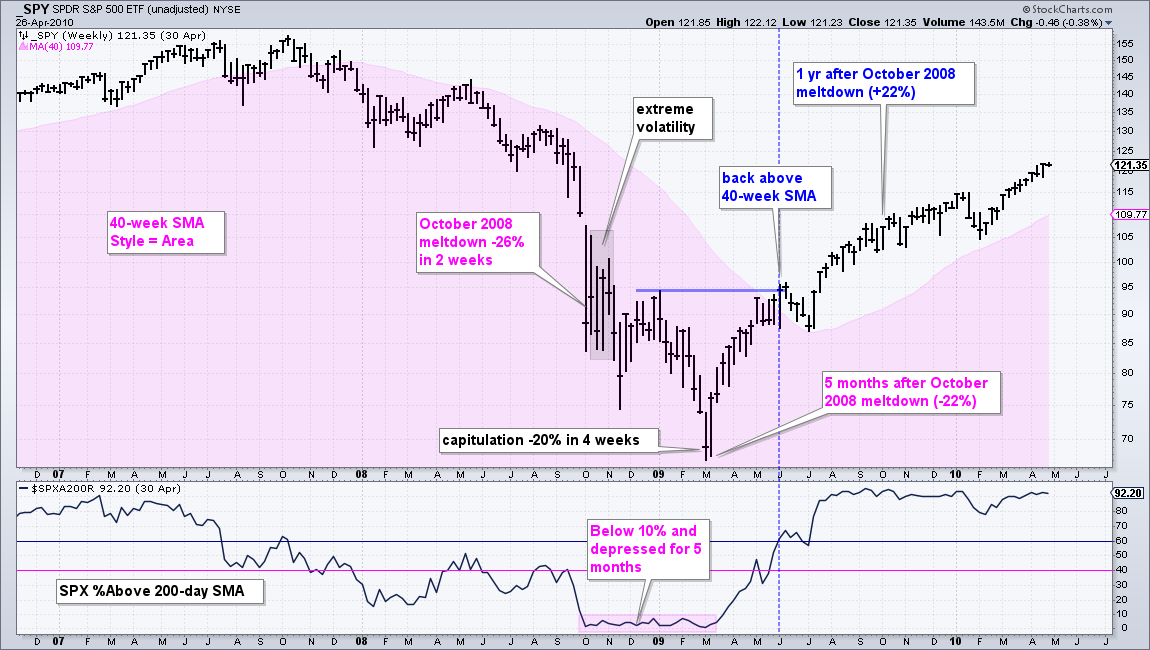
Not all bear markets end within his type of capitulation – and it is also almost impossible to catch the exact low. Traders buying after the October meltdown endured another 22% decline into March 2009, but were up 22% a year later. As far as trend signals, SPY reversed its downtrend with breaks above the January 2009 high and 40-week SMA in early June 2009. Also notice that S&P 500 Percent Above 200-day SMA ($SPXA200R) crossed above 60%.
Where are we now? Truth be told, nobody really knows. As noted above, the weight of the evidence is bearish and volatility is high. This suggests that we may be in for some very choppy trading. We may be able to catch a capitulation setup in the coming months. Otherwise, it is time to wait for the breadth indicators to turn net bullish and for SPY to reclaim its 40-week SMA. I am also monitoring for a breadth thrust.
Worrying Price Action in TLT
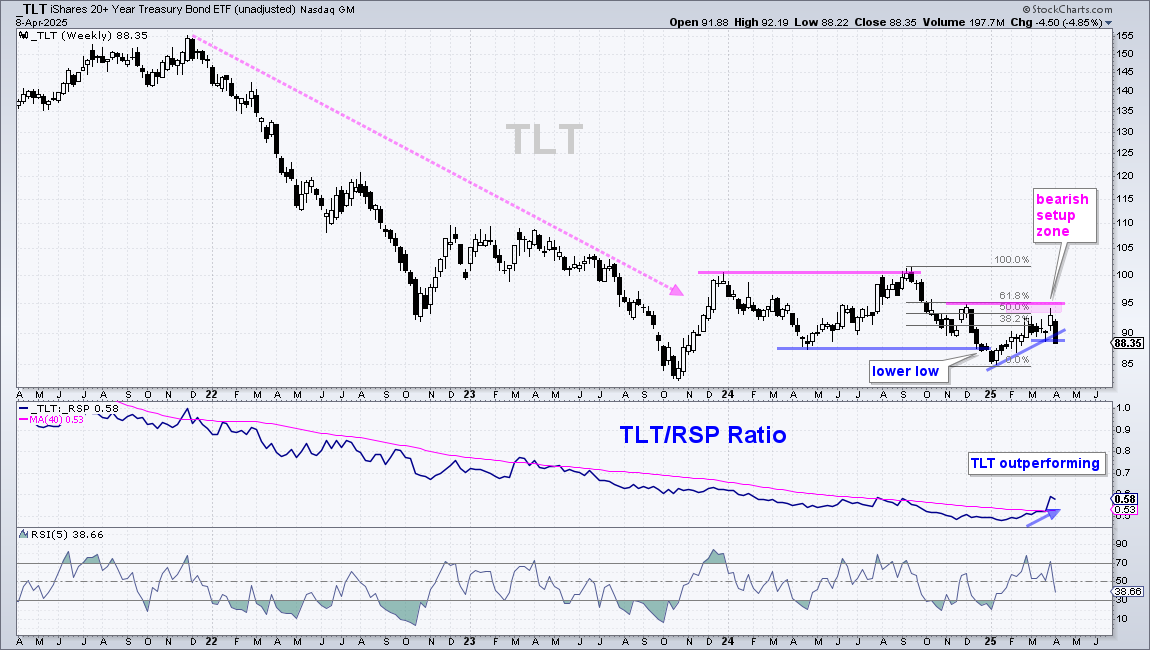
The stock market is plunging and the 20+ Yr Treasury Bond ETF (TLT) failed to hold its bid. Bonds are relative safe-havens and should benefit from excess weakness in stocks. However, there are many factors in play right now: tariffs, inflation, economic weakness, new global order, re-alignments and foreign holders. The biggest holders of US Debt are Japan (> $1 trillion), China ($759 billion) and the United Kingdom ($723 billion). Things that make you go hmm…
Long-term interest rates rise when bond prices decline so it is negative when stocks and bonds decline together. Lower interest rates are supposed to cushion the fall and we are not seeing that. The weekly chart below shows TLT forging a lower low in December, bouncing into early April and falling sharply this week. Note that TLT reversed near resistance from the November high and in the 50-61.8% retracement zone. The week is not over yet, but TLT is breaking support at 90 and this would signal a continuation lower. Further weakness in TLT would mean higher long-term yields (20-30 year yields).
7-10 Yr Treasury Bond ETF Holds Upswing
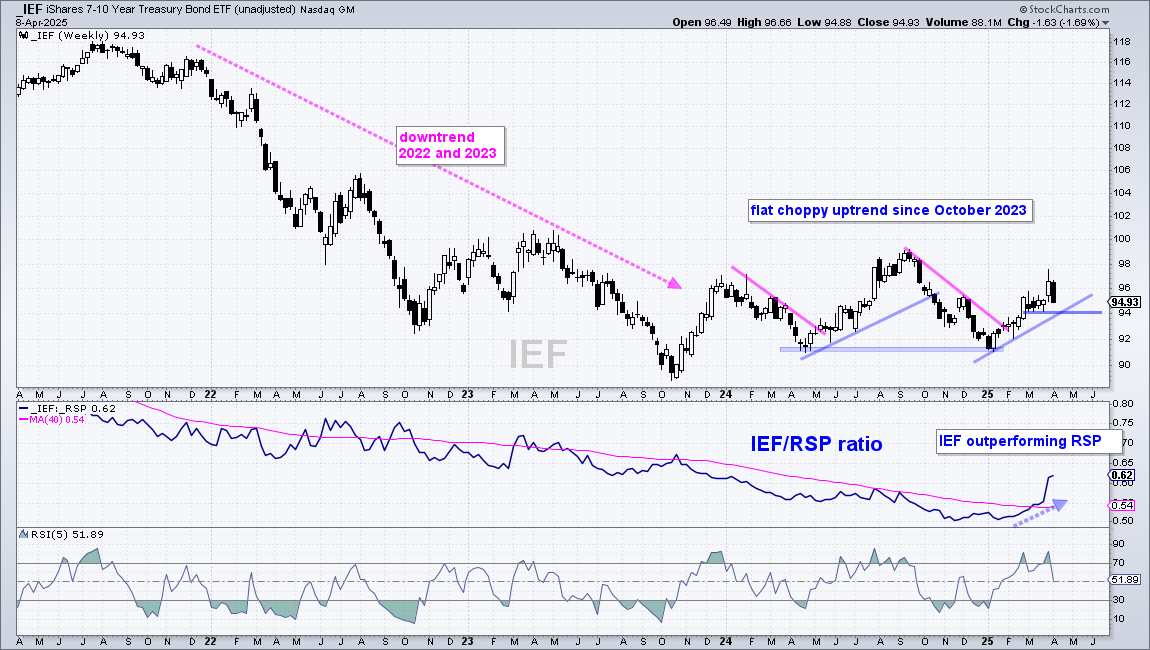
The next chart shows the 7-10 Yr Treasury Bond ETF (IEF) with a stronger chart than TLT. The longer we go out the curve, the weaker the bonds. TLT is weaker than IEF, and IEF is weaker than the 3-7 Yr Treasury Bond ETF (IEI). Nobody want to go long-term! IEF shows four swings since early 2024 and the current swing is up. The ETF also fell sharply the last two days, but has yet to break short-term support at 94. A move below this level would reverse the upswing and call for lower prices (higher 7-10 year bond yields).
Yen ETF Leads in 2025
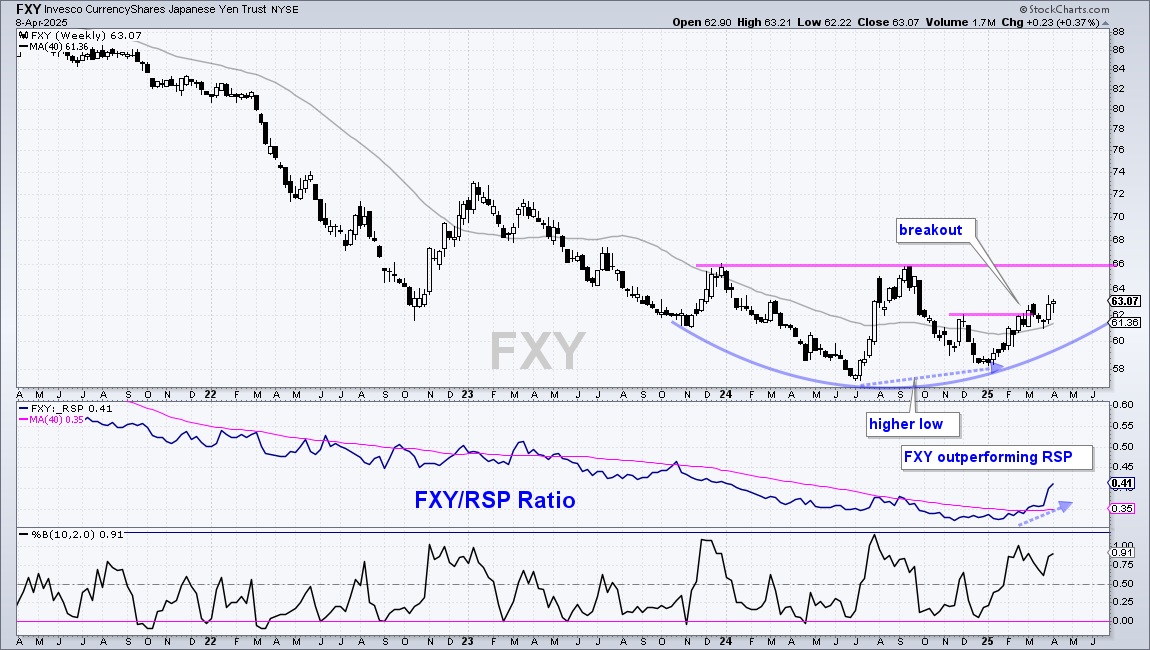
The Dollar is the weakest currency over the last few weeks. Currencies trade in pairs so this means other currencies are stronger than the Dollar. The chart below shows weekly candlesticks for the Yen ETF (FXY). FXY formed a higher low from July to January and broke resistance with an advance into March. The ETF also broke the 40-week SMA, which turned up over the last few weeks. I view this as bullish price action and expect a resistance challenge at 66. Overall, a big rounding bottom could be forming and a breakout at 66 would be long-term bullish.
Gold SPDR (GLD) Hits Bullish Setup Zone
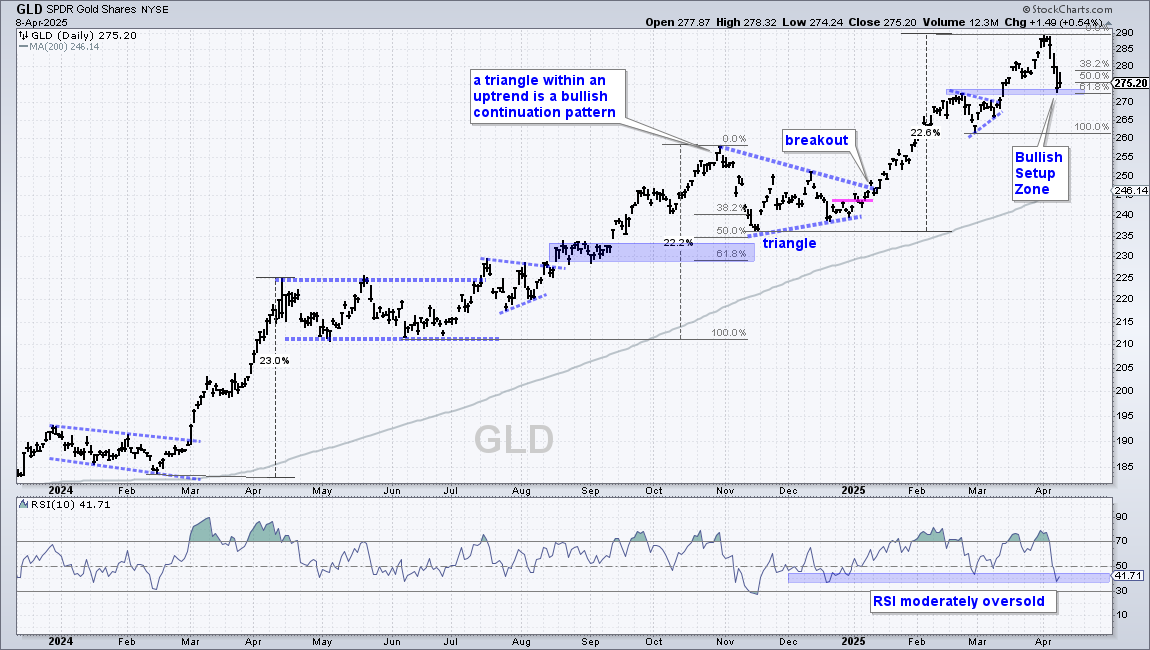
Gold was not spared over the last four trading days, but the ETF remains in a long-term uptrend, which is a rarity right now. The chart shows daily bars with the Gold SPDR (GLD) well above the rising 200-day SMA. GLD fell from 290 to 273 with a sharp 3-day decline and then firmed on Tuesday. It is firming in a Bullish Setup Zone marked by the 50-61.8% retracements and broken resistance (blue shading). The indicator window shows RSI hitting the low 40s, which is a moderately oversold condition. GLD is setting up for a bounce here.
Send feedback to support(at)trendinvestorpro.com or use the contact form.