")
The next report will be on Thursday, February 6th.
There were many wedge breakouts in mid January and most of these breakouts are holding. Chartists must now set the level that proves these breakouts wrong. Today’s video starts with an example using the Software ETF. We then show the re-evaluation levels for several ETFs with wedge breakouts. Elsewhere, the Technology SPDR is lagging, the Healthcare SPDR is rebounding, the Biotech ETF is going for a breakout and the Gold SPDR is leading with a new high.
If viewing this PDF in a browser, right click on the
chart to open as a new tab or window.
Use CRTL and the Plus or Minus keys (+ -) to zoom.
Video Headlines
– SPY Forms Bullish Cup-with-handle Pattern
– QQQ, MDY and RSP Test Wedge Breakout Zones
– IJR and IWM Fall Back below Breakout Zone and Lag
– Technology SPDR (XLK) Tests Support and Underperforms
– Finance SPDR (XLF) Holds Near Highs and Leads
– Industrials SPDR (XLI) Pulls Back after Breakout Surge
– Communication Services SPDR (XLC) Hits New High and Leads
– Healthcare SPDR (XLV) Challenges 200-day SMA and Leads in 2025
– Utilities SPDR (XLU) Turns Volatile after Wedge Breakout
– Mag7 ETF (MAGS) Struggles with Breakout but Holds Support
– ARTY, BOTZ and AIG Turn Volatile, but Hold Breakouts/Support
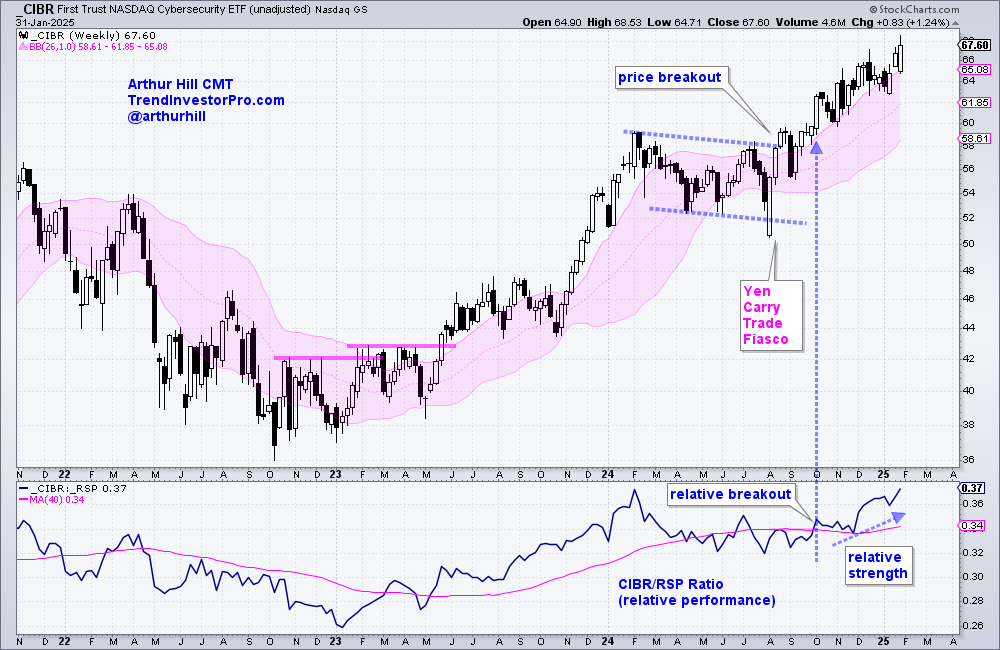
– CIBR and CLOU Lead with New Highs
– SKYY, FINX and IGV Hold Wedge Breakouts
– Aerospace & Defense ETF (ITA) Leads with New High
– IFRA and PAVE Fall back after Breakout Surges
– GLD Extends on Breakout and Hits New High
– IBIT Breaks Pennant Line and Holds Breakout Zone