")
This content is for subscribers. (Login or Subscribe)

ETF Report – Re-evaluation Levels for Wedge Breakouts – 9 Leaders
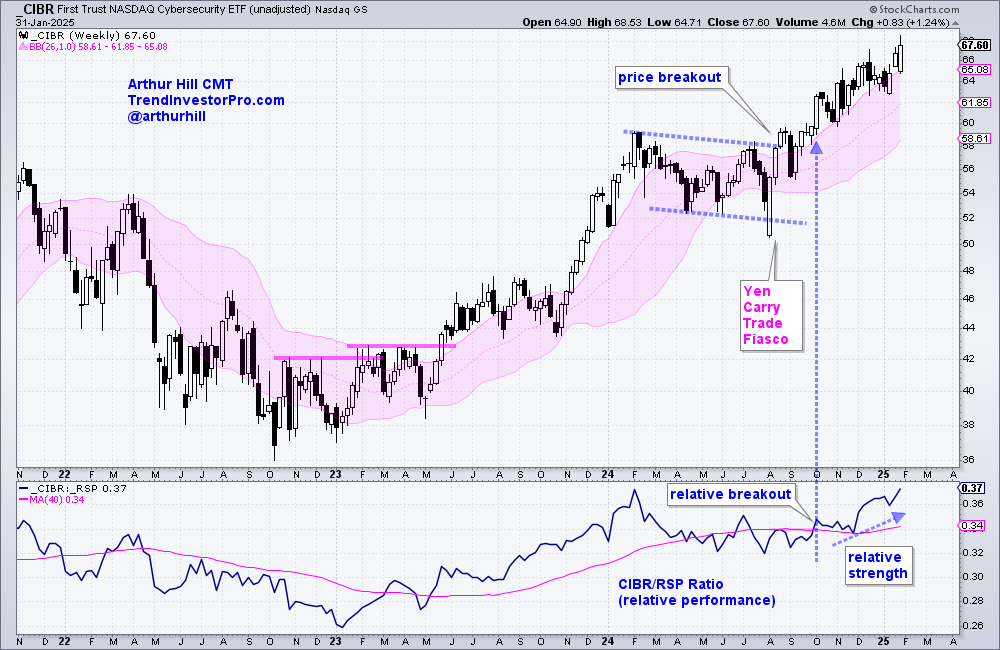
The weight of the evidence remains bullish for stocks, despite an uptick in volatility and a wild news cycle. We are seeing upside leadership from finance, communication services, defense, medical devices, pipelines, cloud, cybersecurity and gold. We are also seeing lots of wedge/channel breakouts and most are holding. Here is the leading ETF symbol list
ETF Report – Re-evaluation Levels for Wedge Breakouts – 9 Leaders Read More »