Banking ETFs Form ST Bullish Continuation Patterns
XME Takes One Step Backward
Two Video Game Stocks Correct after New Highs
Motorola Solutions Firms after Sharp Pullback
The next Chart Trader will be posted on Thursday morning, January 11th.
Broad Market Recap
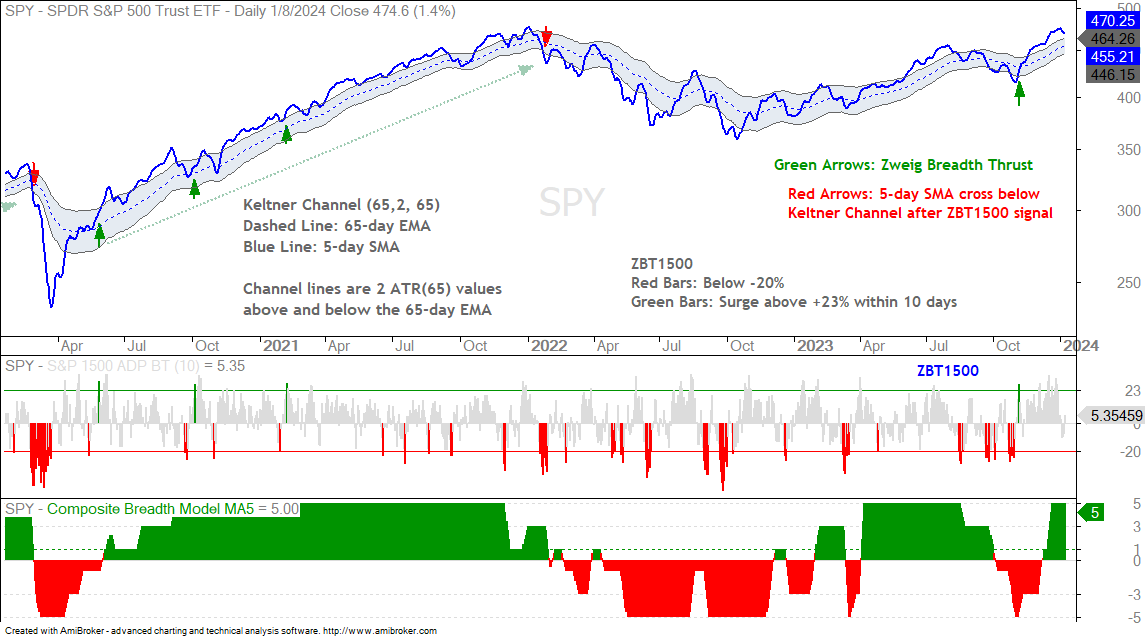
The broad market environment remains bullish. It all started with the Zweig Breadth Thrust and channel breakout in SPY in early November. The advance broadened in December with the Composite Breadth Model turning bullish. Now we have the usual bull market conundrum: SPY and QQQ are still looking overbought after big advances since October. Overbought conditions could give way to a corrective period, but timing corrections within uptrends is a fool’s errand. Even so, seasonal patterns argue for a correction sometime between now and mid March.
SPY and QQQ in Uptrends
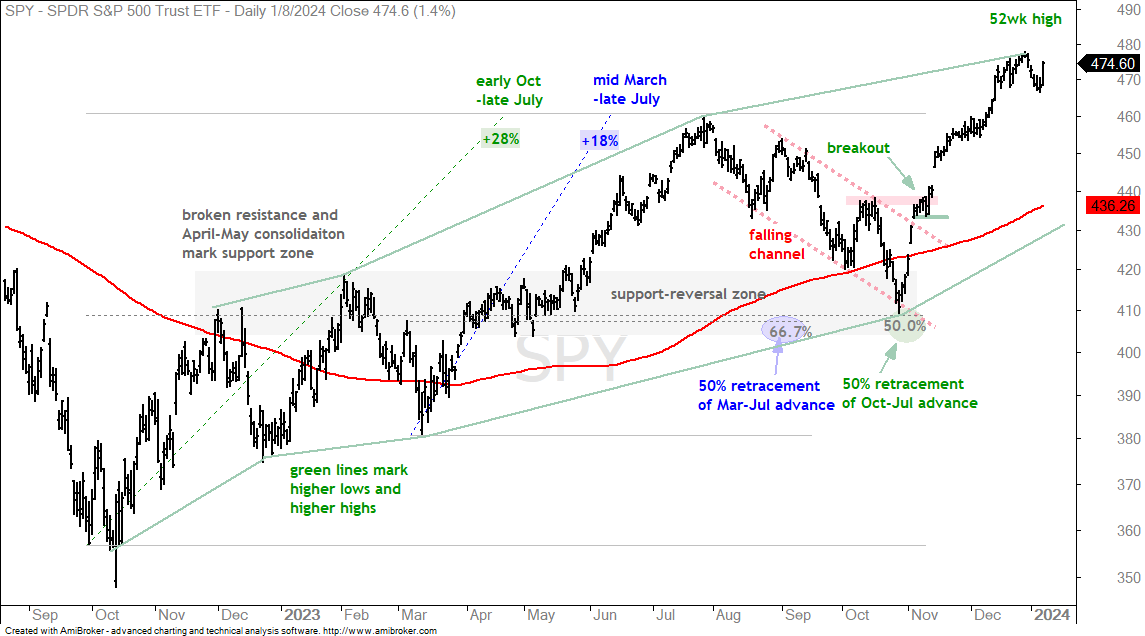
SPY remains in a strong uptrend and near a 52-week high after Monday’s surge. The ETF hit a 52-week high at the end of January, fell a whopping 1.6% last week and surged 1.4% on Monday. Last week’s decline created a short-term oversold condition in many ETFs and stocks. This condition gave way to Monday’s bounce. Long-term, the falling channel breakout was the last “signal”. The green lines on top and bottom mark the higher highs and higher lows that define the long-term uptrend. Medium-term, SPY advanced some 16% from late October to late December and became overbought along the way. I still view SPY as overbought and this condition could lead to a correction in the coming weeks.
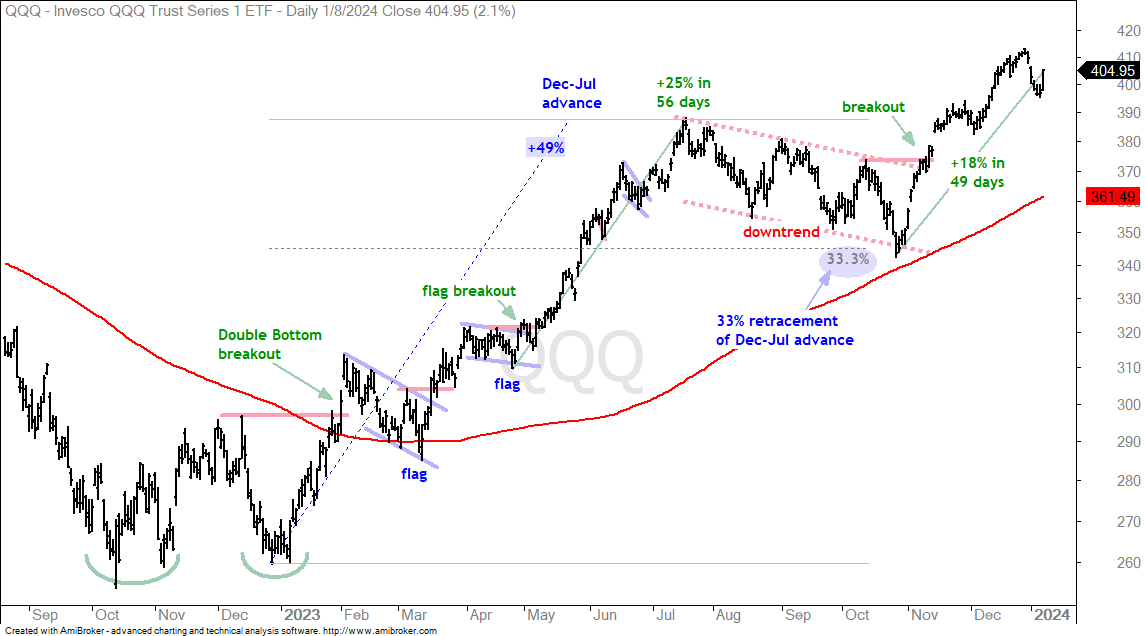
The next chart shows QQQ hitting a 52-week high in late January, falling 3.1% last week and surging 2.1% on Monday. Again, the ETF became short-term oversold last week and Monday’s bounce is the mean-reversion bounce. Overall, the long-term trend is up and QQQ remains extended after a big move from late October to late December. This move looks similar to the surge from late April to mid July, which saw QQQ gain 25% in 56 trading days. This move gave way to the summer correction. QQQ is currently up 18% the last 49 trading days. Again, the odds for a correction are high within the coming weeks.
Seasonal Pattern for S&P 500
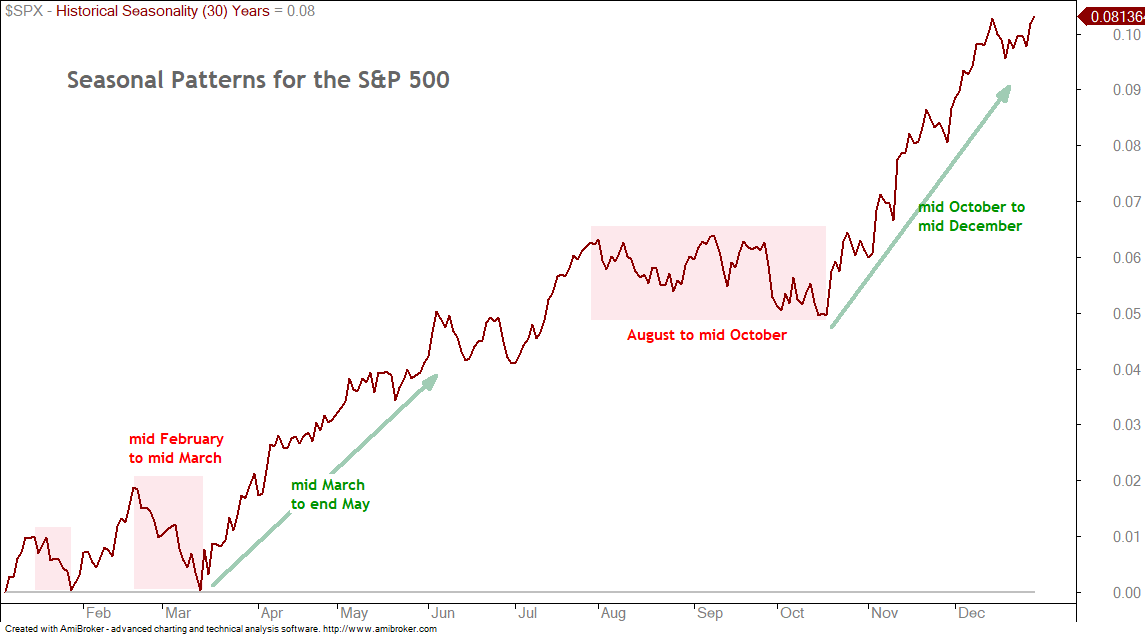
Seasonal patterns may offer a clue for the coming weeks. The chart below shows the seasonal pattern for the S&P 1500 over the last 30 years. Four periods stand out. First, there are two exceptionally strong periods: mid-March to end-May and mid-October to mid-December (green arrows). The first period ends along with the best six months pattern, which is always featured in the Stock Trader’s Almanac. According to Jeffrey Hirsch, the best six months runs from November to April (sell in May and go away). The worst six months runs from May to October.
The two negative periods are from mid February to mid March and August to mid October (red shading). Seasonally speaking, February is one of the weakest months. This weak period then gives way to an exceptionally bullish period. Weakness from August to mid-October also gives way to an exceptionally bullish period the rest of the year. Seasonal patterns do not figure into my timing models. However, the seasonal pattern suggests we could see decent correction or pullback between now and mid March.
Leaders with 52-week highs the last 10 Days
The list below shows some ETFs that recorded 52-week highs within the last 10 trading days. Stocks and ETFs with recent 52-week highs are leading the market. Even though many fell sharply the first week of January, they fell from 52-week highs and last week’s declines did not reverse the long-term uptrends.
Industry Group ETFs: XHB, ITA, PPA, IBB, XBI, XME, SLX
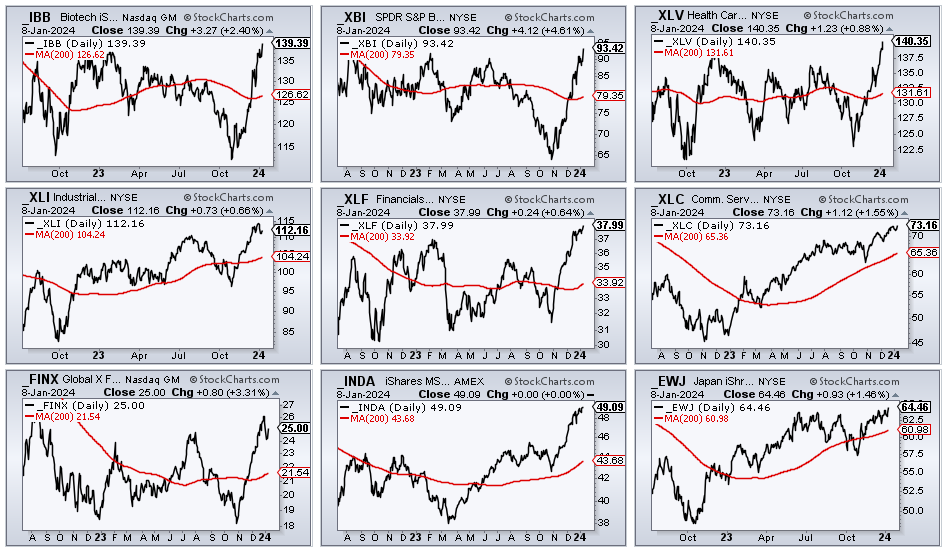
Overall, we are seeing leadership in the Healthcare sector (XLV) and the Biotech group (XBI, IBB). The CandleGlance chart below shows all three hitting 52-week highs here in January. The Finance SPDR (XLF) also hit a 52-week high and is a leading sector. Outside of the US, the India ETF (INDA) surged to new highs and the Japan ETF (EWJ) recently broke out to a 52-week high.
Chart Analysis, Setups and Trading Ideas
Banking ETFs Form ST Bullish Continuation Patterns
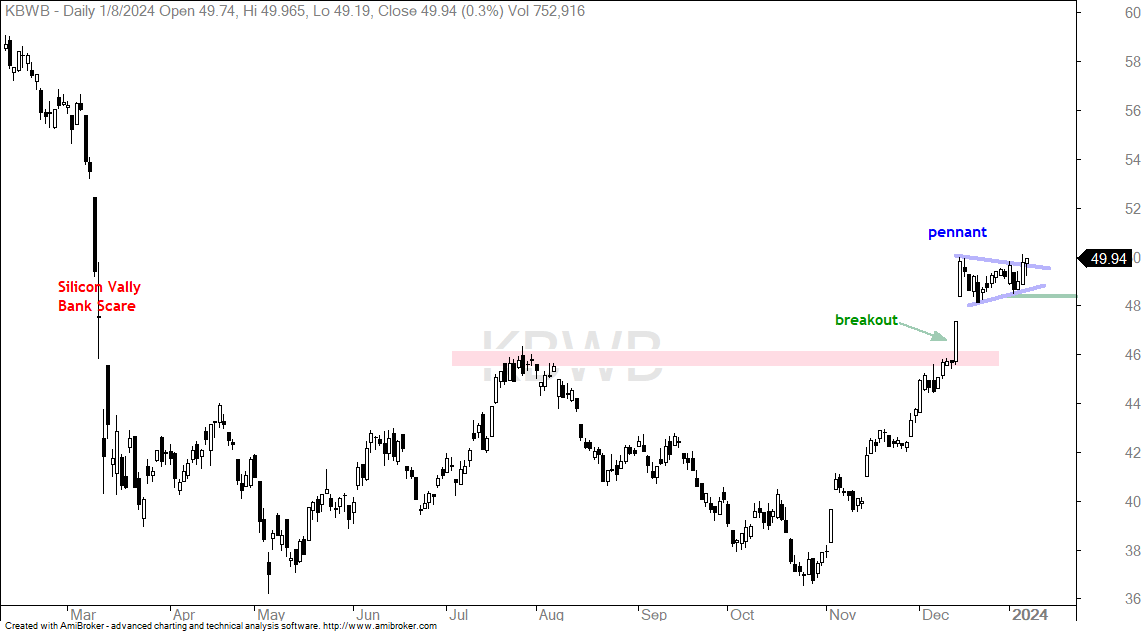
There are three bank ETFs: the Regional Bank ETF (KRE), the Bank SPDR (KBE) and the Bank ETF (KBWB). All three surged from late October to mid December and corrected into January with short-term bullish continuation patterns. KRE and KBE formed falling flags, while KBWB formed a pennant. These three ETFs are highly correlated, which means they will move in the same direction. I am showing KBWB because it is breaking out of its pennant and seems the strongest of the three. The green line marks the low just before the breakout and a close below 48.4 would negate this breakout.
XME Takes One Step Backward
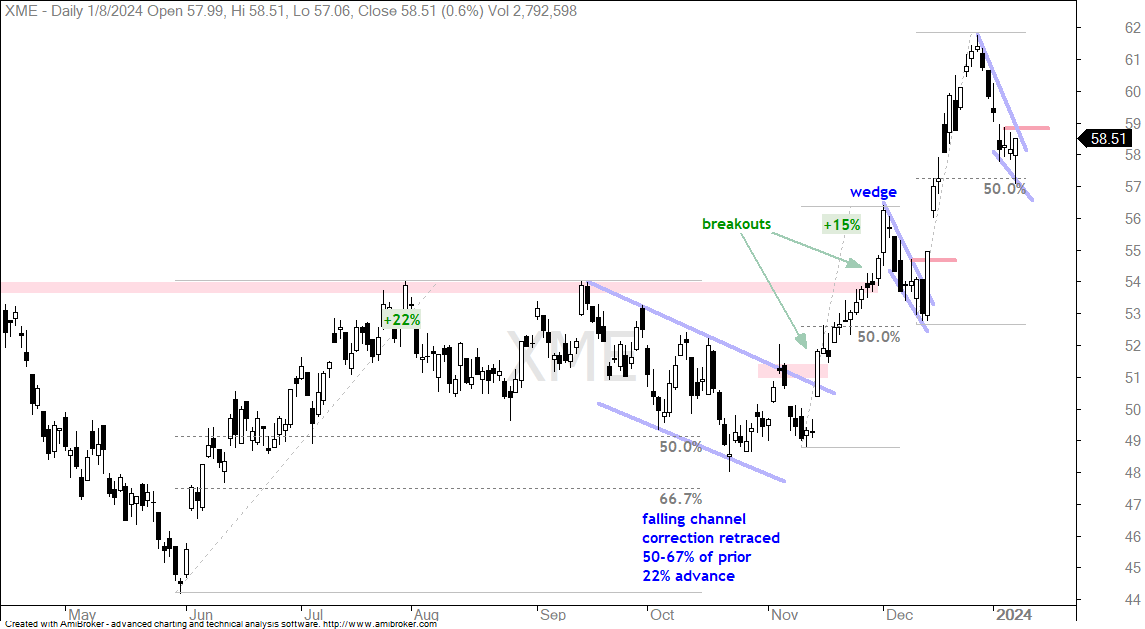
The Metals & Mining SPDR (XME) led the market higher from mid October to late December with a 26% gain and 52-week high. XME is a rather volatile ETF as it followed this surge with a 5% pullback in four days. This pullback retraced half of the prior advance, which means we have a two steps forward and one step backward sequence working. XME firmed on Thursday-Friday and then formed a long hammer on Monday. A follow through breakout at 59 would be short-term bullish.
Two Video Game Stocks Correct after New Highs
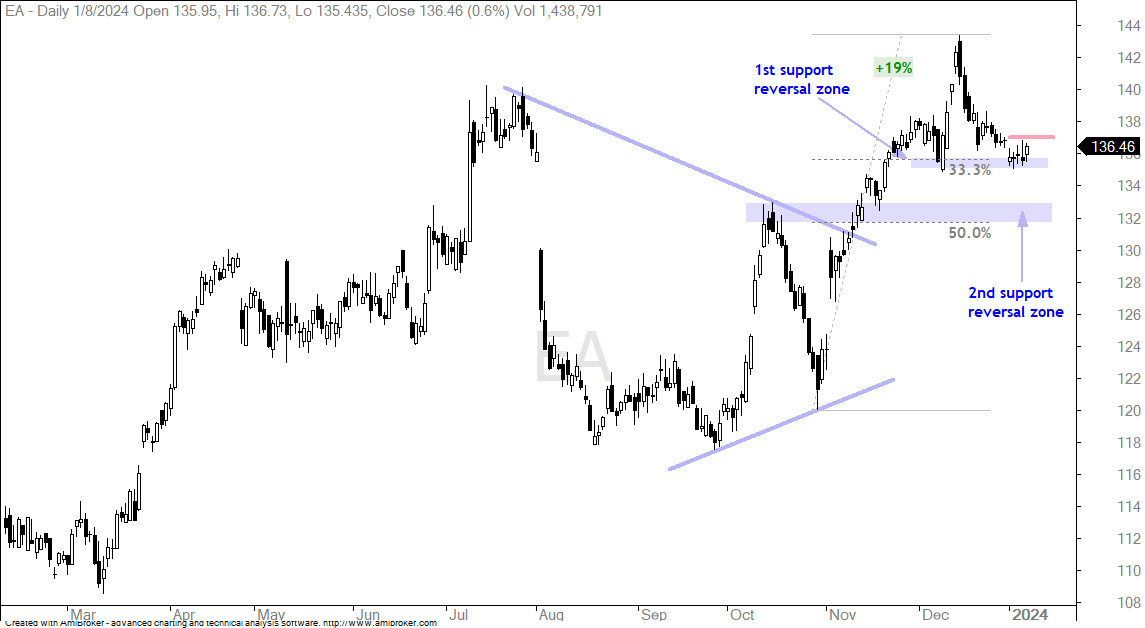
There are quite a few chart showing short-term bullish continuation patterns because of the surge into December and pullback into early January. Electronic Arts (EA) and Take-Two (TTWO), two video gaming stocks, hit new highs in mid December and corrected into early January. The first chart shows EA advancing 19% in twenty trading days. We do not need a momentum oscillator to understand that the stock was overbought. Just because it is overbought, does not mean we can time a pullback. Timing the pullback is NOT the play when the bigger trend is up. The setup occurs AFTER the pullback and when the stock hits a support-reversal zone. EA is setting up because it is near the 33% retracement and the mid December low. The retracement marks a possible reversal area and the mid December low marks support. EA firmed for five days and a break above 137 would be bullish.
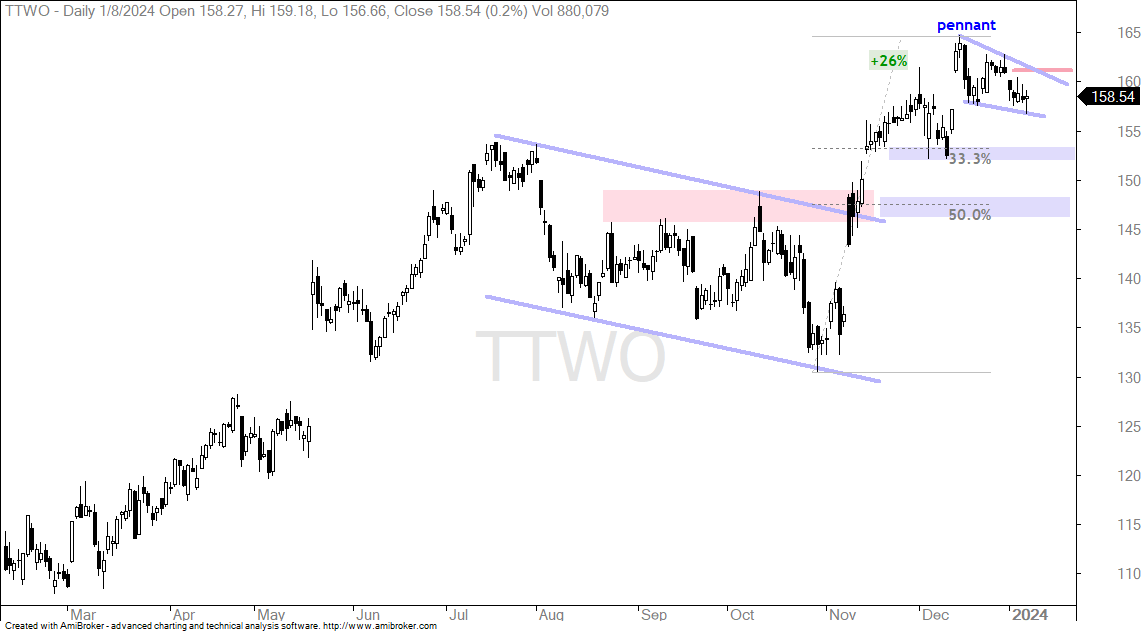
The next chart shows TTWO with a 26% advance into mid December and a pennant pullback into early January. This pennant alleviates the overbought conditions that were present in mid December. It is a bullish continuation pattern and a breakout at 161 would be bullish. The blue shadings mark two support-reversal zones. TTWO remains above these zones. Should a pennant breakout fail to materialize, I would still watch these two zones going forward.
Motorola Solutions Firms after Sharp Pullback
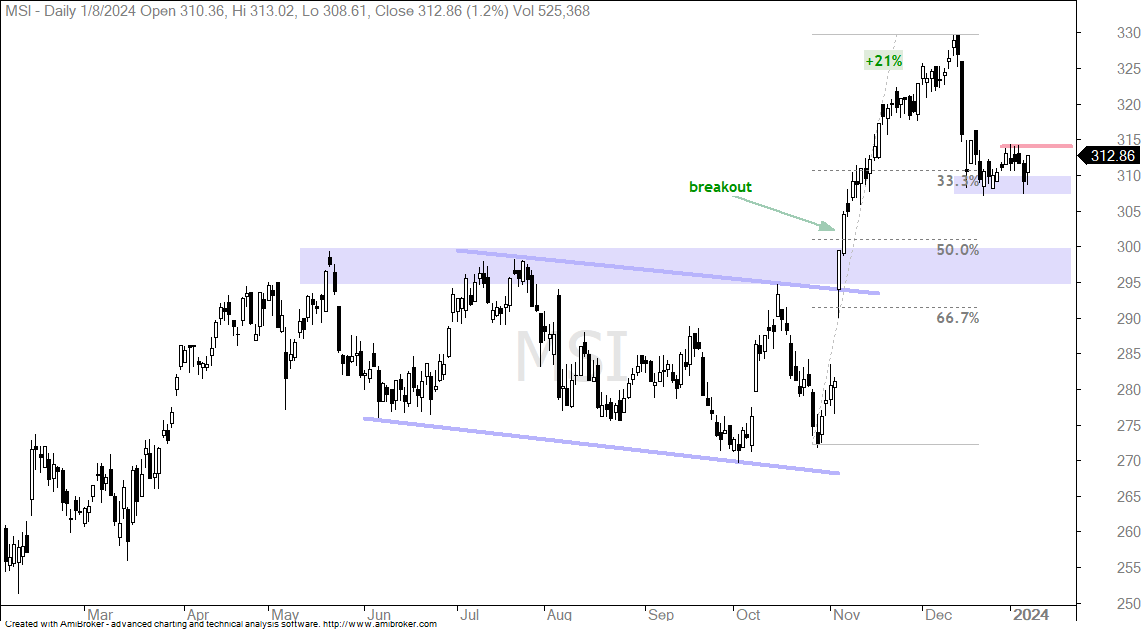
Motorola Solutions (MSI) sports one of the steadiest long-term uptrends that I have seen. I am not going to show it, but the weekly chart shows a steady uptrend from 2015 to 2023 as the stock moves from the 60’s to the 300’s. Most recently, the stock broke out of a large falling channel with a 21% surge into mid December. The stock fell quite hard in the second half of December and then firmed the last two weeks. MSI is firming near the 33% retracement and establishing support in the 310 area. Even though I do not see a falling flag or wedge for trading, this is clearly a pullback within a bigger uptrend. A breakout at 314 would be bullish and I would then set re-evaluation support at 307.