")
Bitcoin is Mostly Positively Correlated to SPY, but One Period Stands Out
- Arthur Hill, CMT

Positive Correlation, but One Period Stands Out
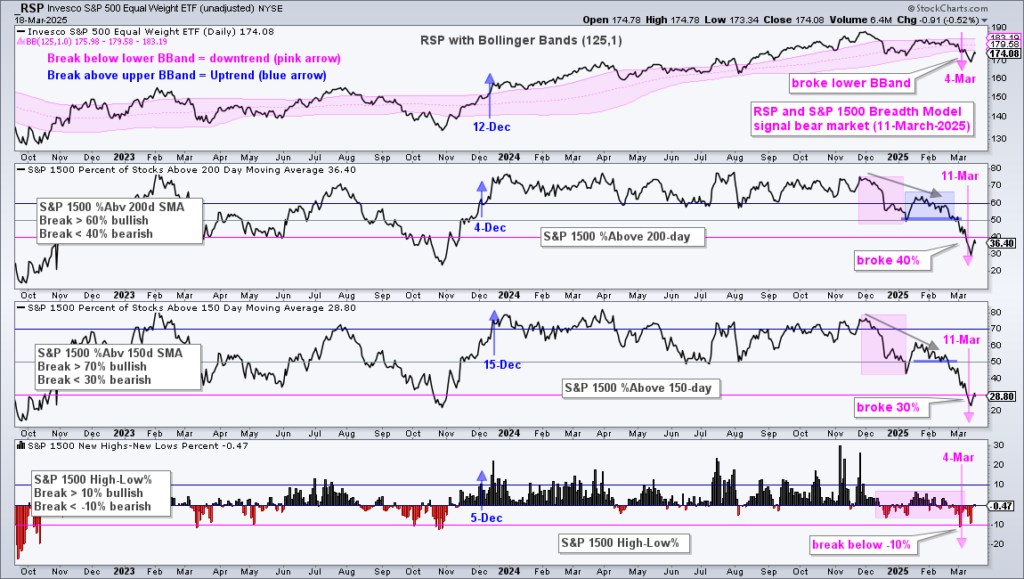
Stocks are in a freefall with selling pressure spreading into industrial metals and other economically sensitive commodities. There are few places to hide in bear markets, and the list of alternatives continues to shrink. Bitcoin, an alternative, is holding up relatively well since March, but this crypto is positively correlated with stocks long-term and has yet to achieve a relative breakout. Today’s report focuses on Bitcoin correlation and relative performance.
With stocks in a bear market, I am looking for alternatives that are less correlated. Bitcoin is an alternative to stocks, but it shows a strong positive correlation to the S&P 500. The chart below shows SPY in blue and Bitcoin in pink with the arrows marking periods when they moved in tandem. For the most part, Bitcoin and SPY move in the same direction, which means they are positively correlated.
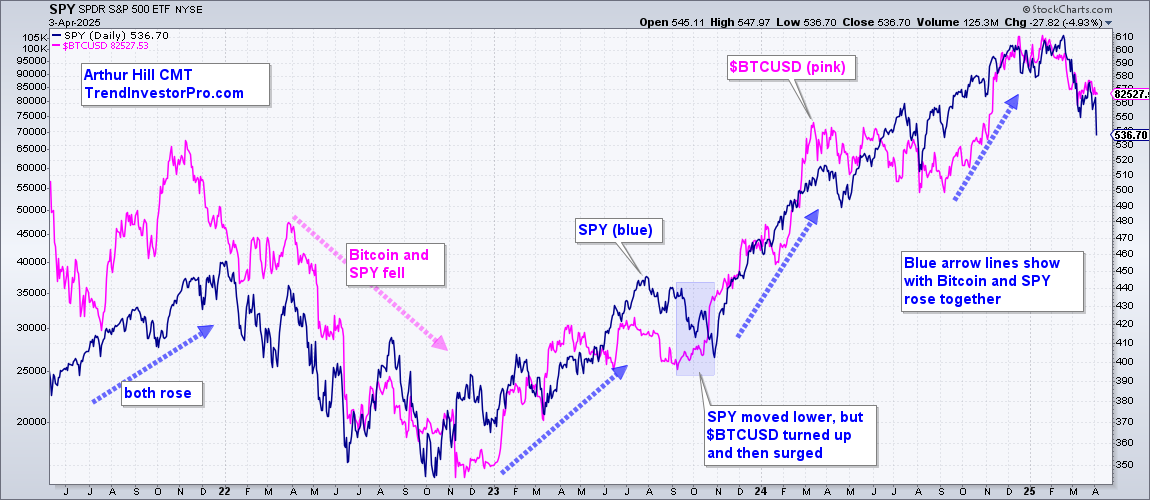
There is, however, one specific period that stands out. The blue shading shows September-October 2023. Stocks swooned as SPY fell from 440 to 400 (-10%) in a short period. Bitcoin bucked the stock market as it edged higher into mid October and then surged into late October. Bitcoin rose 10% even as SPY fell 10%. SPY surged in November-December and Bitcoin followed suit.
Recent Reports and Videos for Premium Members
- Trend Trio150 Signals for Dow 30 Stocks and SPDRs
- Agriculture, Wheat, Corn and Sugar ETFs Break Out
- Breadth Deteriorates, Spreads Widen and Rate Rise
- Downtrend Signals in XLK and XLC – A Breakout in Space
- Click here to take a trial and gain full access.
Short-Term Relative Strength, but No Breakout
Bitcoin shows short-term relative strength, but remains short of a relative breakout. The next chart shows Bitcoin relative to SPY ($BTCUSD/SPY ratio). Bitcoin underperformed from June to September 2024, outperformed from October to December (blue arrow-line) and underperformed in February-March (pink arrow-line)
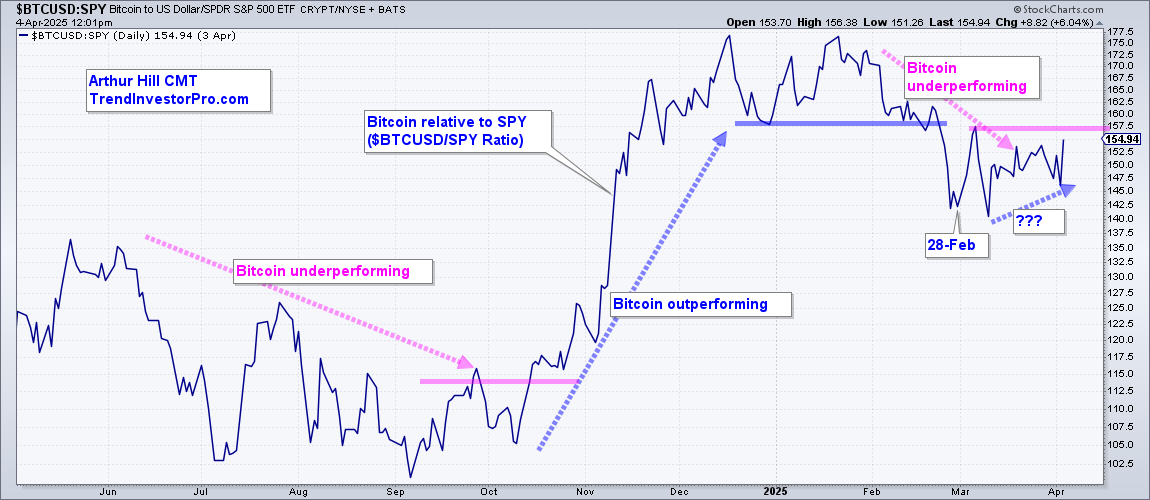
Short-term, Bitcoin is holding up relatively well since March. SPY is down around 10%, but Bitcoin is flat since February 28th. This means Bitcoin is showing relative strength since March, which is reflected in the ratio because it rose the last few weeks. A move above the March high (157.5) would trigger a relative breakout. Relative strength sometimes foreshadows absolute strength so I will be watching this chart closely.
But what about Bitcoin and the Bitcoin ETF (IBIT) charts? I am seeing setups here as they firm in potential reversal zones. This report continues (here) for subscribers as we analyze the patterns in play and the key levels to watch. Click here to take a trial and get immediate access.