Neurocrine Biosciences Breaks out within Consolidation
Square Corrects after 52-week High
The next Chart Trader will be posted on Tuesday morning, May 21th.
Stocks reacted positively to the CPI report and surged as Treasury yields fell, and TLT continued its May bounce. SPY and QQQ hit new highs on Wednesday. Also note that QQQ is leading the way since the mid April lows with a 9.22% advance the last 18 days. SPY is up 6.99% and the Russell 2000 ETF (IWM) is up 8.44%. Large-caps and large-caps techs are still the place to be. The MAG7 ETF (MAGS) also hit a new high and is up 11.77% since mid April.
Short-term Breadth Expands
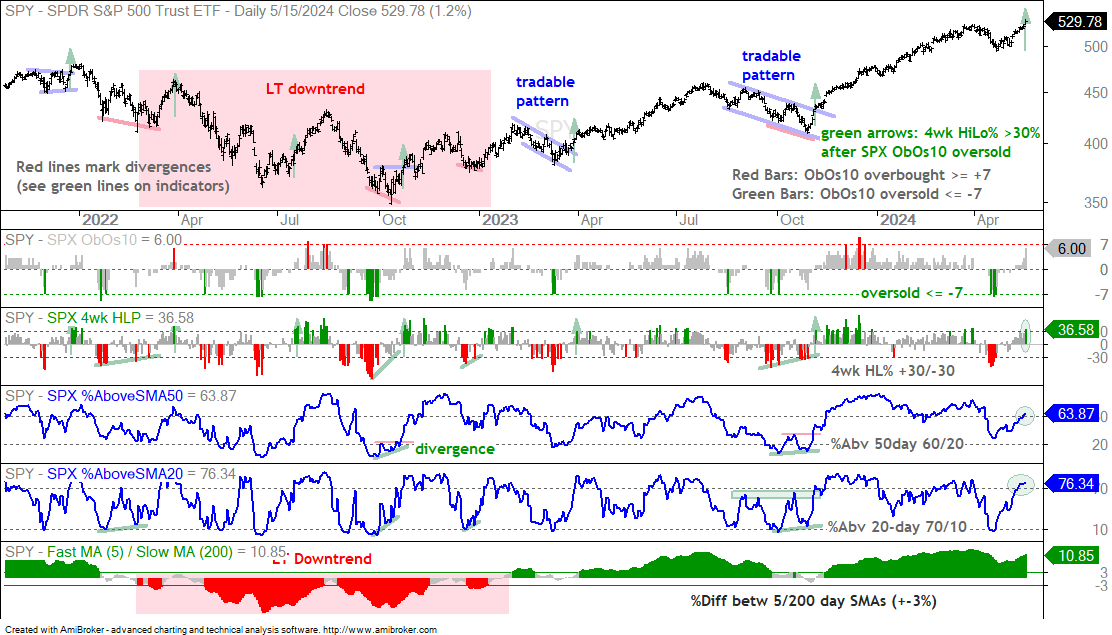
Short-term breadth expanded within the S&P 500. SPX %Above 50-day exceeded 60% on Tuesday and SPX 4wk High-Low Percent exceeded +30% on Wednesday. Note that SPX %Above 20-day SMA was the first with a cross above 70% last Thursday. The green ovals mark these crosses on the chart below. This breadth expansion shows an increase in upside participation and this supports the current advance.
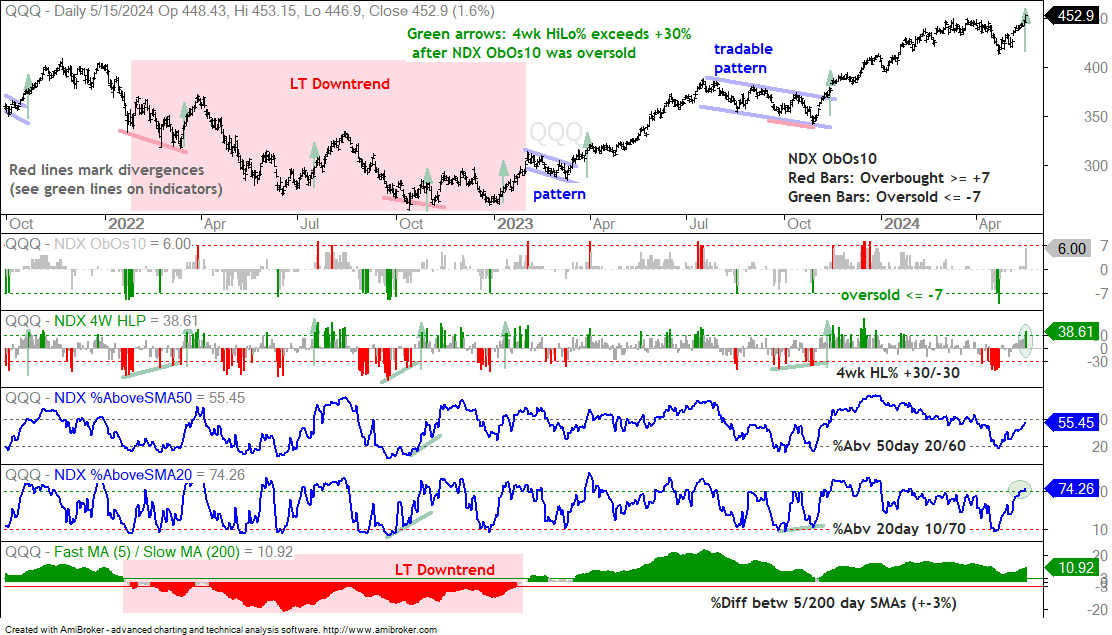
Short-term breadth also expanded within the Nasdaq 100. NDX %Above 20-day SMA exceeded 70% on Friday and NDX 4wk High-Low Percent exceeded +30% on Wednesday. NDX %Above 50-day SMA is still dragging its feet because it has yet to exceed 60%.
The charts above feature a long-term trend indicator in the bottom window and four short-term indicators to identify short-term bullish setups and signals. I am using the percentage difference between the 5 and 200 day SMAs for the long-term trend. A break above +3% is bullish and stays bullish until a break below -3%. The red shading marks the long-term downtrend in 2022. The first indicator window shows SPX/NDX ObOs10, which aggregates overbought and oversold signals in 10 indicators. It is oversold at -7 or lower and overbought when at +7 or higher. I am mostly interested in oversold readings when the long-term trend is up. Once ObOs10 becomes oversold, I then look for short-term signals to suggest an end to the correction. These include 4wk High-Low Percent exceeding +30%, %Above 50-day SMA exceeding 60%, %Above 20-day SMA exceeding 70% and a pattern breakout on the price chart.
New Highs for SPY and QQQ
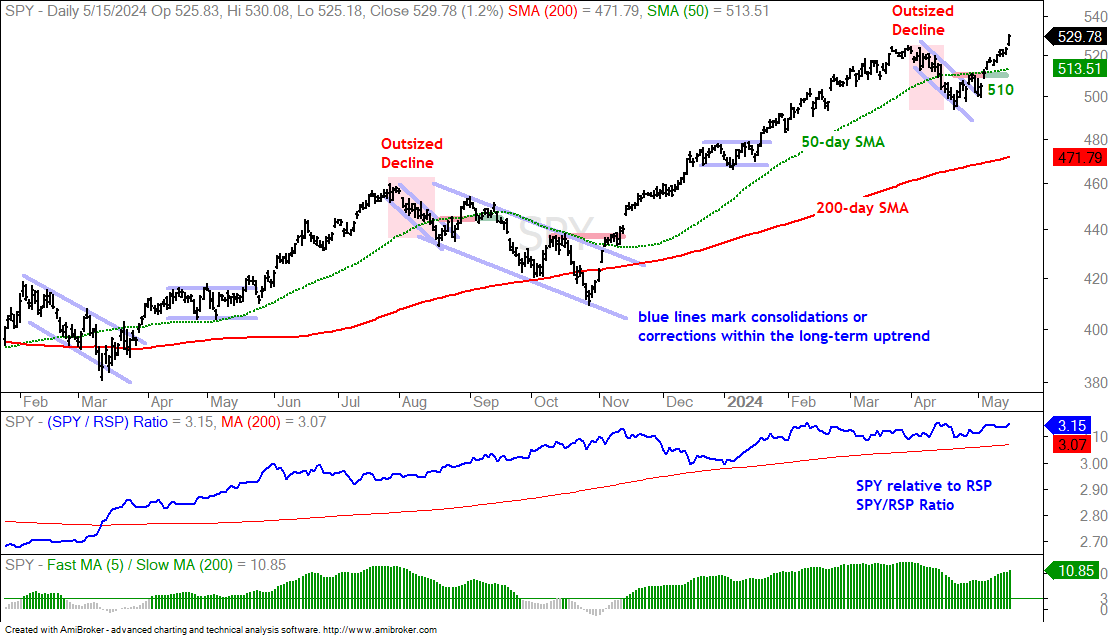
SPY experienced an outsized decline into mid April, but this move did not foreshadow an extended correction and did not follow the August 2023 script. SPY formed a falling flag into late April and broke short-term resistance at 510 on May 3rd. In contrast to August, the ETF never looked back and surged to a new high this week. I added the 50-day SMA to this chart because it is the most widely followed short/medium term moving average. It also seems that pattern breakouts are more robust when accompanied by a break above the 50-day SMA.
Sometimes it is better to focus simply on price action and put breadth on the back burner (hindsight). SPY is a market-cap weighted ETF, which means a handful of big stocks drive performance. Breadth indicators level the playing field by treating all stocks equal. Cross of the 50-day SMA in Microsoft (MSFT) counts the same as a cross for Mohawk Industries (MHK). MSFT accounts for 7.01% of the index and MHK accounts for .01%.
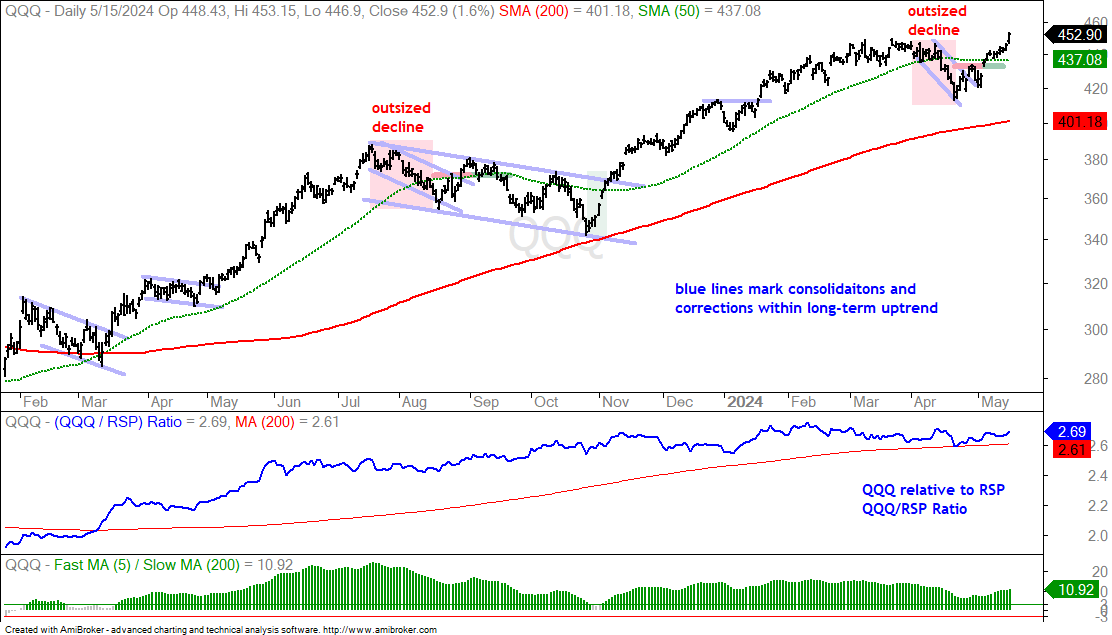
The next chart shows QQQ with an outsized decline that evolved into a falling flag. QQQ broke out at 432 on May 3rd, held this breakout and extended to a new high this week.
TLT Extends on Short-term Breakout
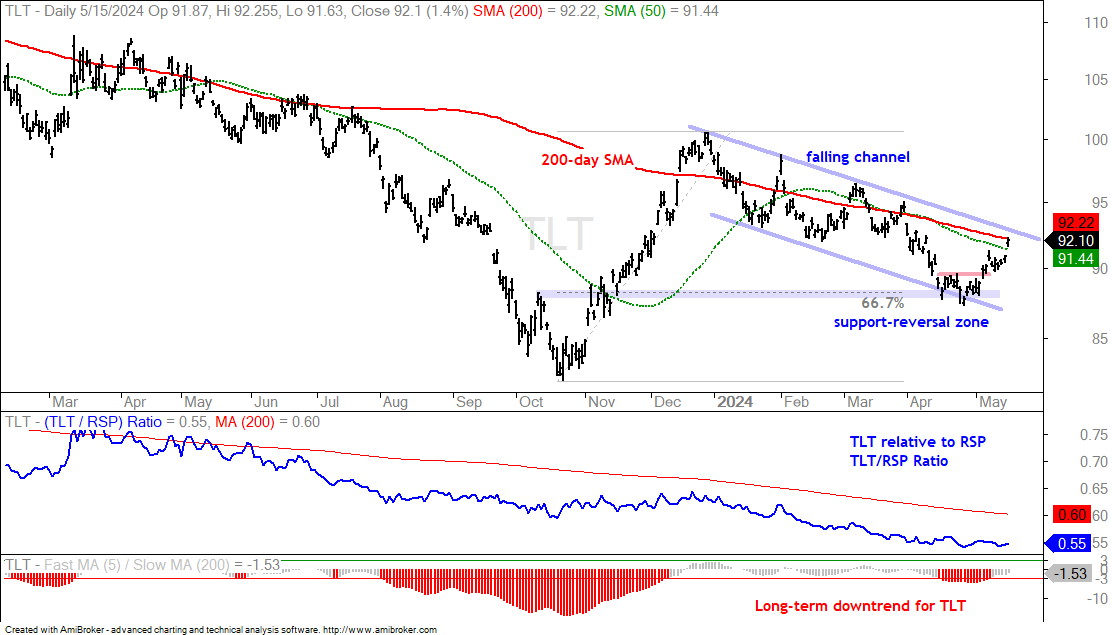
Stocks were helped with a decline in Treasury yields and rise in Treasury bonds. The chart below shows the 20+ Yr Treasury Bond ETF (TLT) hitting a Support-Reversal Zone in late April. See the blue shading marking the 66.7% retracement and broken resistance. This setup was featured on April 30th and May 2nd. TLT broke short-term resistance on May 3rd, which coincided with the breakouts in SPY and QQQ. TLT extended higher and is poised to challenge resistance in the 92-93 area. Three items mark this resistance zone: the 50-day SMA, the 200-day SMA and the upper line of the falling channel. A channel breakout would signal a continuation of the October-December advance and target a move to the low 100s.
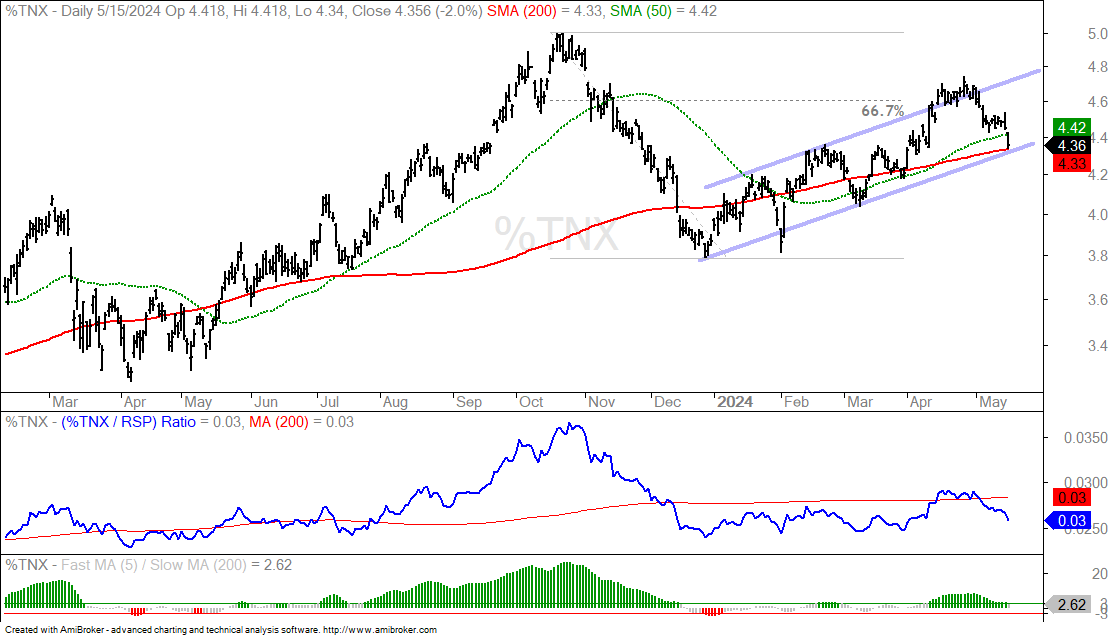
The next chart shows the 10-yr Treasury Yield with a sharp decline into December and a counter-trend move that retraced just over 66.7% with a rising channel. A channel break and break below the 200-day SMA would argue for a move toward the 3.8% area. Further downside in the 10-yr Treasury Yield could keep the bid in high-beta stocks.
Oil Breaks Channel Line and 200-day SMA
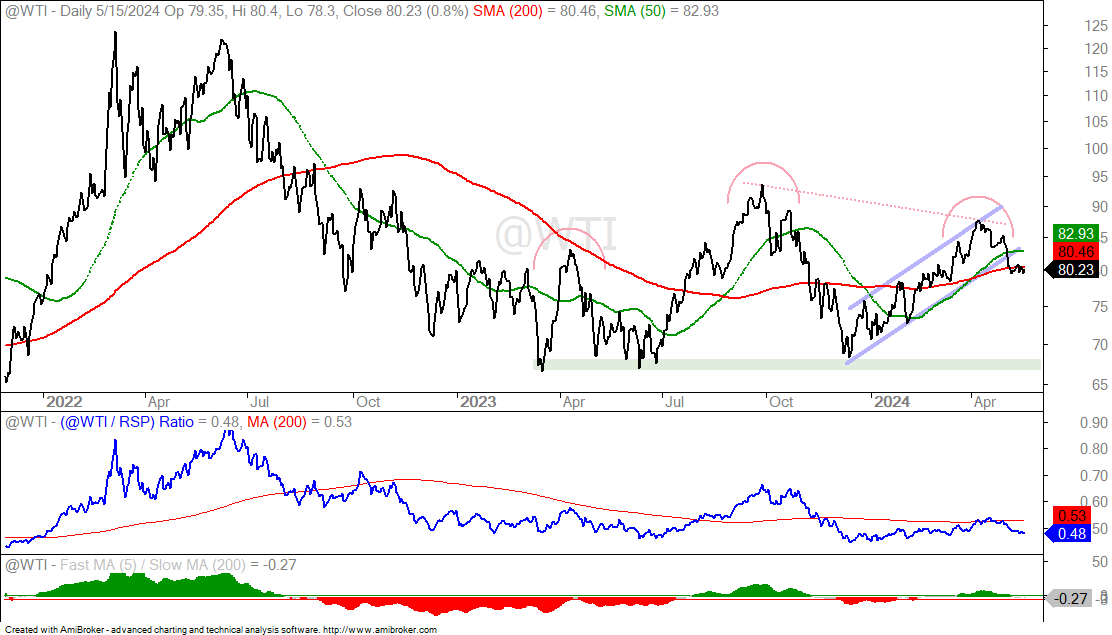
The next chart shows West Texas Intermediate ($WTIC) with a bearish head-and-shoulders pattern (red arcs). This is of the continuation variety because the prior move was down (122 to 67 from June 2022 to June 2023). More recently, oil formed a rising channel from December to April and peaked well below the October high (right shoulder). Oil broke the channel line and 200-day SMA in May to reverse this medium-term uptrend. The green shading marks the next target in the 67 area (neckline support).
Chart Analysis, Setups and Trading Ideas
The following charts show price bars with the 200-day SMA (red line), the price-relative (ITB/RSP ratio) with the 200-day SMA and the percentage difference between the 5 and 200 day SMAs. On the price chart, I am looking for tradable pullbacks within a bigger uptrend or bullish consolidation patterns. With the price-relative, I am looking for relative strength. The price-relative (ITB/RSP ratio) rises when the ETF or stock outperforms. And finally, the percentage difference between the 5 and 200 day SMA is bullish (long-term uptrend) with a move above 3% and stays bullish until a move below -3%. This basically measures the tide or long-term bias.
IBIT Breaks Out after Normal Retracement
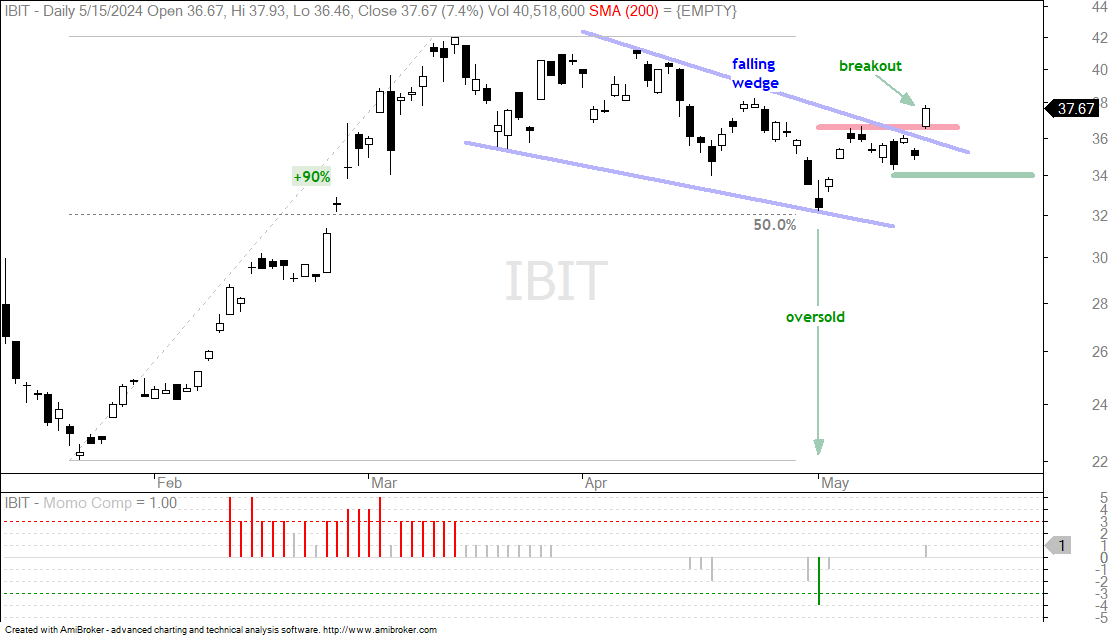
The first chart shows the Bitcoin ETF (IBIT) from iShares. On the price chart, IBIT advanced 90% into March and then retraced 50% of this move with a falling wedge back to the 32 area. The pattern and the retracement are normal for corrections after big advances. The ETF broke resistance with a surge on Wednesday. This breakout reverses the medium-term downtrend and signals a continuation of the bigger uptrend. I would mark my first re-evaluation support level at 34. A close below this level would negate the breakout. Note IBIT has above average volatility and risk. The re-evaluation level is some 10% below Wednesday’s close.
Before leaving this chart, notice how the IBIT accelerated lower in late April and the Momentum Composite became oversold (-4). This acceleration lower marked the beginning of the end for the correction. Think of its as a selling climax or washout. IBIT quickly rebounded with a move above 36 in early May, stalled for a week and broke out on Wednesday.
Five Key Tech ETFs Break Resistance Levels
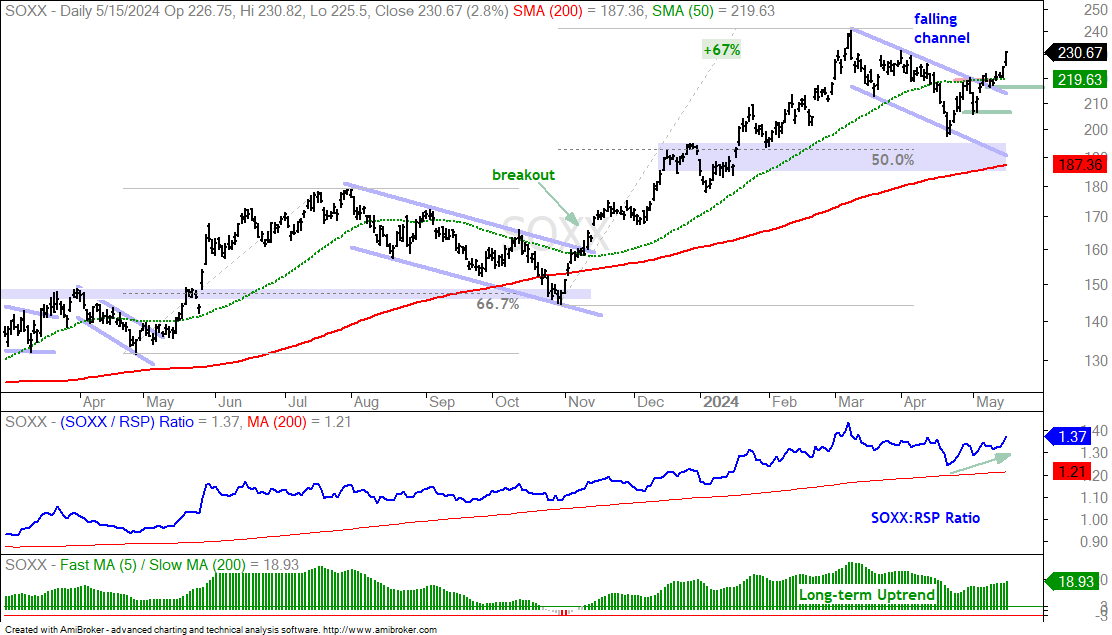
We will start off with the Semiconductor ETF (SOXX), which broke falling channel resistance at 220 on May 6th. Note that SOXX and the other tech ETFs were featured in the report/video on May 2nd as these corrective pattern took shape. SOXX broke out at 220, stalled for a week and took off over the last four days. This is the post-breakout follow through. The breakout zone around 220 becomes first support to watch because a strong breakout with follow through should hold. A close below 217 would call for a re-evaluation.
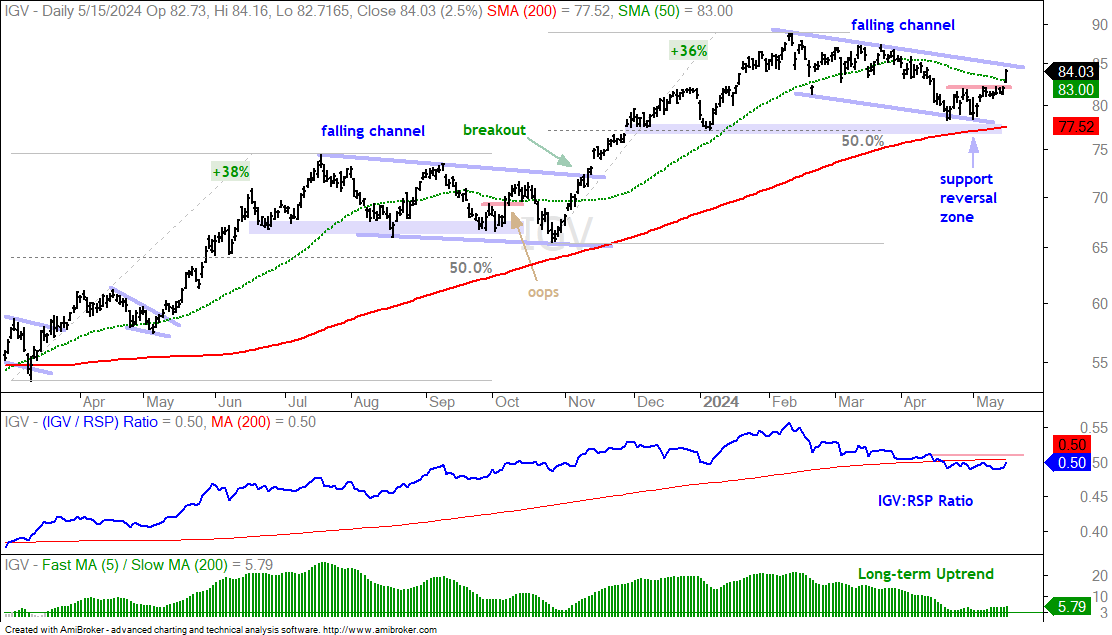
The next chart shows the Software ETF (IGV) breaking short-term resistance and crossing back above its 50-day SMA. This is a breakout within a bigger corrective pattern (falling channel). Such breakouts increase the odds of a bigger channel breakout, which would end the correction and signal a continuation of the bigger uptrend.
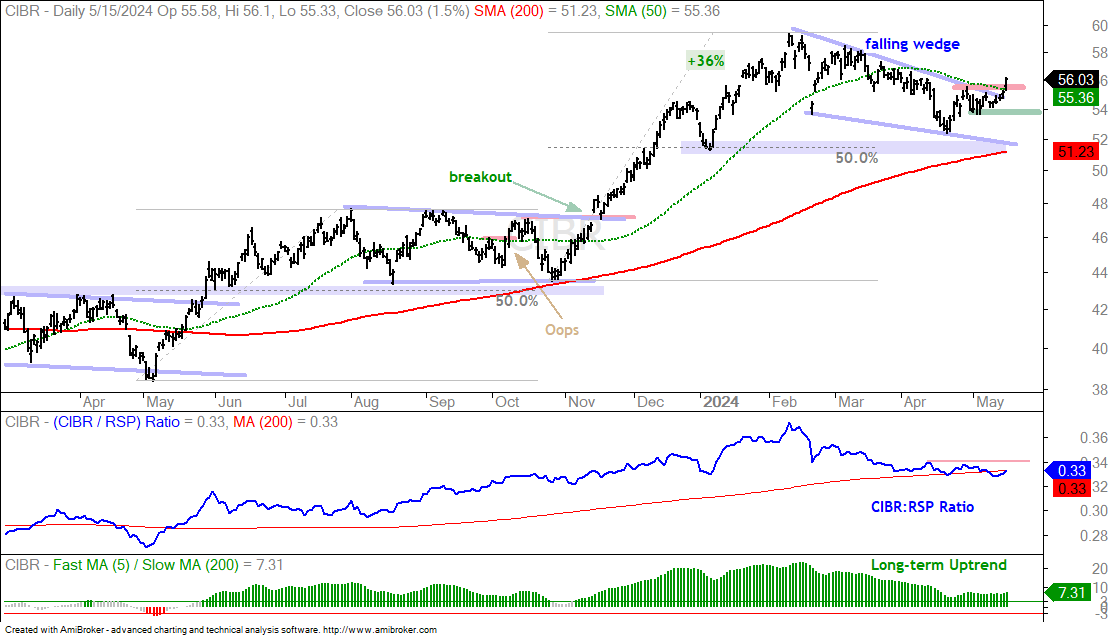
The next chart shows the Cybersecurity ETF (CIBR) breaking falling wedge resistance and crossing back above the 50-day SMA. This breakout signals an end to the correction and a resumption of the bigger uptrend. The early May lows mark first support at 53.5 and a close below this level would call for a re-evaluation.
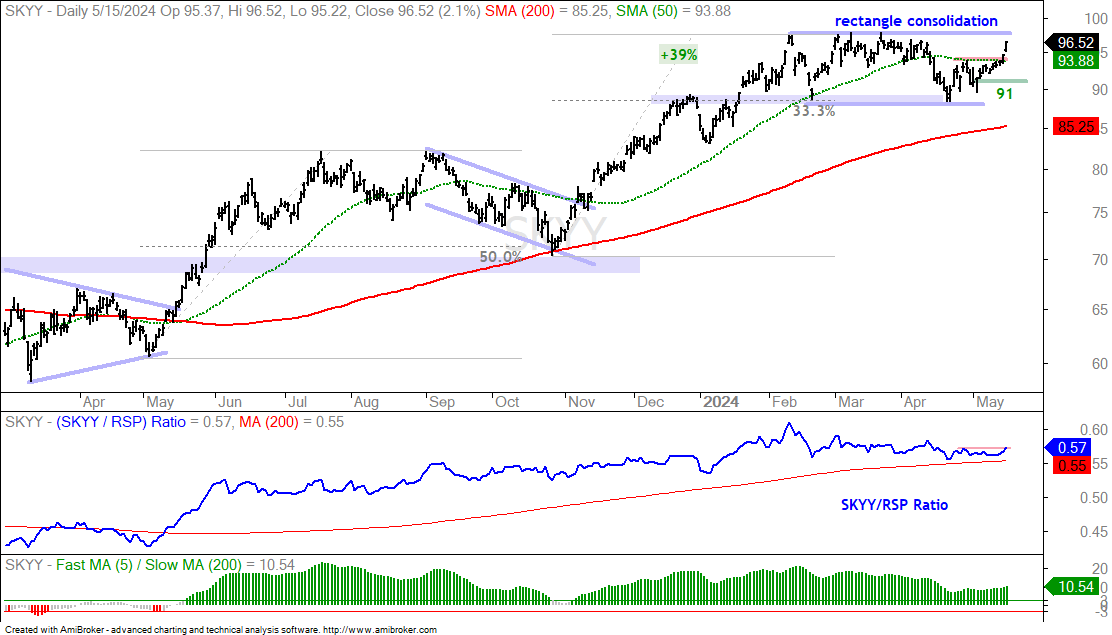
The next chart shows the Cloud Computing ETF (SKYY) breaking short-term resistance on Tuesday and extending higher on Wednesday. SKYY also broke the 50-day SMA. These short-term breakouts increase the odds of a bigger breakout at 98, which would forge a fresh 52-week high. A close below 91 would call for a re-evaluation.
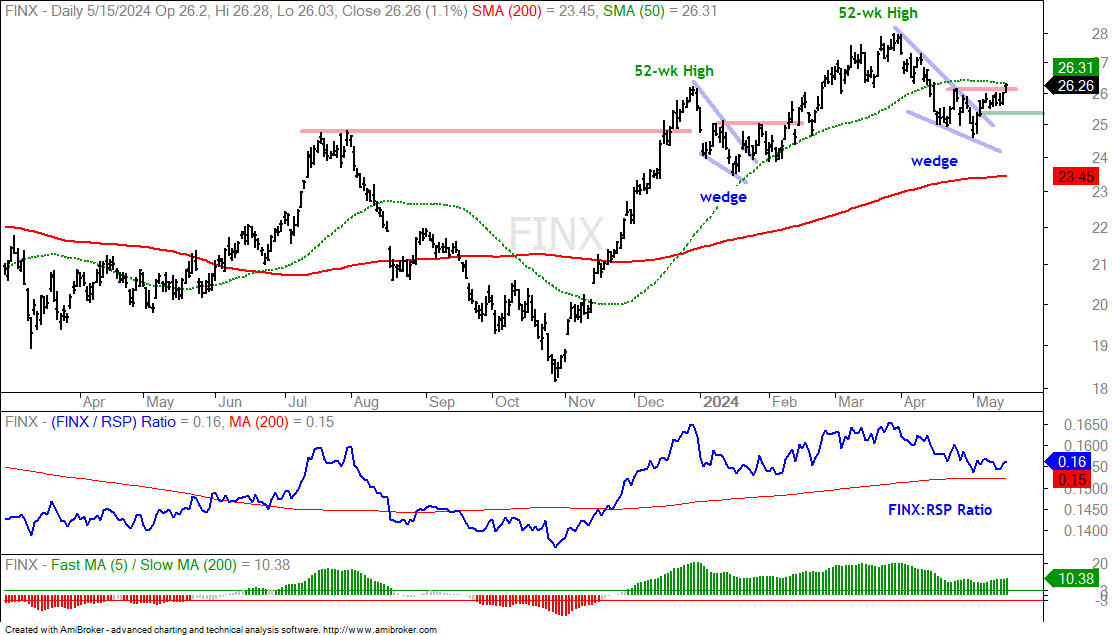
The next chart shows the FinTech ETF (FINX) hitting a 52-week high in early April and correcting with a falling wedge into early May. The ETF broke out of this wedge with a surge on Wednesday and is trading just below the 50-day SMA. This wedge breakout signals an end to the correction and a resumption of the uptrend. I would mark re-evaluation support at 25.30 (green line).
DraftKings Breaks Falling Flag Resistance
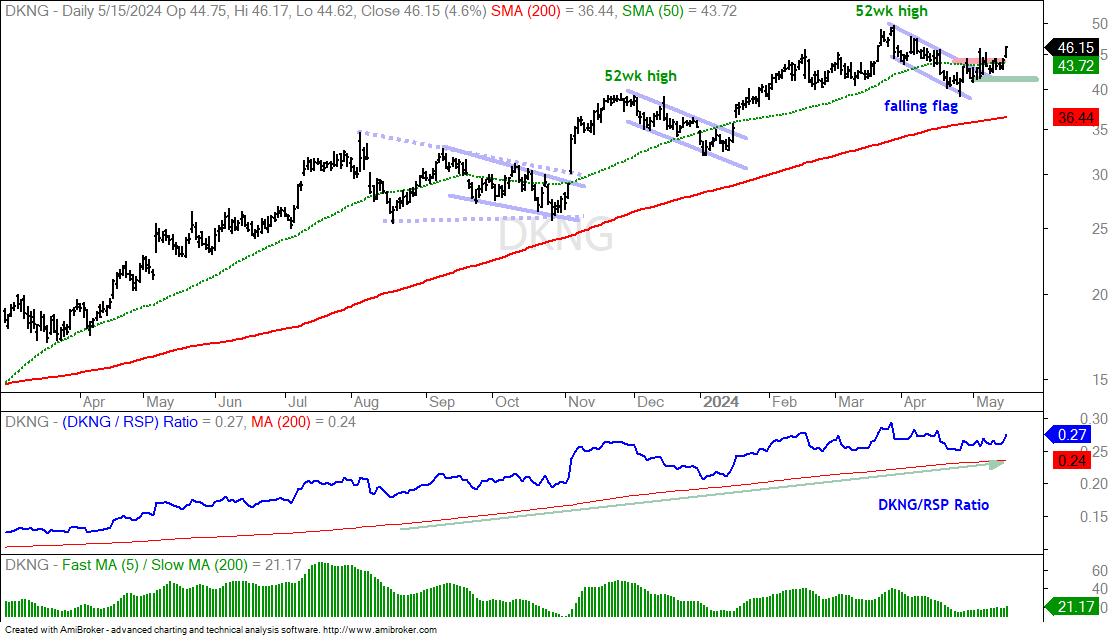
The next chart shows DraftKings (DKNG) with a steady uptrend, a falling flag pullback in April and a breakout in early May. The low from late April and early May mark re-evaluation support at 41.
HubSpot Corrects to Support Zone
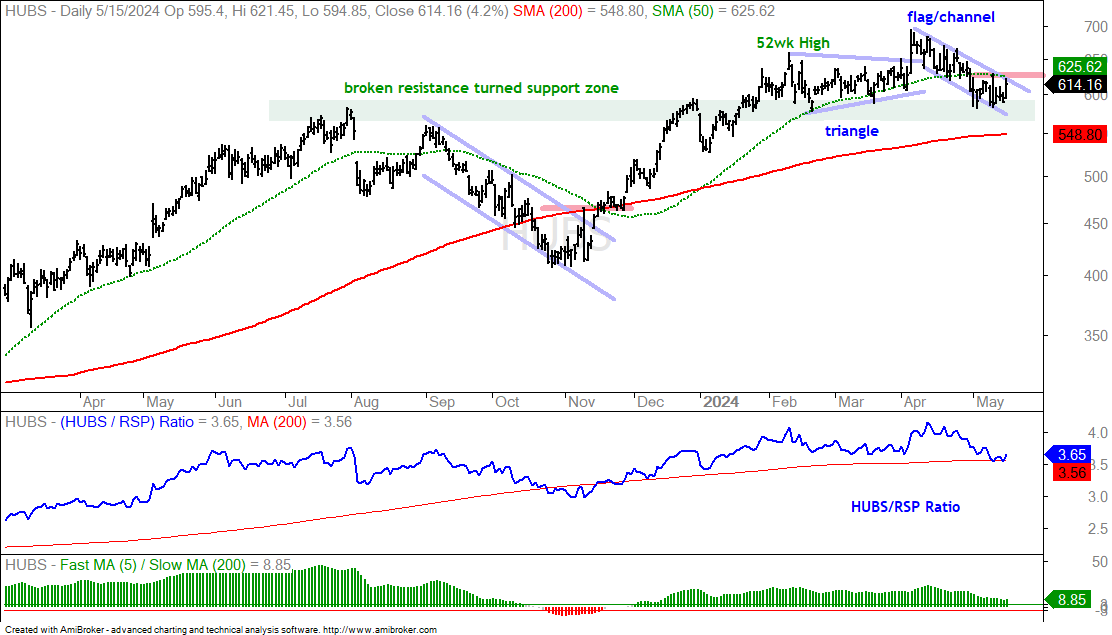
The next chart shows HubSpot (HUBS) with a triangle breakout and new high in mid April. This breakout did not hold as the stock fell back to the 600 area. Even so, this is a big support zone marked by prior resistance and the February-March lows (green shading). A falling flag/channel formed with the current pullback and I still view this as a correction within a bigger uptrend. A breakout at 628 would be bullish.
MedPace Consolidates after Hitting New High
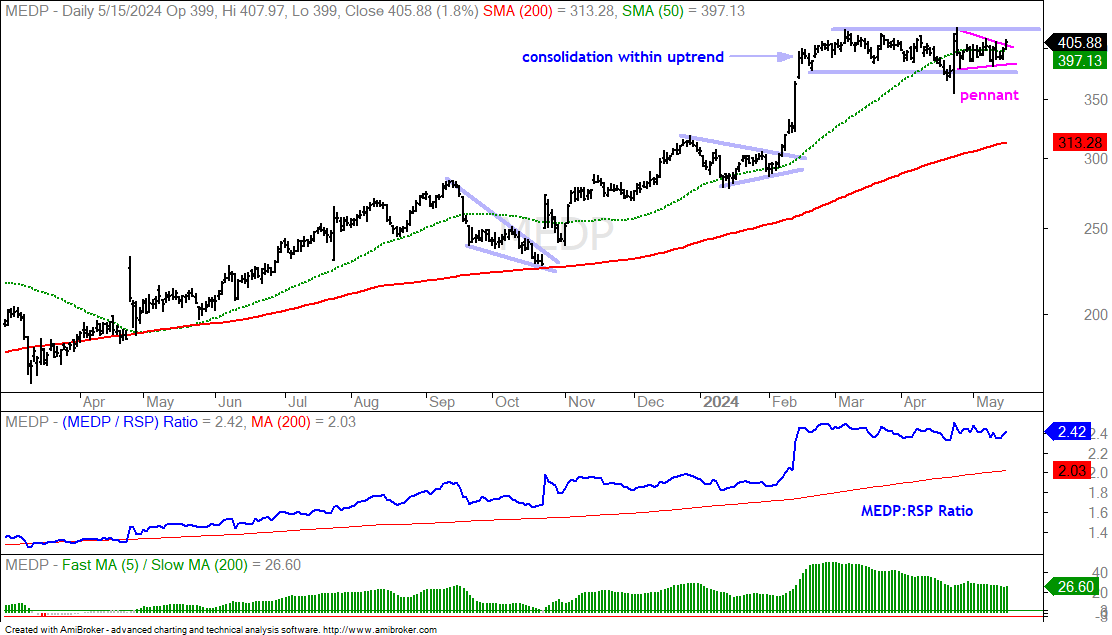
The next chart shows Medpace (MEDP) with a surge to new highs in February and a long consolidation into May. A consolidation within a bigger uptrend is typically a bullish continuation pattern. As such, a breakout would signal a continuation of the larger uptrend. Within the pattern, the stock turned volatile on April 23rd with a spike to 355 and then formed a pennant. MEDP is breaking out of this pennant and this increases the odds of a bigger consolidation breakout.
Neurocrine Biosciences Breaks out within Consolidation
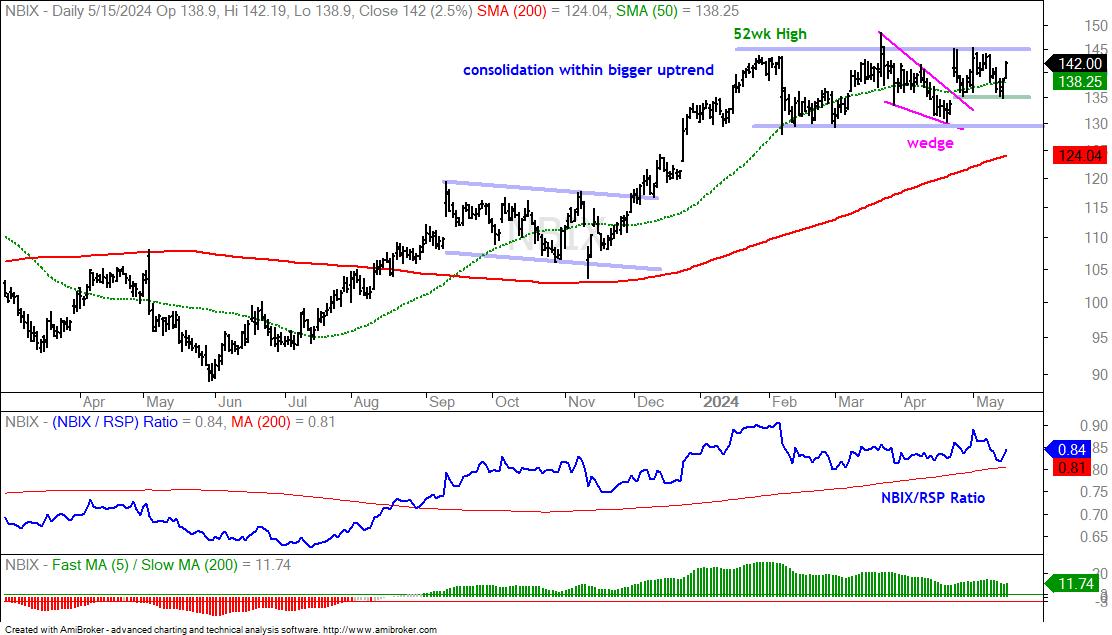
The next chart shows Neurocrine Biosciences (NBIX) sharp move higher into late January and a 52-week high. NBIX then moved into a trading range, which is a consolidation within a bigger uptrend. Within this range, the stock tagged a new high in mid March, but then fell back with the rest of the market in April. A falling wedge took shape and the stock broke out with a gap surge in late April. This is a breakout within the bigger consolidation and this increases the odds for a bigger breakout at 145. A close below 135 would negate this setup.
Square Corrects after 52-week High
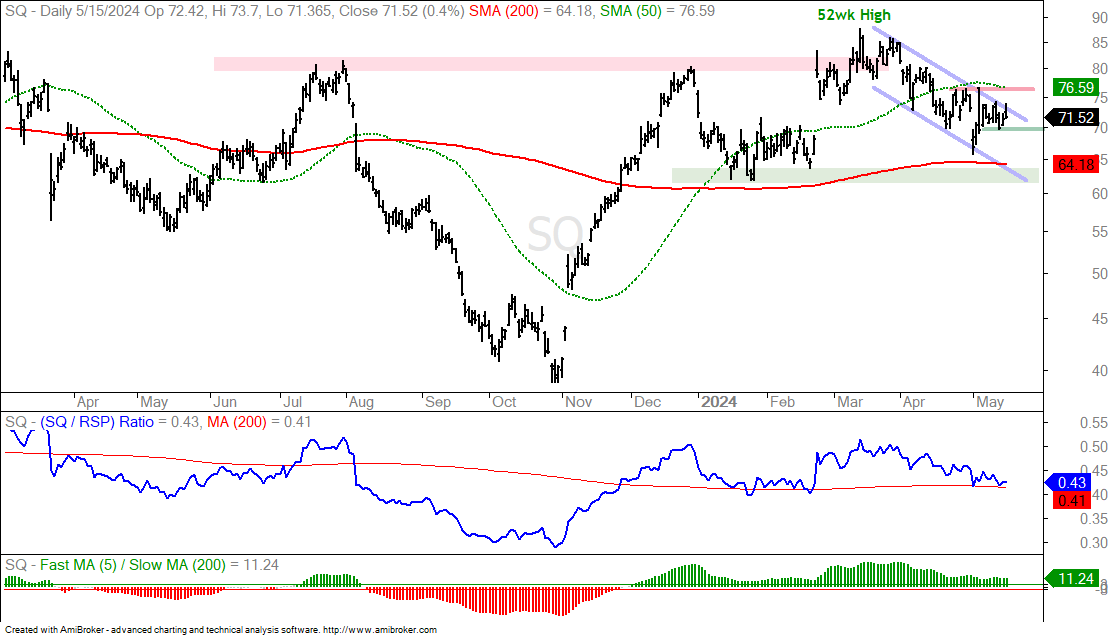
The next chart shows Square (SQ) gapping up in late February and hitting 52-week highs in mid March. This surge and breakout did not last as the stock fell back in April with a falling channel. Despite failing to holding the breakout-surge, the long-term trend is still up and this is still viewed as a correction within a bigger uptrend. SQ established resistance at 76.5 in late April and early May. A breakout here would signal a short-term trend reversal and also break the 50-day SMA. I would view this as bullish and project a move to new highs. Upon a breakout, I would mark re-evaluation support at 69.50.