As many of you already noticed, I made some modifications to the main member pages and the offerings. The offerings are split into two: System Trader and Chart Trader. System Trader covers the quantified strategies and signal tables (pure systematic). Chart Trader covers the reports with chart setups, trading ideas and analysis (discretionary).
It takes considerable time to develop new trading strategies. In fact, the time required for strategy development is indefinable. I cannot promise a new strategy every month and do not know when a new strategy will pass rigorous testing. I have a few in the pipeline, but need more development time.
In the meantime, I separated the systematic offering from the discretionary offering. Chart Trader reports and videos will be posted on Tuesdays and Thursdays before 8AM ET. We will cover the major index ETFs for broad market analysis and bring trading ideas for stocks and ETFs.
There are quick access links at the top of the main member pages. “Strategies & Updates” covers the strategy reports and updates. “Signal Pages” contains the signal table pages for the active strategies. “Market Timing” is the market regime page with the Composite Breadth Model, yield spreads and Fed balance sheet. “Chart Trader” contains the reports with chart analysis and trading ideas.
The next Chart Trader report/video will be posted on Tuesday, September 14th.
A Split Market
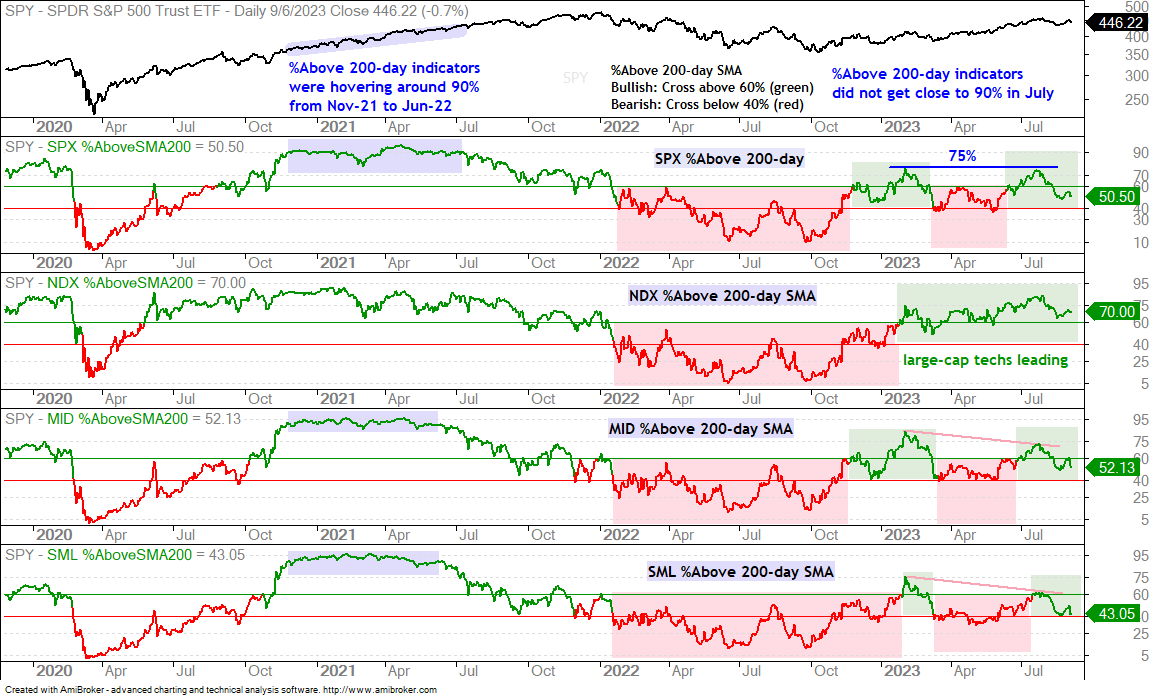
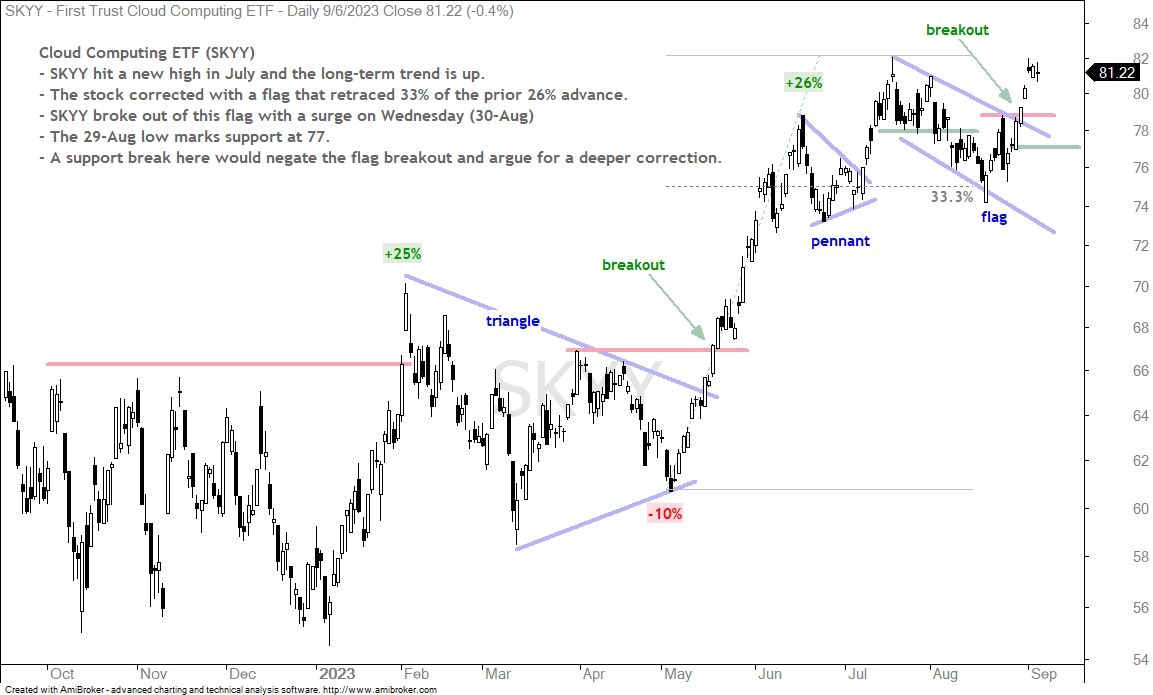
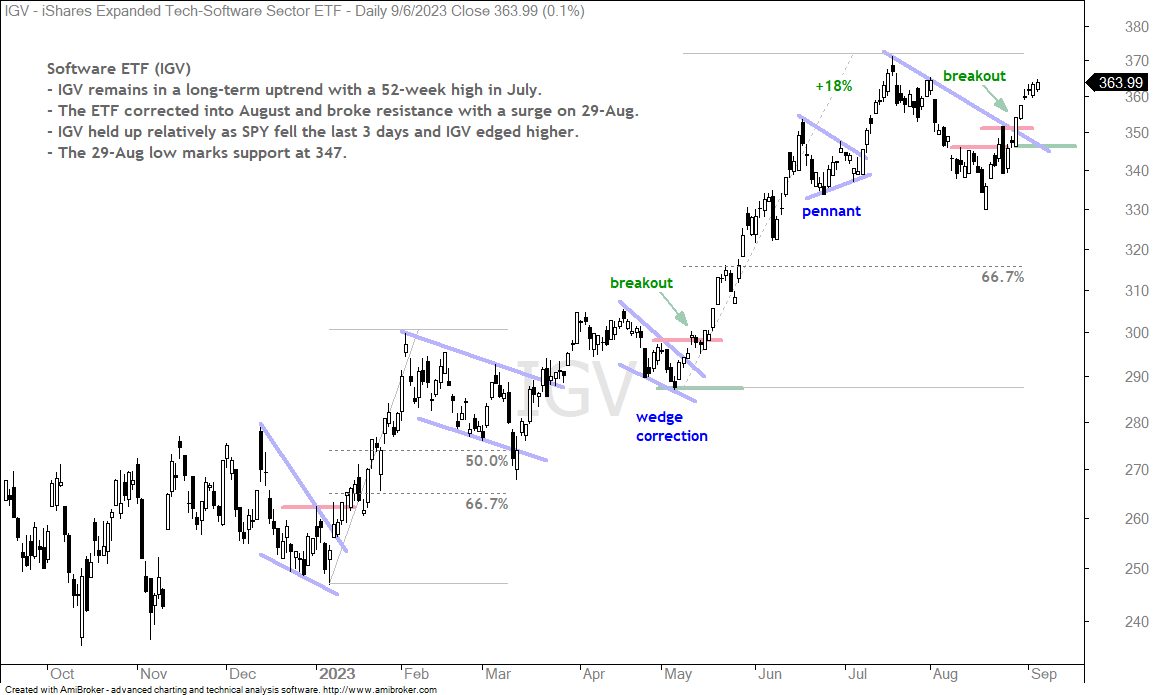
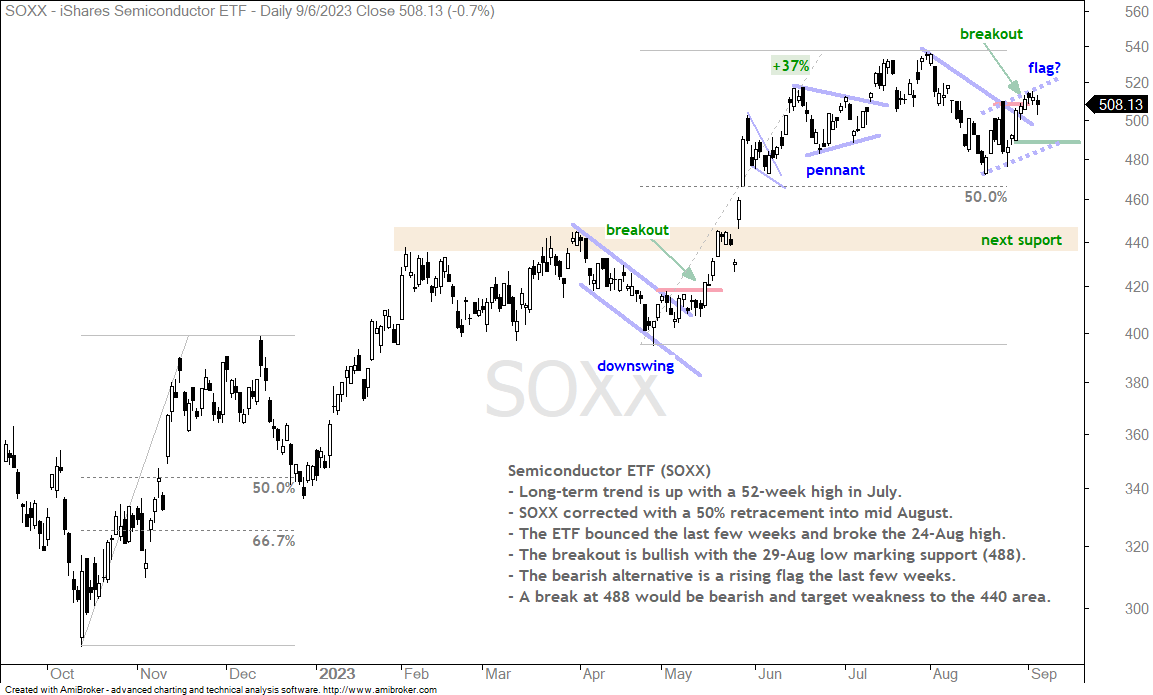
The market looks fragile and is definitely split. Large-cap techs are leading, small-caps are lagging and mid-caps are caught in between. The long-term trends are up for SPY and QQQ as both hit new highs in July. The S&P MidCap 400 SPDR (MDY) and Russell 2000 ETF (IWM), in contrast, did not break their early February highs. They are largely range bound. This is a selective market and we can see the split with the percentage of stocks above the 200-day SMA indicators (SPX 50.50%, NDX 70%, MID 52% and SML 43%). S&P 500 stocks are exactly split with half in long-term uptrends and half in long-term downtrends. This makes it a stock pickers market.
Rough Sledding with Two Sectors Holding Up
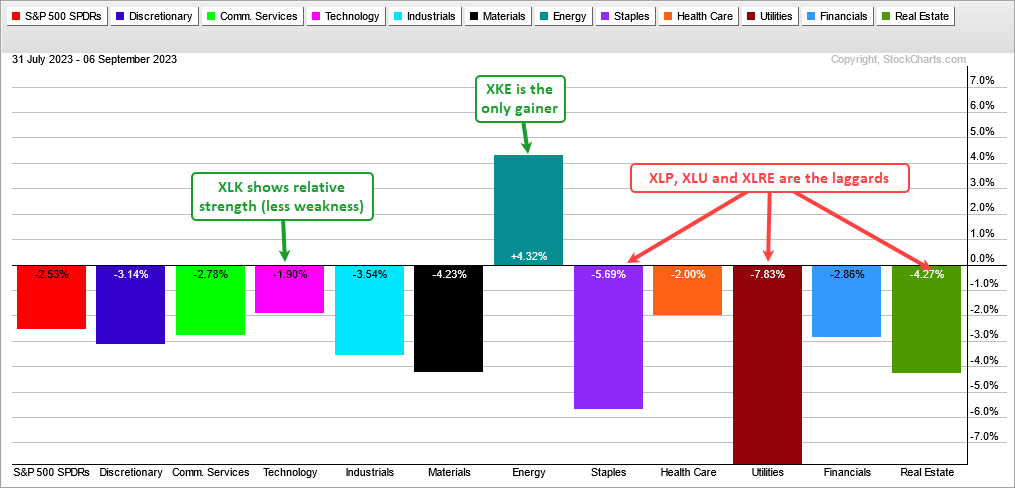
Selling pressure in the stock market was pretty much across the board since August. Over the last 26 trading days (since August 1st), ten of the eleven sectors are down. The Energy SPDR (+4.32%) is the only sector showing a gain. The Technology SPDR (-1.9%) is holding up the best with the smallest loss. Staples (-5.69%), Utilities (-7.83%) and REITs (-4.27%) are down the most. I suspect that weakness in these defensive sectors stems from weakness in US Treasuries (TLT) and the rising 10-yr Treasury Yield (4.29%).
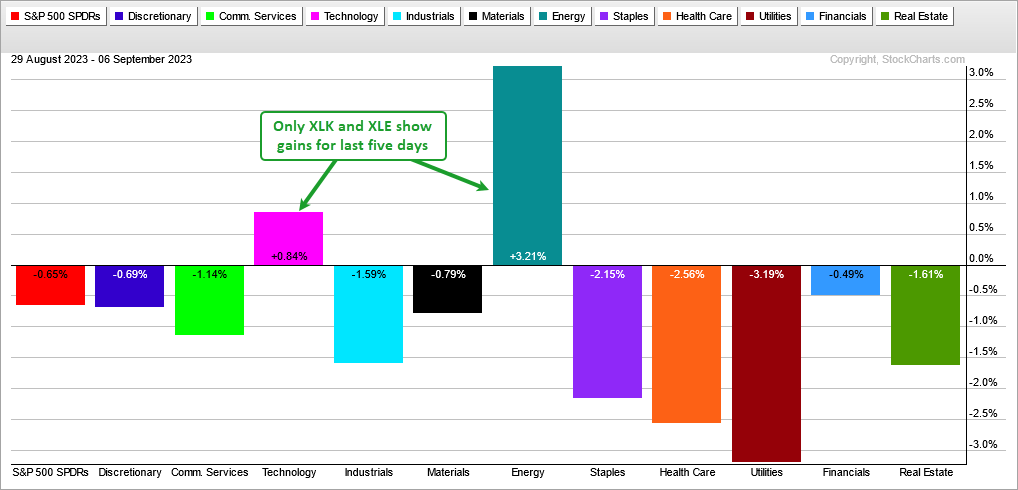
Note that nine of the eleven sectors are down over the last five trading days. Only XLE and XLK shows gains. Basically, Technology is holding up the market as the sector accounts for 28.45% of the S&P 500. The Healthcare SPDR (XLV), which is the second biggest sector (13.09%), broke the August lows and turned laggard here in September.
SPY Tests Breakout Zone
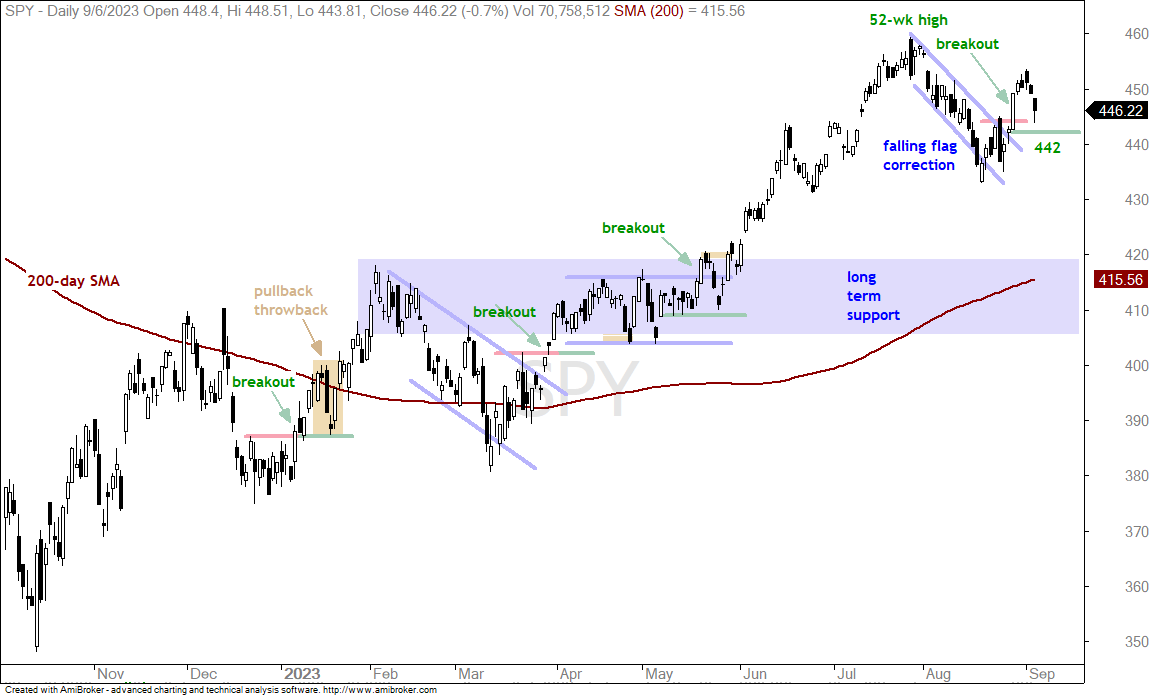
SPY remains in a long-term and short-term uptrend. The breakout on August 29th sets the tone for the short-term uptrend and this breakout is holding. The ETF moved above 450 after the breakout and then fell back the last few days. SPY was short-term overbought after a 3.2% surge in four days so a pullback is normal at this stage. A strong breakout should hold and the breakout zone turns first support in the 445 area. My line in the sand stands at 442. A close below this level would negate the August 29th surge and the breakout. This would be negative.
QQQ Holds Up the Best
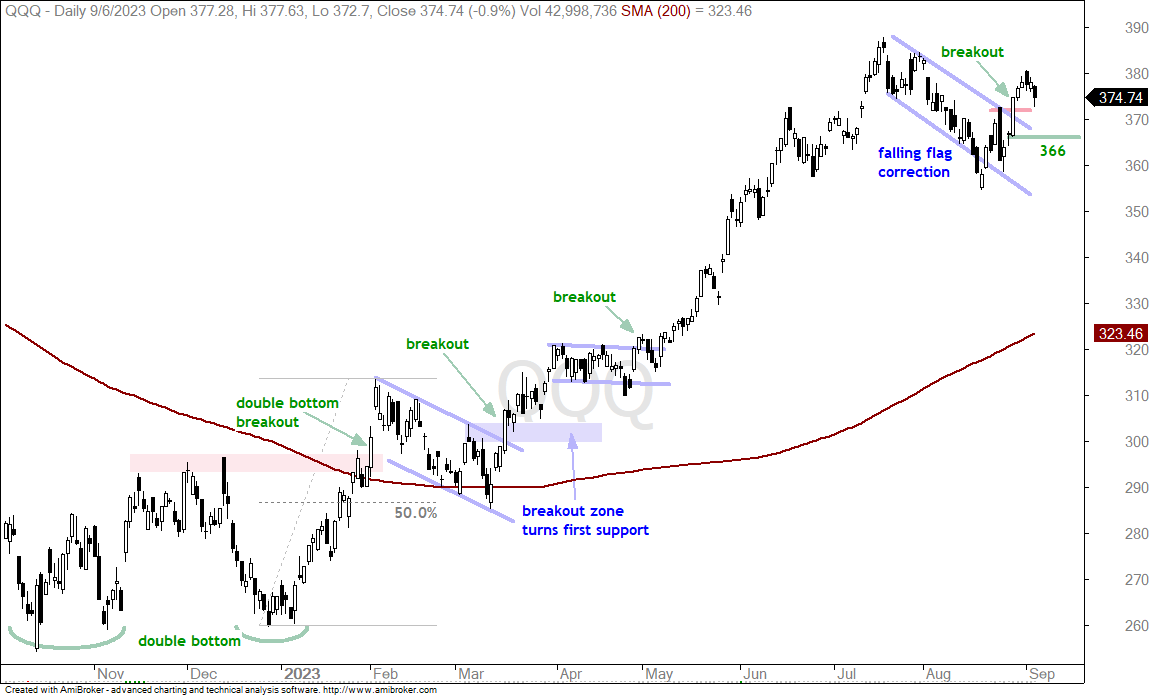
QQQ also broke out with a big surge on August 29th and this breakout is holding. The ETF fell back the last few days, but is holding up better than SPY and much better than the Russell 2000 ETF (IWM). The breakout zone around 370 turns first support. Again, the August 29th surge marks my line in the sand. A close below 366 would erase this breakout surge and be negative.
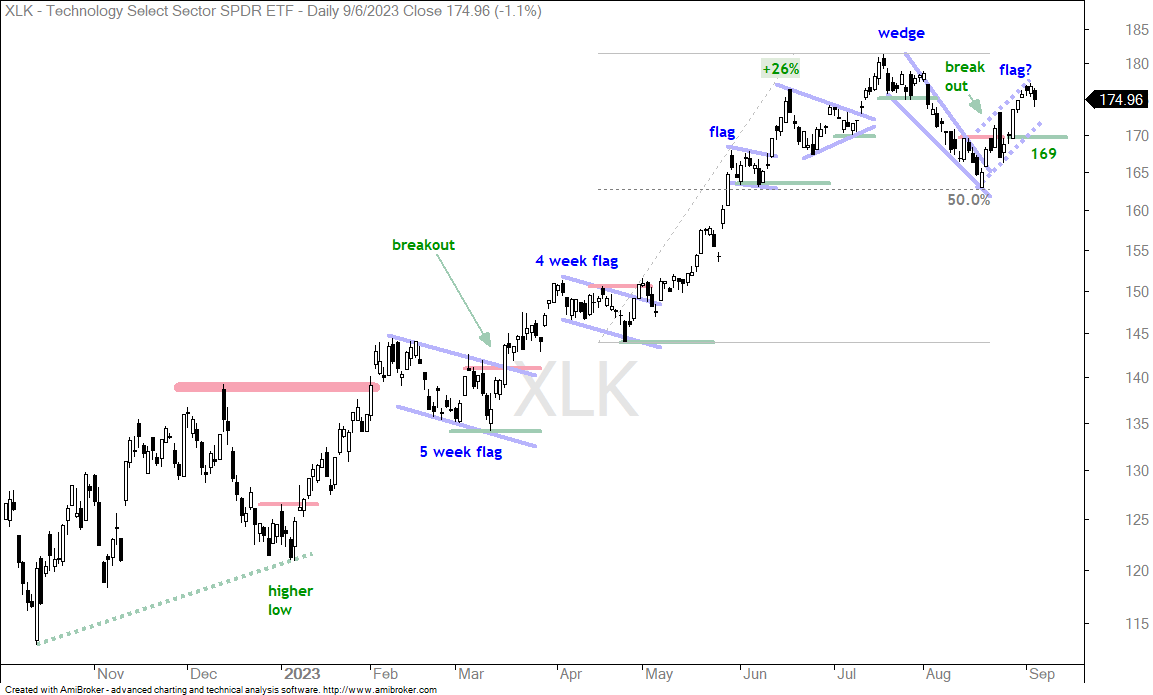
The next chart shows the Technology SPDR (XLK) with a breakout and a short-term uptrend the last few weeks. XLK also surged on August 29th and I set my line in the sand at 169. A close below this level would erase the gain and negate the breakout. Once we take a trade or make a stance, it is important to decide what would prove it wrong. Should XLK break 169, I would then view this advance as a bear flag (rising) and the break would signal a continuation of the August decline. This would target a move to the 155-160 area.
Russell 2000 ETF Leads Lower (IWM)
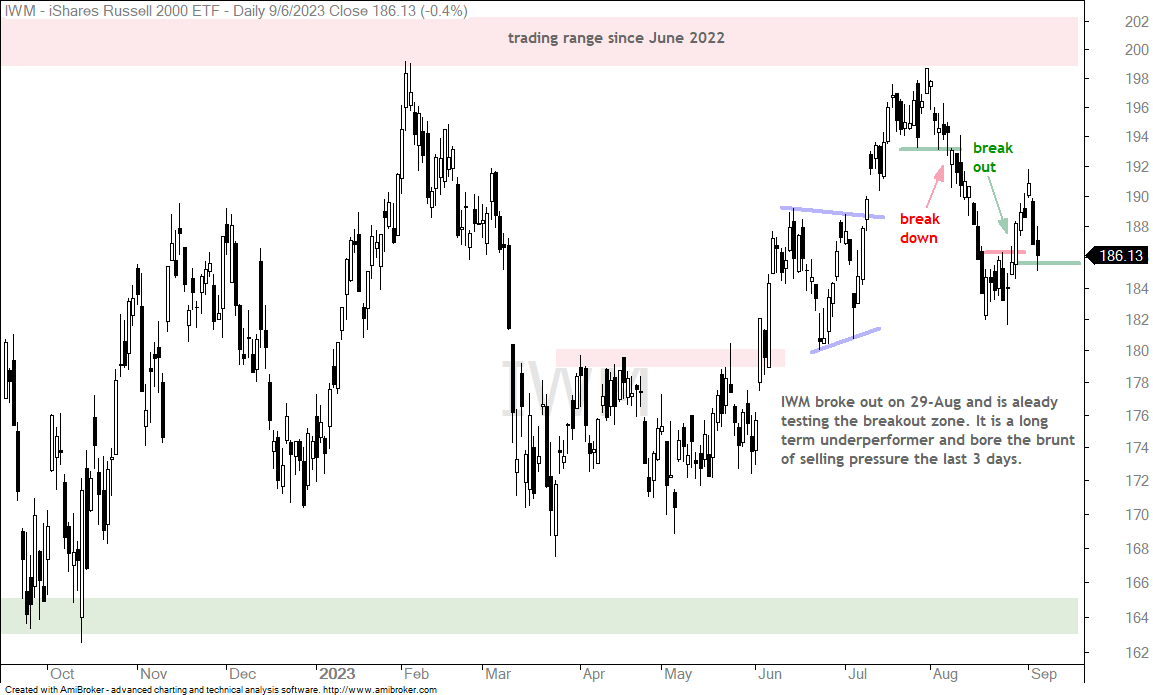
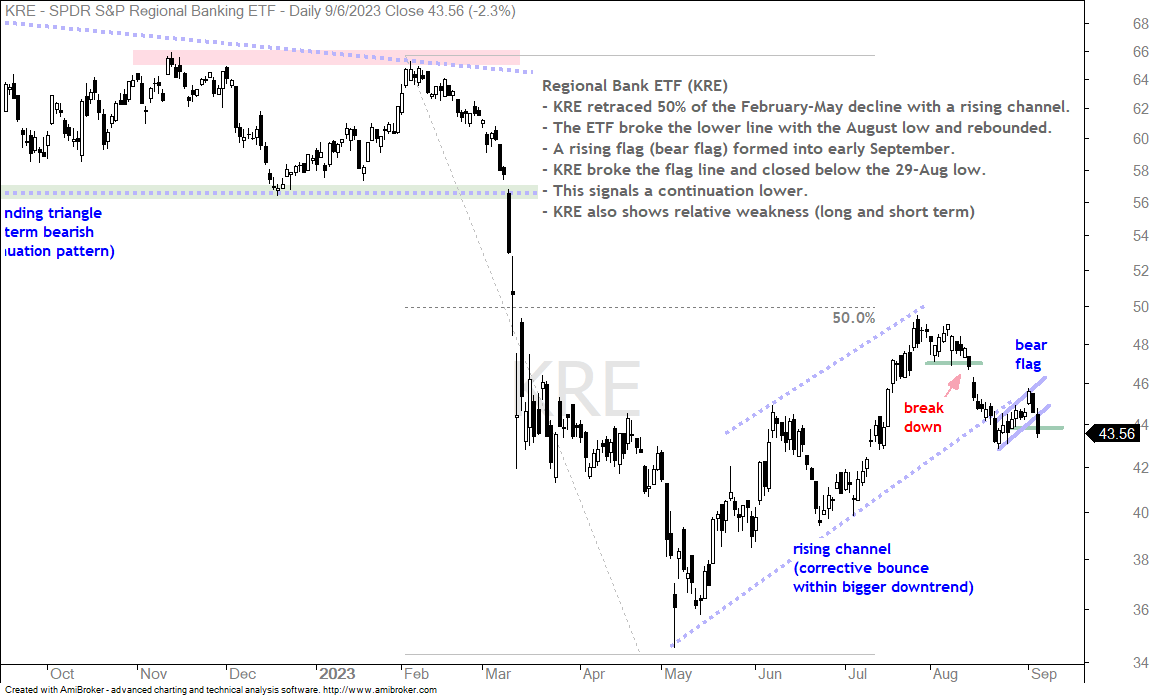
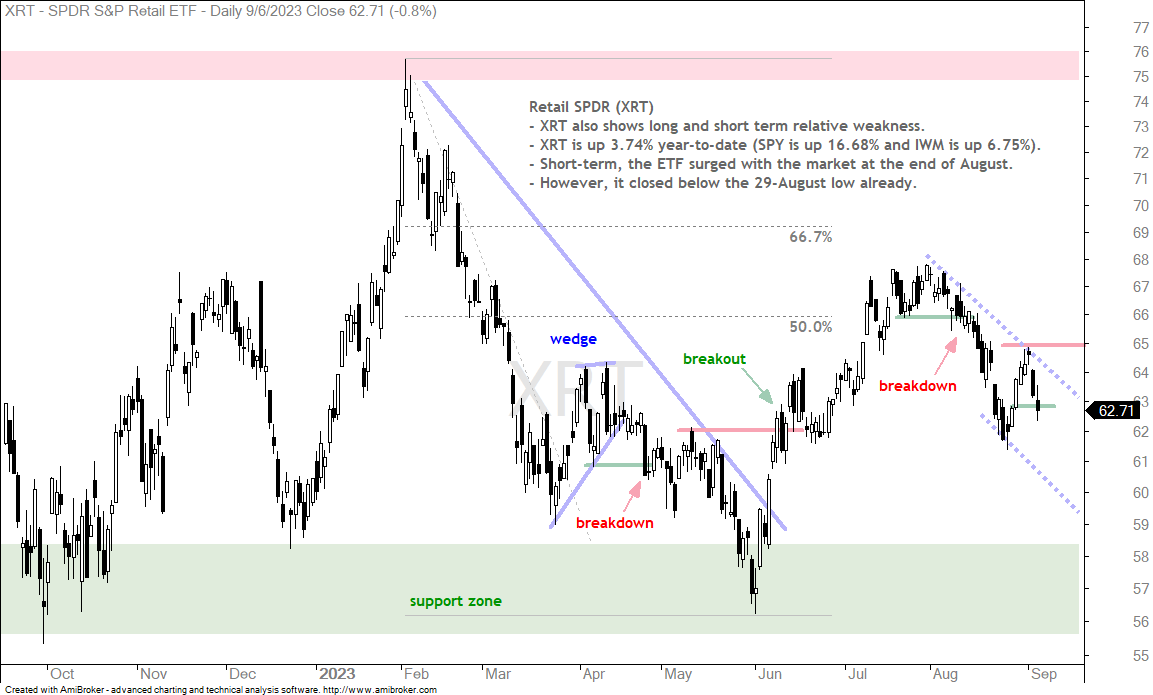
Russell 2000 ETF (IWM) broke out on 29-Aug and is already testing the breakout zone. It is a long term underperformer and bore the brunt of selling pressure the last 3 days. IWM already erased some of the 29-Aug surge and a close below 185 would negate the short-term breakout. Weakness in Retail and Regional Banks is weighing on small-caps. Large-cap techs are immune so far.