SPY and QQQ fell back after their breakouts and bounced off broken resistance levels. These short-term bounces affirm supports and keep the short-term uptrends alive. It is important to monitor these two because the rest of the market looks rather shaky. Breadth is not keeping pace, September seasonality is here and mid-caps are lagging.
The next Chart Trader will be posted on Thursday, September 14th.
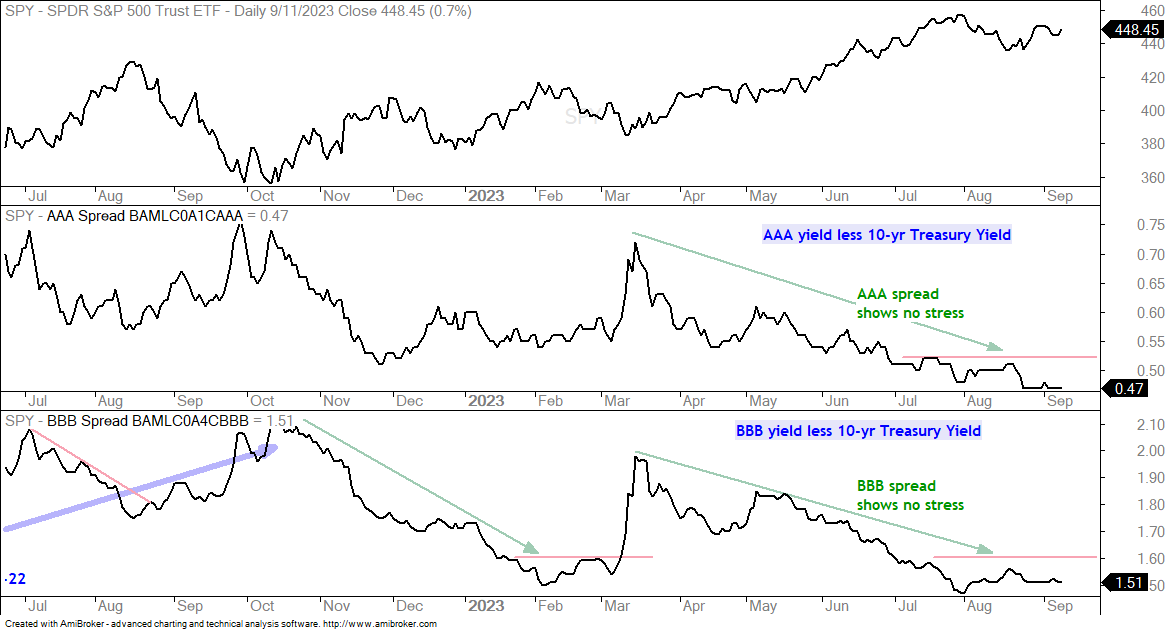
Watching the BBB Yield Spread
The AAA yield spread narrowed from mid March to late August and shows no signs of stress. The BBB yield spread fell (narrowed) from mid March to July and then flattened the last six weeks (widened). AAA bonds are the highest rated investment grade bonds, while BBB bonds are the lowest rated investment grade bonds. This means BBB bonds are more sensitive to stress in the credit markets. There are no signs of stress right now. The red line is at 1.60 and a move above this level would show stress coming into the credit markets. This would be negative for stocks.
Breadth Indicators Barely Budge
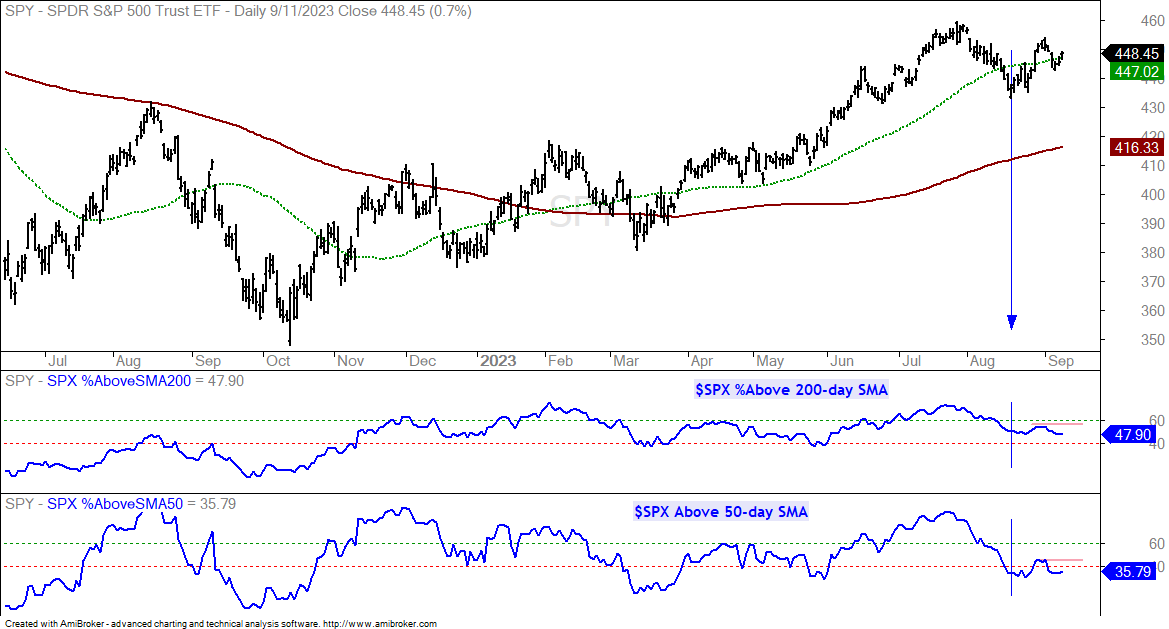
The S&P 500 SPDR (SPY) is up 2.8% over the last three weeks and back above its 50-day SMA (green dashed line). SPX breadth indicators, however, barely budged. The blue vertical lines on the chart below mark August 18th, which is when SPY formed a low 3 weeks. SPX %Above 200-day SMA was at 51.39% and SPX %Above 50-day SMA was at 33.40% then. Despite a three-week bounce, fewer stocks are above their 200-day SMAs now (47.9%). More stocks are above their 50-day SMAs (35.79%), but this indicator remains subdued because it is below 40%. Breadth is not keeping pace on the current bounce and this could spell trouble. Both indicators need to break above their late August highs to reverse this negative.
SPY Bounces off Breakout Zone
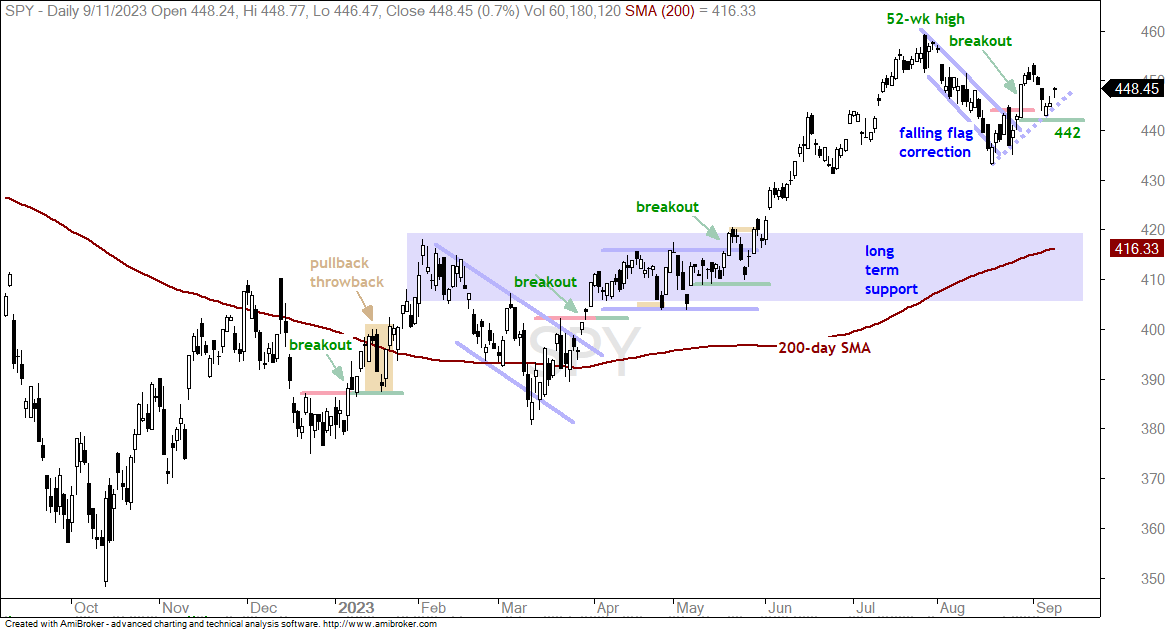
SPY remains in a long-term and short-term uptrend. With uninspiring breadth and September seasonality, I am focused on the short-term uptrend and support. SPY broke out with a surge on August 29th, fell back to the breakout zone and bounced the last two days. This bounce reinforces support from broken resistance. Support is set at 442 and a break here would reverse the short-term upswing.
A break at 442 would signal a continuation of the August decline and project a move to the 405-420 area (blue shading). Yes, such a break could be quite negative because price direction would then align with negative seasonal patterns. The most obvious downside target is the rising 200-day SMA, which is currently at 416.
QQQ Establishes Short-term Support
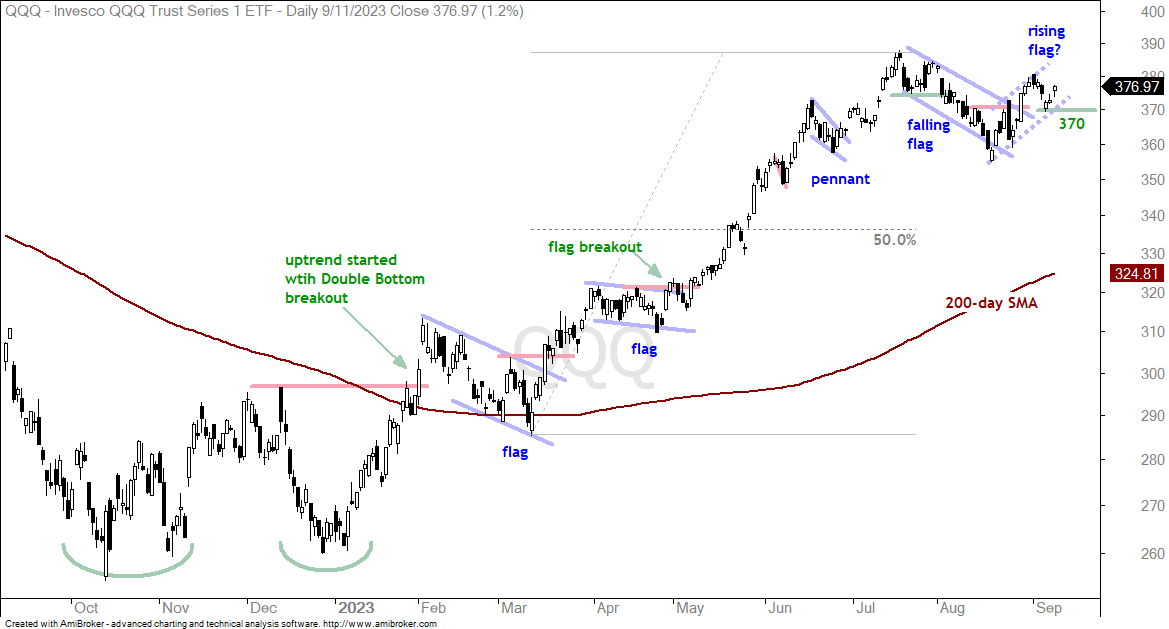
When taking a stance, the general practice is to determine what would prove that stance wrong (otherwise). My stance is bullish for SPY and QQQ because of the breakouts on August 29th. The chart below shows QQQ breaking out of a falling channel. What would prove this stance wrong? The short-term uptrend could be a rising flag (blue dashed lines) with support at 370. A close below 370 would break flag support and signal a continuation of the August decline. QQQ could then retrace half of the March-July advance and fall to the 330-340 area.
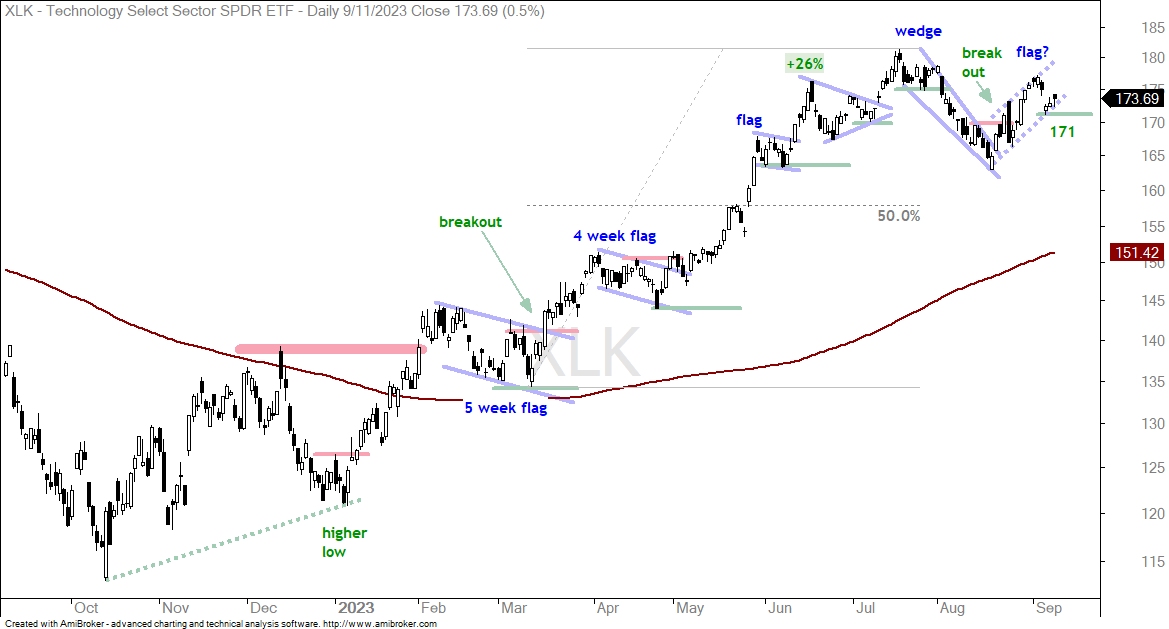
The next chart shows the Technology SPDR (XLK) with a breakout and a short-term uptrend the last few weeks. Should XLK break 171, I would then view this advance as a bear flag (rising) and the break would signal a continuation of the August decline. This would target a move to the 150-155 area.
Mid-caps and Small-caps Remain Weak
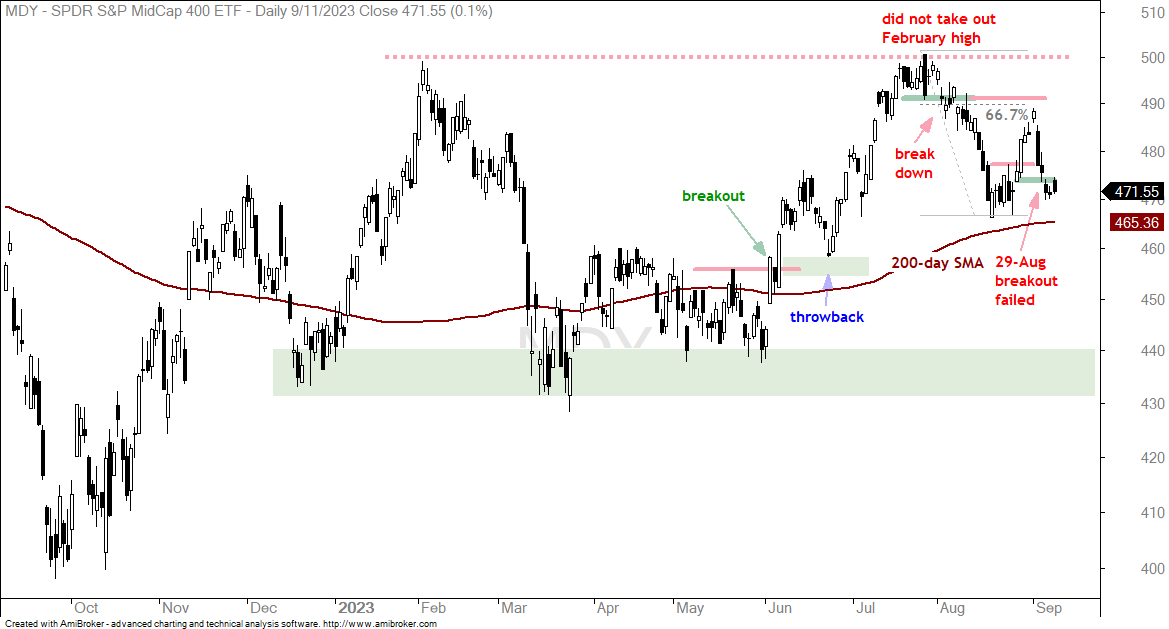
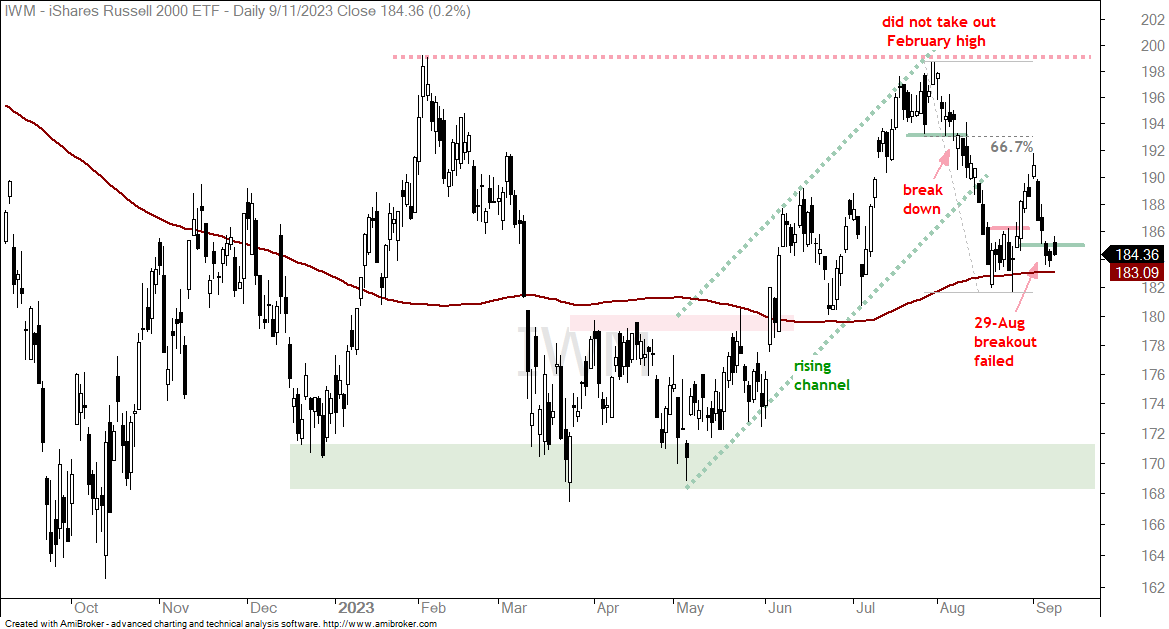
The early February high is a benchmark high that we can use to compare long-term performance. QQQ is some 20% above its February high and SPY is around 7.5% above this high. The S&P 500 EW ETF (RSP), S&P MidCap 400 SPDR (MDY) and Russell 2000 ETF (IWM) did not take out their February highs. These three failed near their February highs this summer and they are currently around 5% below the February highs. They are showing relative weakness over the long and short term timeframes.
The first chart shows MDY hitting its February high in July and turning down in August. Technically, MDY exceeded its February high with the long black candlestick on July 28th. In reality, however, it did not break the February high and is underperforming. Short-term, MDY broke support in early August and then returned to this support break with a rebound in late August. This rebound also retraced around 66.7% of the prior decline. MDY then fell sharply the last five days and was unable to hold the August 29th breakout. MDY looks poised to test its support zone in the 430-440 area.
The next chart shows the Russell 2000 ETF (IWM) failing to take out its February high and breaking down in August. The ETF broke short-term support in early August and broke the lower line of the rising channel in mid August. IWM bounced with the rest of the market on August 29th, but failed to hold this bounce as it fell sharply the last five days. IWM looks poised to break its 200-day SMA and tests support in the 170 area.
TLT Tests October Lows
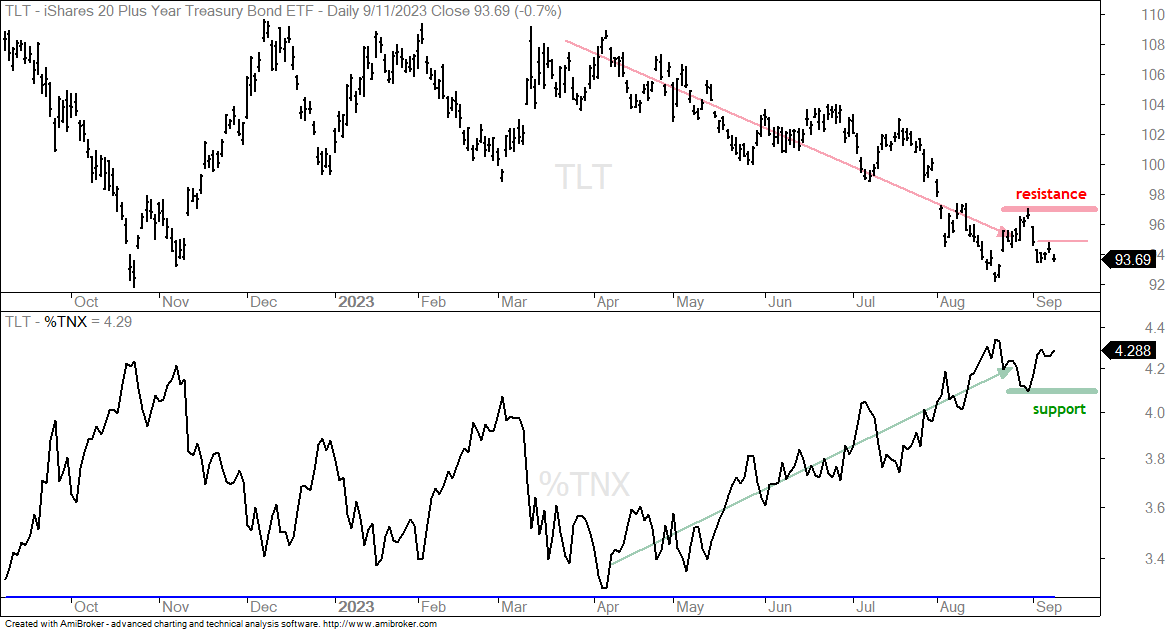
Treasury yields rise when Treasury bonds fall and vice versa. The chart below shows the 20+ Yr Treasury Bond ETF (TLT) falling from the 109 area to the 92 area (April to August). In the meantime, the 10-yr Treasury Yield ($TNX) moved from 3.3% to 4.3%. TLT is in a downtrend and $TNX is in an uptrend. TLT surged in late August and then fell back in September. This move established resistance at 97 and a breakout here would be bullish. Chartists looking to get a jump can watch short-term resistance at 95.