As many of you already noticed, I made some modifications to the main member pages and the offerings. The offerings are split into two: System Trader and Chart Trader. System Trader covers the quantified strategies and signal tables (pure systematic). Chart Trader covers the reports with chart setups, trading ideas and analysis (discretionary).
It takes considerable time to develop new trading strategies. In fact, the time required for strategy development is indefinable. I cannot promise a new strategy every month and do not know when a new strategy will pass rigorous testing. I have a few in the pipeline, but need more development time.
In the meantime, I separated the systematic offering from the discretionary offering. Chart Trader reports and videos will be posted on Tuesdays and Thursdays before 8AM ET. We will cover the major index ETFs for broad market analysis and bring trading ideas for stocks and ETFs.
There are quick access links at the top of the main member pages. “Strategies & Updates” covers the strategy reports and updates. “Signal Pages” contains the signal table pages for the active strategies. “Market Timing” is the market regime page with the Composite Breadth Model, yield spreads and Fed balance sheet. “Chart Trader” contains the reports with chart analysis and trading ideas.
The next Chart Trader report/video will be posted on Thursday, August 24th.
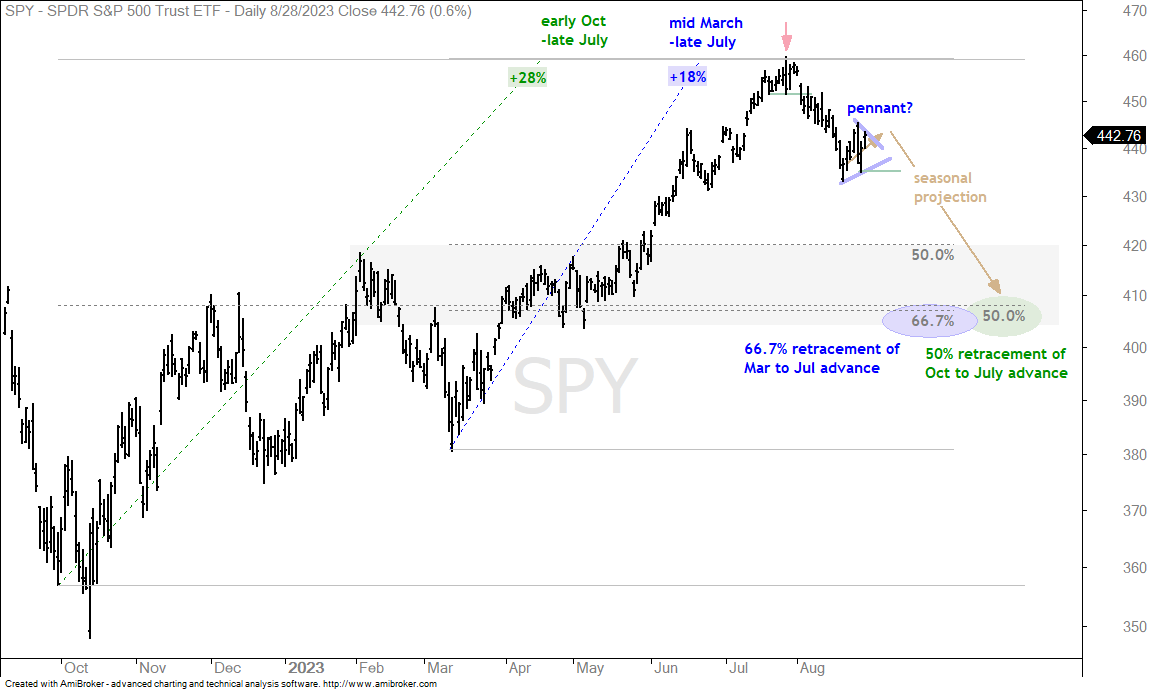
SPY: A Pennant and a Projection
SPY peaked on July 27th with a big outside reversal day (red arrow) and broke short-term support with a gap-decline on August 2nd. SPY and the major index ETFs then fell into mid August and became oversold on August 17-18. This oversold condition gave way to a bounce the last eight days. Now what?
Was the August decline the first shoe to drop? Or, is this just a normal pullback after an exceptionally strong advance (+18% from mid March to late July). I favor the latter and expect further weakness (deeper correction). SPY could be forming a small pennant now and a break below Friday’s low (435) would signal a continuation of the prior decline. We are in the midst of a bounce as long as support at 435 holds.
The yellow arrow lines show a price projection, which was first put forth on August 19th (here). I based this projection on retracements, broken resistance and seasonal weakness in September (gray shading). Take all projections with a pinch of salt! Or, perhaps even a bucket.
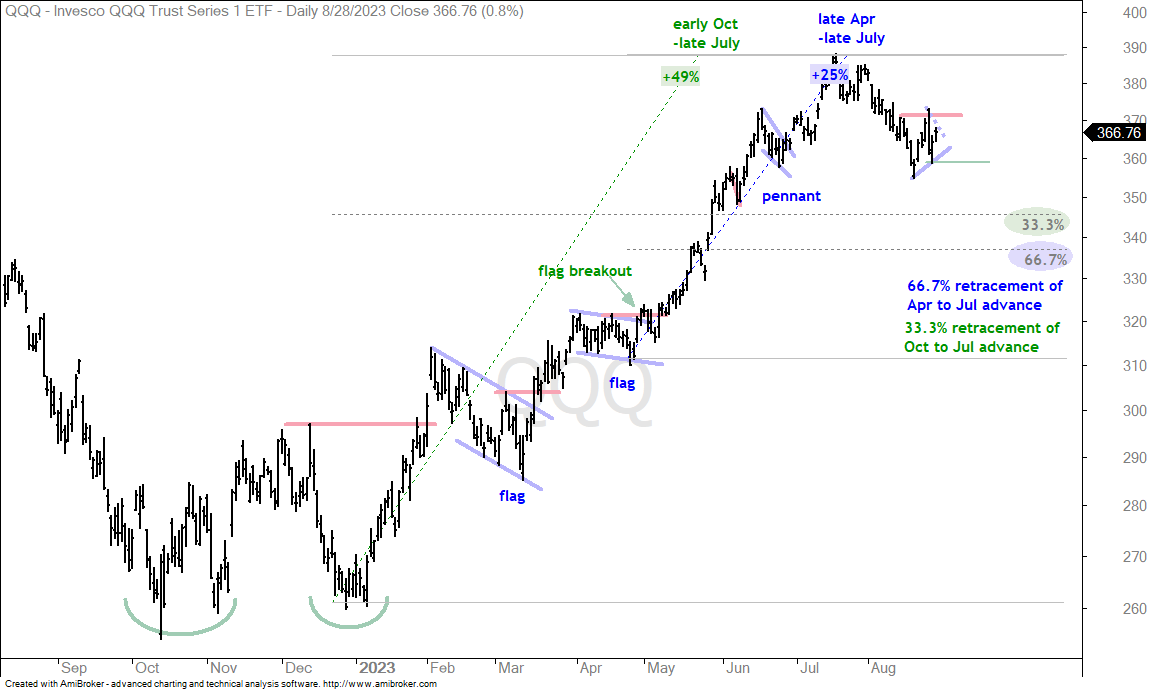
QQQ: A Scenario Similar to SPY
SPY and QQQ are likely to follow similar trajectories. QQQ also got a bounce the last eight days and a pennant could be forming. A break below Friday’s low (358.58) would signal a continuation lower and target a move to the 340 area. This area is marked by two retracements. First, there is a 33.3% retracement of the October to July advance. Second, we have a 67.7% retracement of the April to July advance. 340 sits between the two.