The S&P 500 SPDR (SPY) fell back to its 200-day SMA in February and then surged with a sharp advance the last few days. This advance triggered breakouts in several ETFs that were featured in last week’s report and video. Today’s report will update these charts and set the re-evaluation levels to watch going forward. Not all ETFs broke out and some remain with short-term pullbacks. I will set short-term resistance levels to watch for these.
About the ETF Trends, Patterns and Setups Report
This report contains discretionary chart analysis based on my interpretation of the price charts. This is different from the fully systematic approach in the Trend Composite strategy series. In this ETF Trends, Patterns and Setups report, I am looking for leading uptrends and tradable setups within these uptrends. While I use indicators to help define the trend and identify oversold conditions within uptrends, the assessments are mostly based on price action and the price chart (higher highs, higher lows, patterns in play). Sometimes the chart assessment can be at odds with the indicators.
Report Schedule
Tuesday – 7-Mar: Market/ETF Report
Wednesday – 8 Mar: Market/ETF Video
Friday – 9 Mar: Mean-Reversion Strategy Update
Systematic Strategies and Tables
Here are the three active strategies and their respective tables.
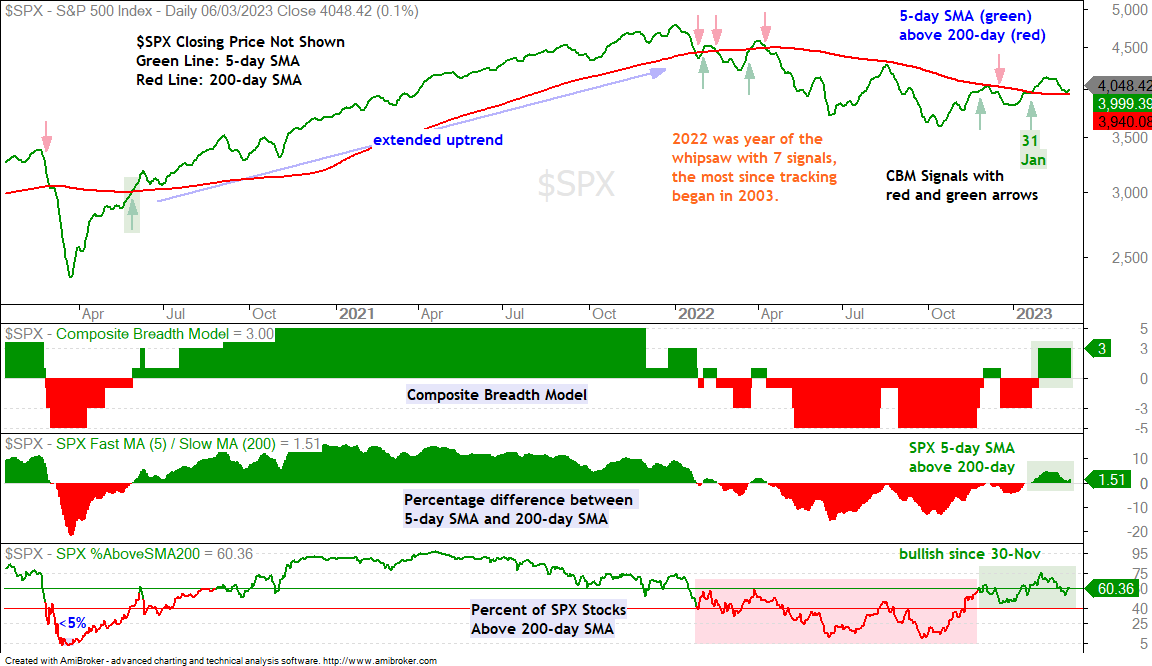
The Composite Breadth Model turned positive with a move to +3 on January 31st and the weight of the evidence is bullish for stocks. The 5-day SMA for the S&P 500 is above the 200-day and 60% of S&P 500 stocks are above their 200-day SMAs.
As far as my bull/bear stance for stocks, I am watching the Composite Breadth Model and the 5/200 cross for the S&P 500. The bulls have an edge as long as the CBM is positive and the 5-day is above the 200-day (currently 1.51%). I would turn bearish on stocks should one of these indicators turn bearish.
SPY Remains within Rising Wedge
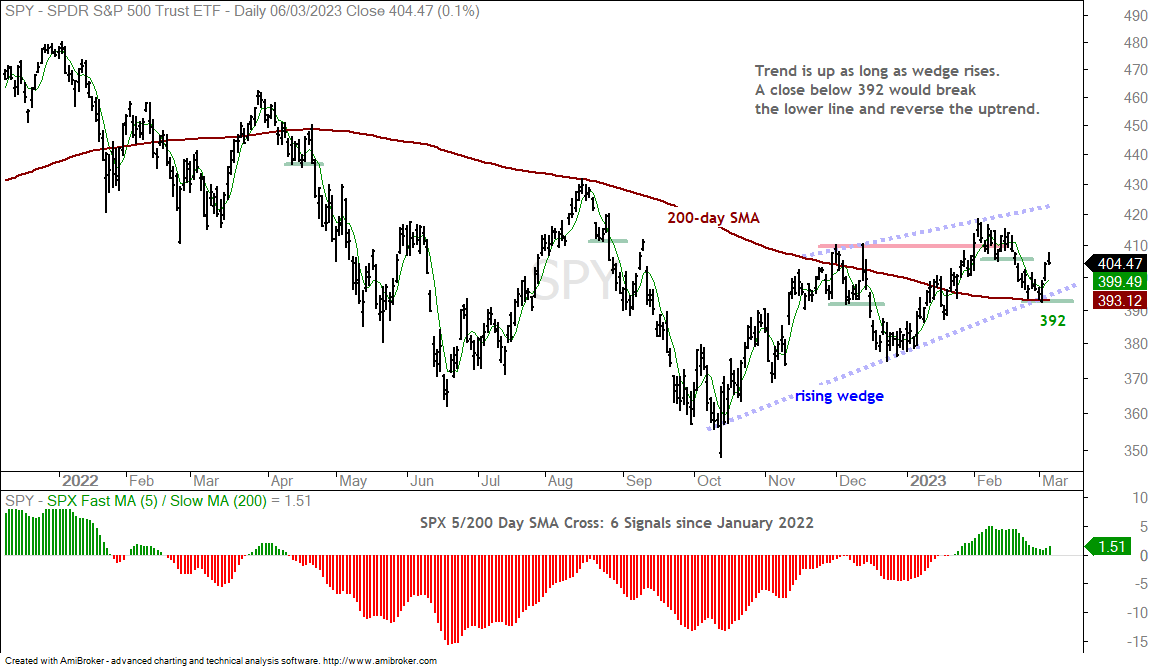
SPY fell in February and then bounced off the 200-day SMA in early March to establish a new support level at 392. The trend is clearly up as long as SPY remains within the rising wedge and above the early March low. A break below the early March low would break wedge support and reverse the uptrend. Such a move would erase the early March surge, which would also be a sign of weakness.
The indicator window above shows the percentage difference between the 5-day SMA and 200-day SMA for the S&P 500. The 5-day is at 399.49 and currently 1.51% above the 200-day. A bearish cross here would be the final straw to break the bull’s back.
The Short-term Swings
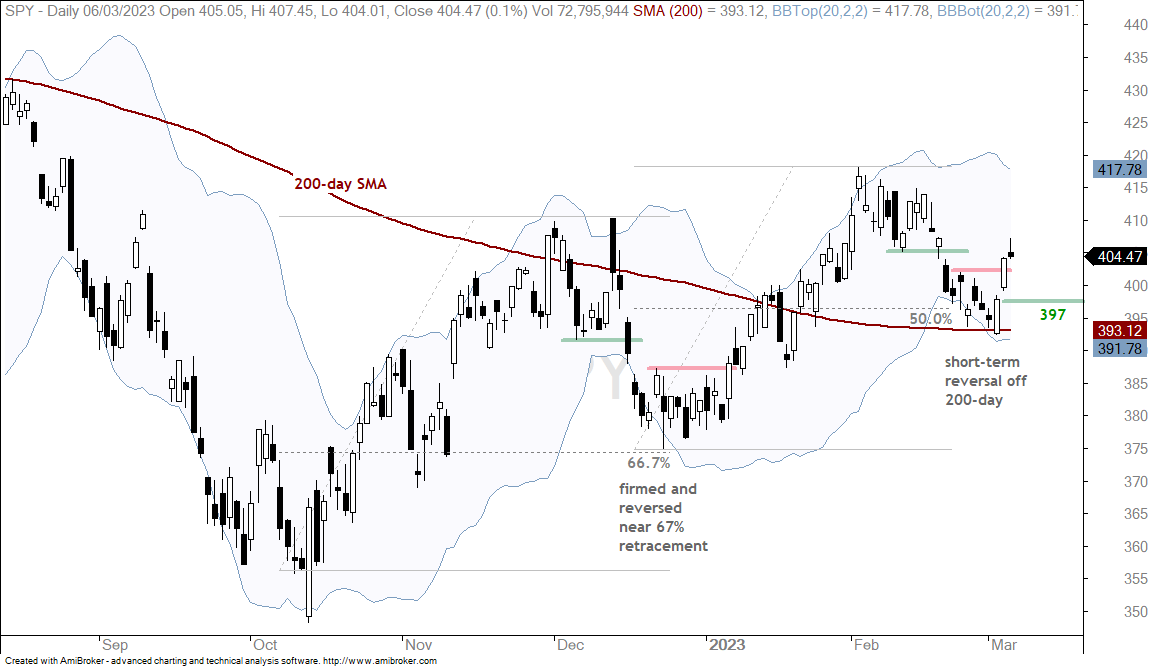
The next chart shows candlesticks and a surge off the 200-day SMA. SPY formed a bullish engulfing on Thursday and broke short-term resistance with a follow through surge on Friday. Short-term, it is important that Friday’s follow through surge holds. A close below 397 would erase this surge and call for a re-evaluation.
I am mostly focused on SPY because the S&P 500 is the most important benchmark for US stocks. The surge off the 200-day and short-term breakout are bullish for stocks in general. Failure to hold the short-term breakout would be strike one against the bulls. A break below the early March low would be strike two. A 5/200 day SMA cross for the S&P 500 would be strike three.
QQQ Bounces off Breakout Zone
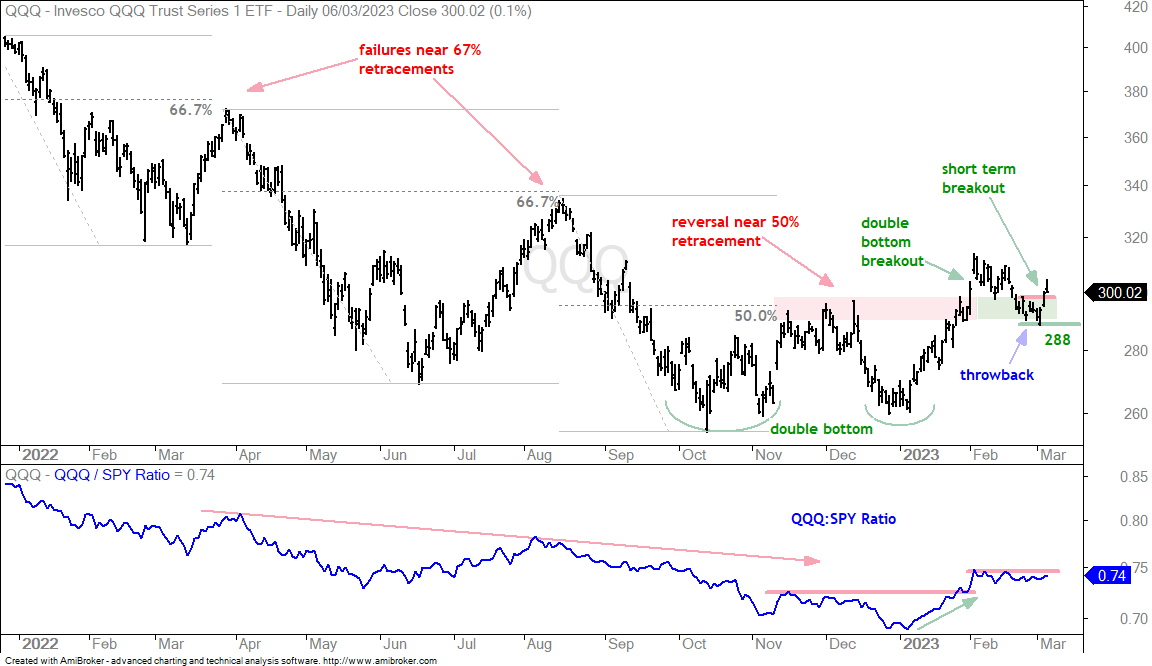
QQQ broke double bottom resistance with a surge into early February and then fell back to the breakout zone by the end of the month. The breakout zone (resistance) turns into the first support zone (red/green shading). QQQ held this zone with a surge the last three days. The February decline is a throwback after the breakout and this pullback is normal after at 20% surge from late December to early February. QQQ firmed in the 289-299 area as buying pressure increased and then broke short-term resistance. This buying pressure marks a demand zone that becomes key support (288). A close below 288 would signal a resurgence of selling pressure (supply) and call for a re-evaluation.
Small-caps Slammed
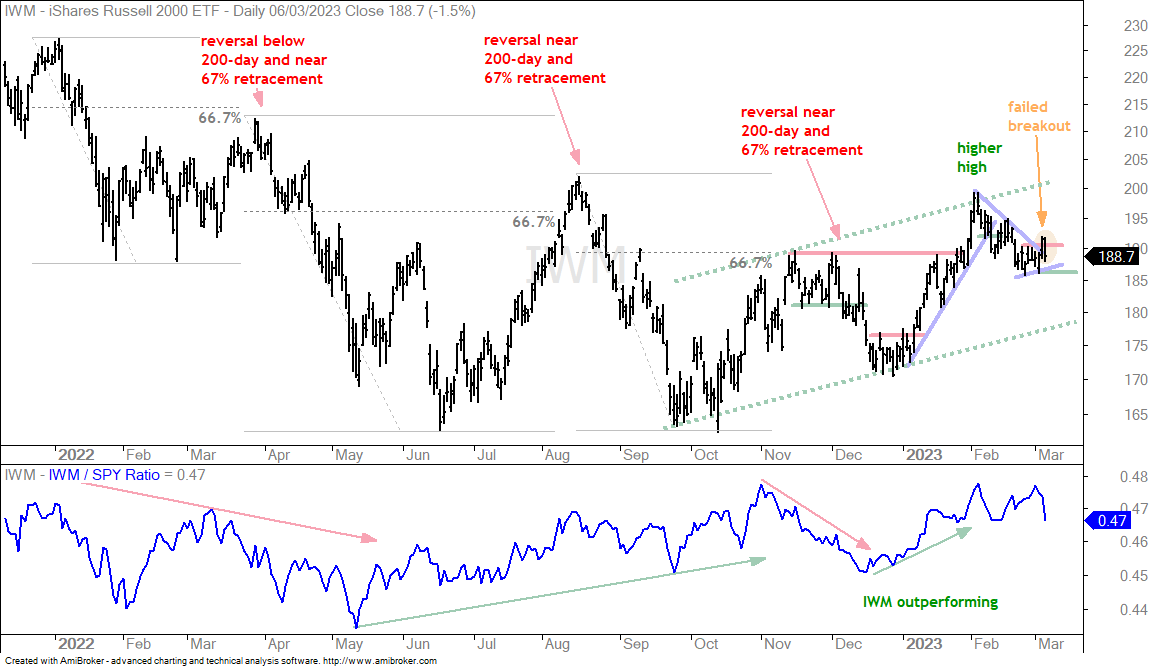
The Russell 2000 ETF (IWM) took part in the Friday surge (+1.4%) with a short-term breakout, but gave it all back on Monday with a bigger decline (-1.5%). The failed breakout is a negative for small-caps, especially relative to large-caps (SPY, QQQ). There is still a slight upswing in place since late February and I am marking short-term support at 186. Also note that S&P SmallCap 600 Advance-Decline Percent finished a -88%, which means 94% of components declined and 6% advanced on Monday. This exceptionally strong downside day was the second in the last two weeks. Again, not a good sign for small-caps.
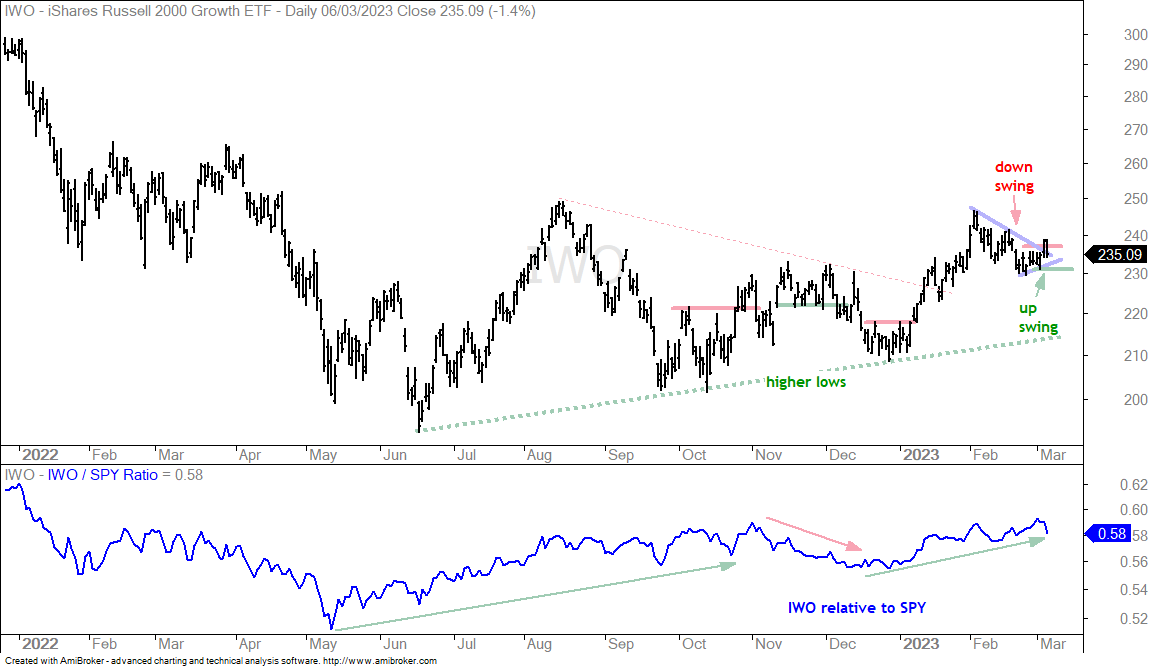
The next chart shows the Russell 2000 Growth ETF (IWO) breaking short-term resistance with a surge on Friday and falling back on Monday. There is a small upswing in progress since late February with last week’s low marking short-term support. A break below 231 would reverse this upswing.
Bonds Fall Short of a Breakout
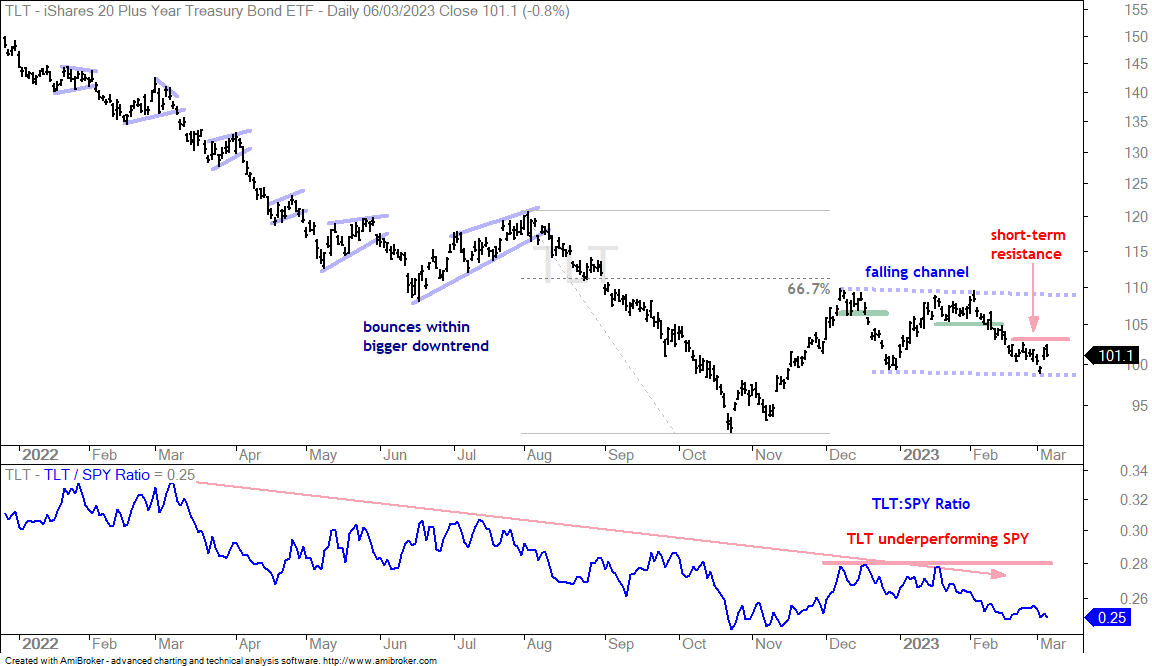
First, note that Chairman Powell is testifying before Congress and this usually means more volatility in the bond, currency and metals markets. The 20+ Yr Treasury Bond ETF (TLT) surged along with the stock market on Friday, but fell short of a breakout and remains in a short-term downtrend. Stocks and bonds have been positively correlated over the last 14 months, which means they largely rise and fall together. Most recently, TLT and SPY fell in February and bounced on Friday. TLT, however, remains short of a breakout and the short-term trend is still down. A break above 103 would reverse the short-term downswing and this could also be positive for stocks.
UUP Rises as TLT Falls
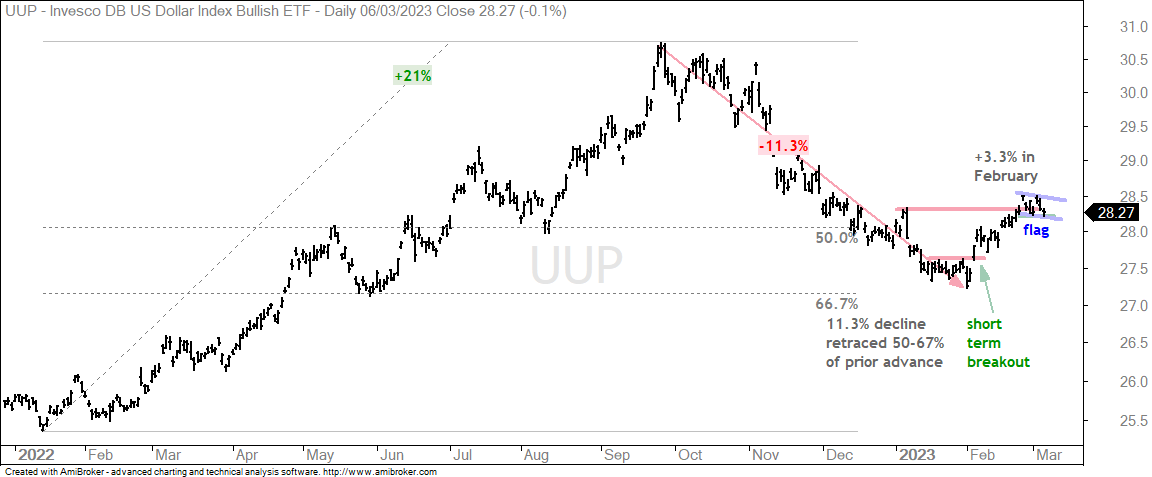
The Dollar Bullish ETF (UUP) was one of the best performers in February as it moved counter to TLT (negative correlation). A continued downtrend in TLT would be positive for the Dollar, while a short-term breakout would be negative. UUP surged above 28 in February and then consolidated with a small falling flag. A breakout at 28.5 would signal a resumption of the February surge. I am marking short-term support at 28.2 and a close below this level would reverse the short-term upswing in the Dollar. An upside breakout in the Dollar would be negative for gold, while a short-term support break would be positive for bullion.
Gold SPDR Breaks Short-term Resistance (GLD)
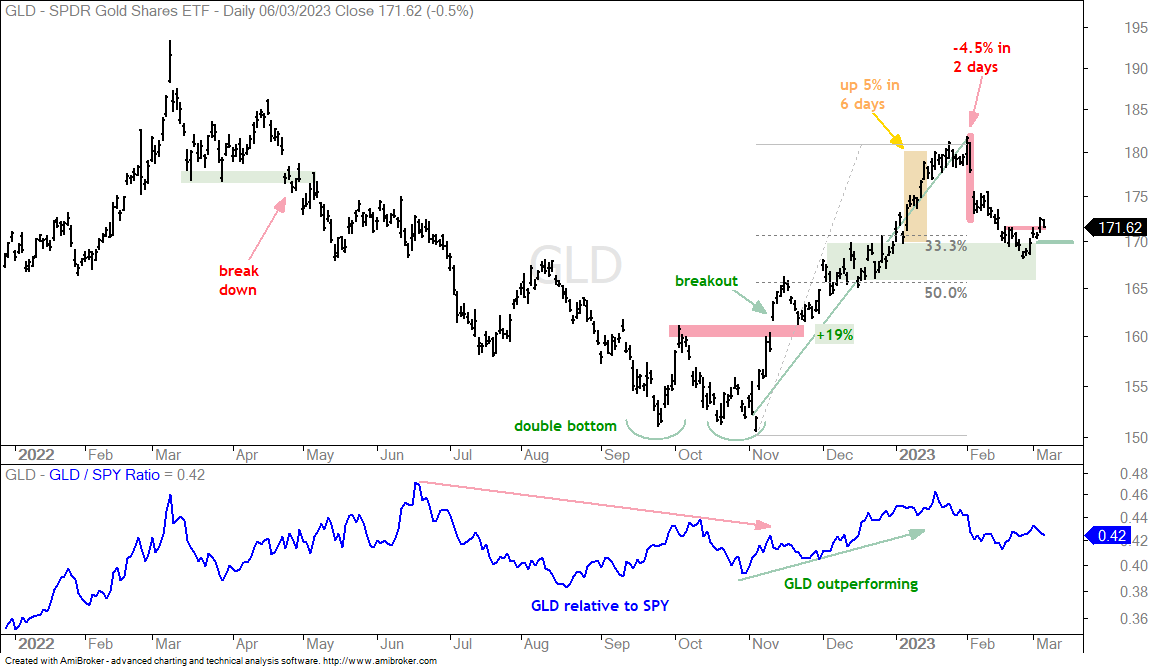
The Gold SPDR (GLD) bounced off the 33-50 percent retracement zone and broke short-term resistance on Friday. The yellow metal fell back on Monday, but this is not enough to negate the breakout. As with all breakouts and bullish signals, we must now set the level that would prove this signal otherwise (wrong). There are two items to watch: a break below 170 would negate this breakout and an upside breakout at 28.5 in UUP would be negative for gold.
Oil Swings To and Fro (USO)
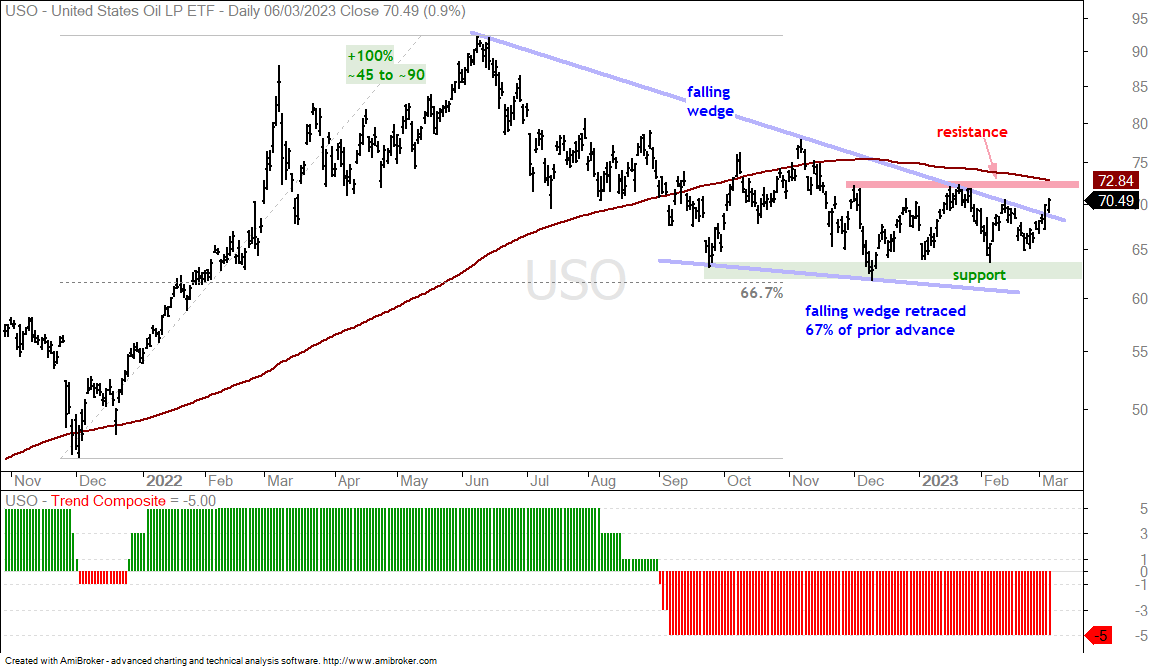
The US Oil Fund (USO) trended lower from June to December and then traded flat the last three months. Overall, the decline since June formed a big falling wedge that retraced around 67% of the prior advance, which was 100%. The November-January highs mark resistance and a breakout is needed to fully reverse this downtrend. Short-term, USO surged 8.6% the last eight days and broke the upper line of the falling wedge. Keep in mind that angled trendlines are very subjective. There is a lot of overhead resistance in the low 70s and a breakout at 73 is needed to fully reverse this downtrend (and break the 200-day SMA)
Cyber Holds Strong as Semis and Software Consolidate
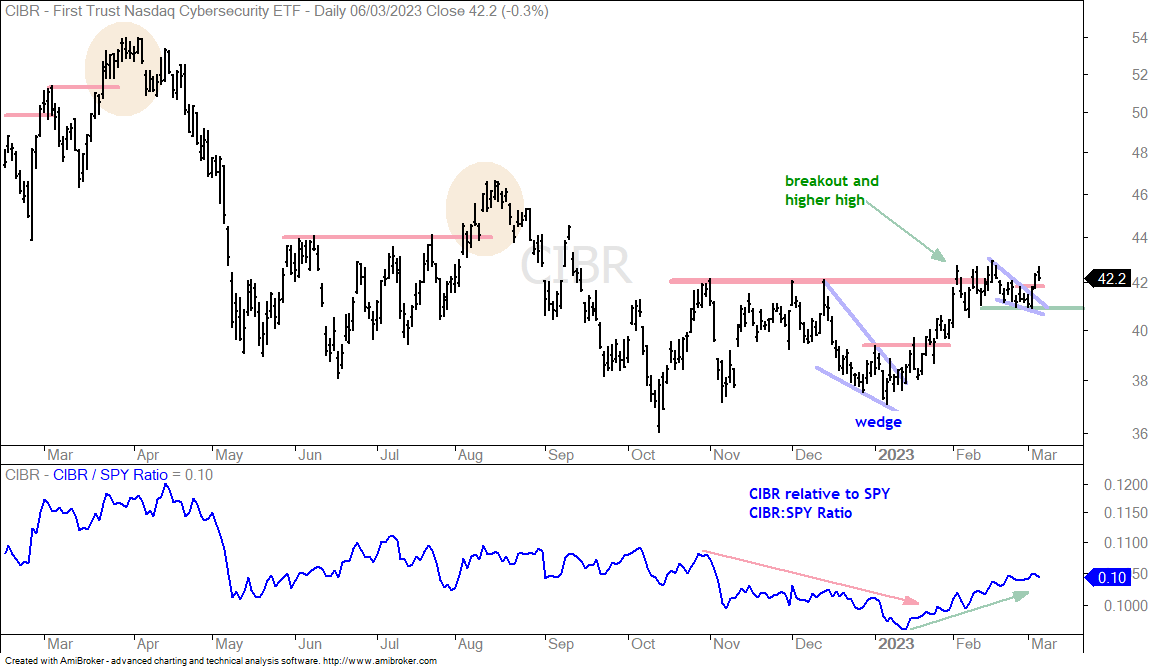
The Cybersecurity ETF (CIBR) broke out of a small pennant with a surge the last three days. CIBR held up the best of the tech-related ETFs in February because it did not break its early February lower and the SPY:CIBR ratio continued to rise (bottom window). The late February lows mark support and a close below 41 would argue for a re-evaluation.
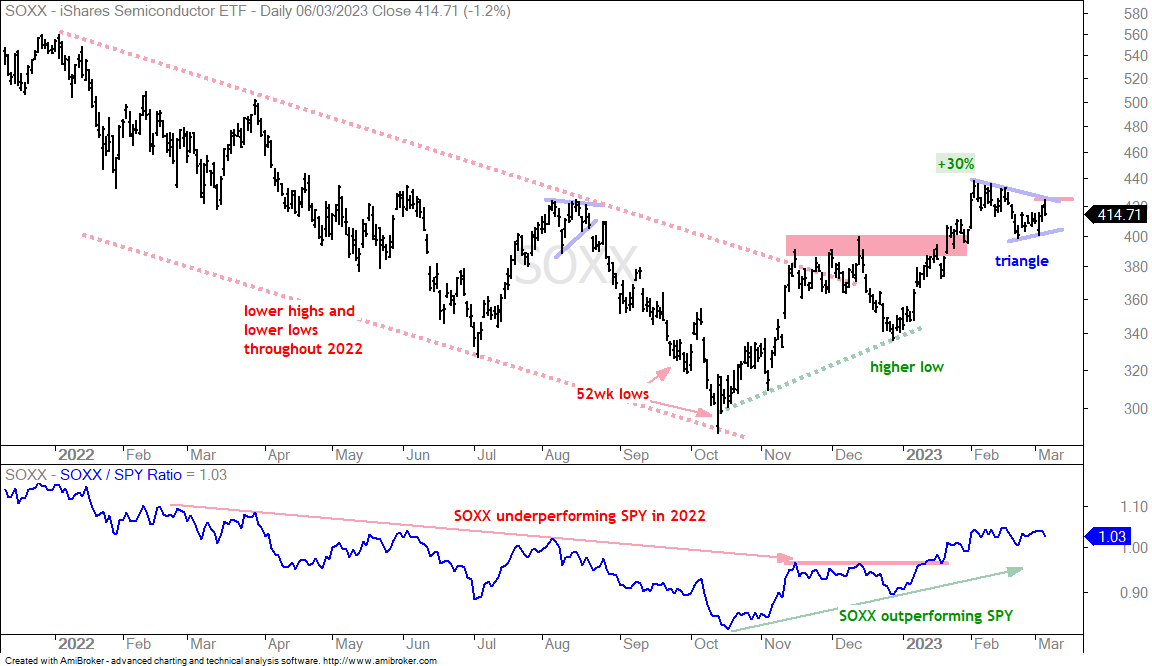
The Semiconductor ETF (SOXX) is setting up bullish as it consolidates after a 30% surge. A consolidation after an advance is typically a bullish continuation pattern. Consolidations work off overbought conditions and pave the way for the next move higher. A triangle consolidation is taking shape for SOXX and a breakout at 425 would signal a continuation higher. SOXX is also something to watch for clues on the tech sector. An upside breakout in SOXX would be positive for tech, while a break below 400 would be negative.
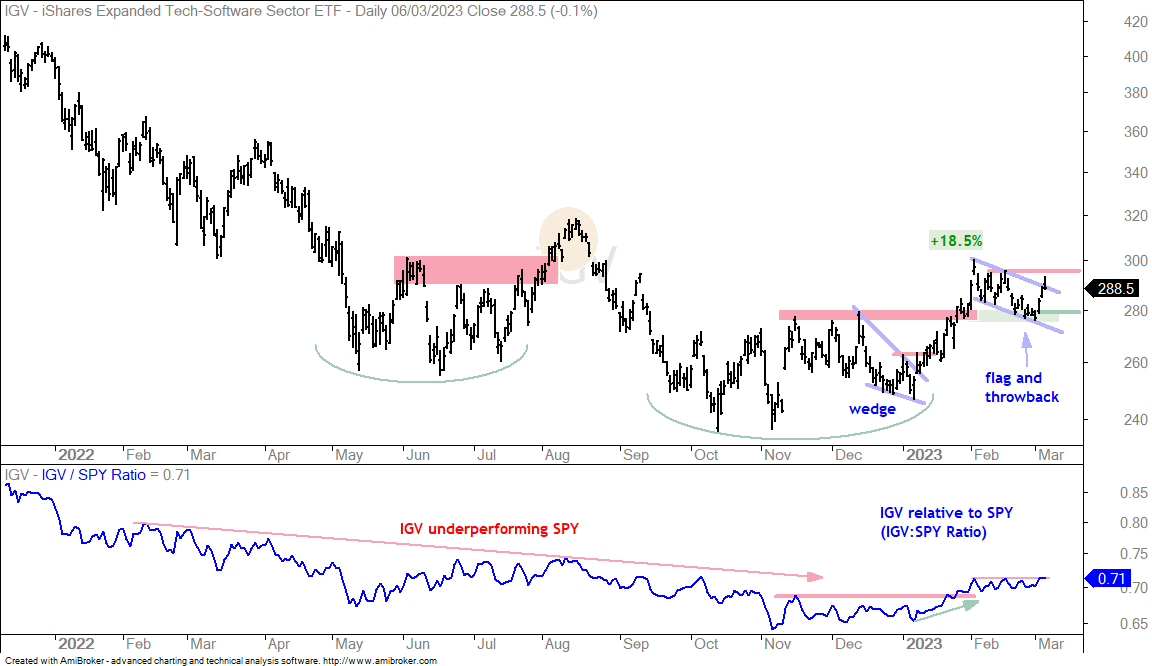
The next chart shows the Software ETF (IGV) with an 18.5% advance and breakout. The ETF fell back in February with a falling flag that tested the breakout zone, which turns first support. This is also a post-breakout throwback. IGV is attempting a flag breakout with the surge over the last three days. Further strength above the mid February high would complete the breakout. I am marking short-term support at 280 and a break below this level would be negative.
Concern with Retail, Housing and Regional Banks
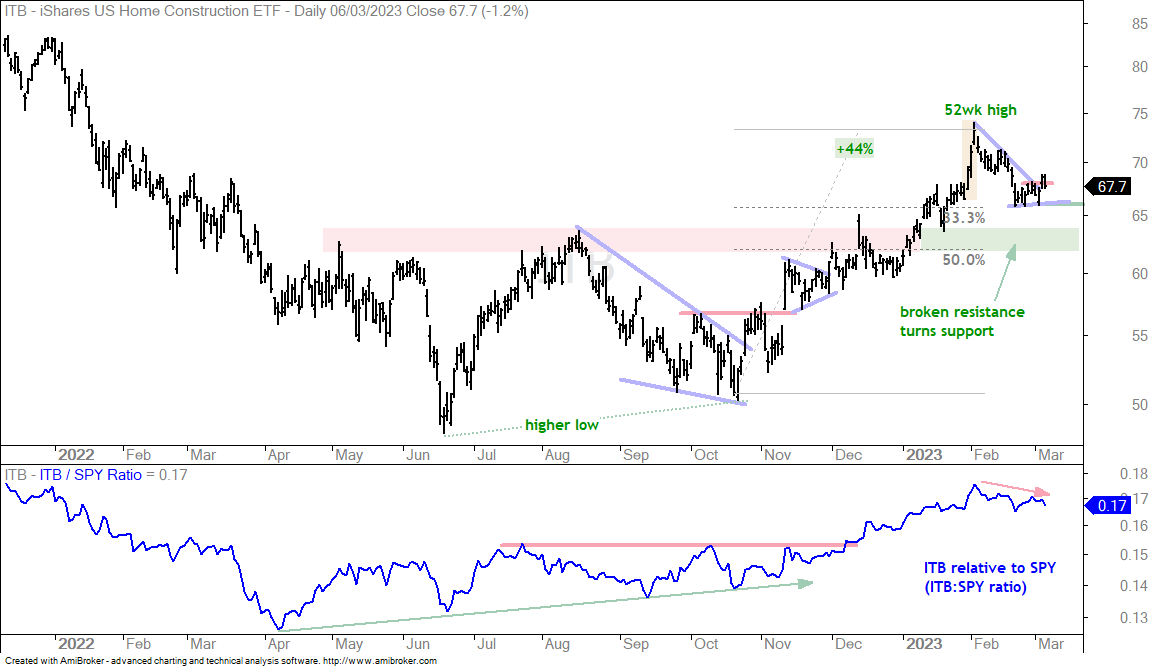
I am concerned with relative weakness in the Home Construction ETF (ITB), Retail SPDR (XRT) and Regional Bank ETF (KRE). ITB broke short-term resistance, but XRT and KRE did not and remain weak. Weakness here is weighing on small-caps. The first chart shows ITB with a 44% surge and a February pullback that retraced around 33%. ITB firmed in the upper 60s and broke short-term resistance on Friday, but fell back on Monday. Perhaps this is short-term noise. ITB, however, is underperforming since early February (red arrow in bottom window). A break below 66 would be bearish and argue for further weakness towards the next support zone (62-64).
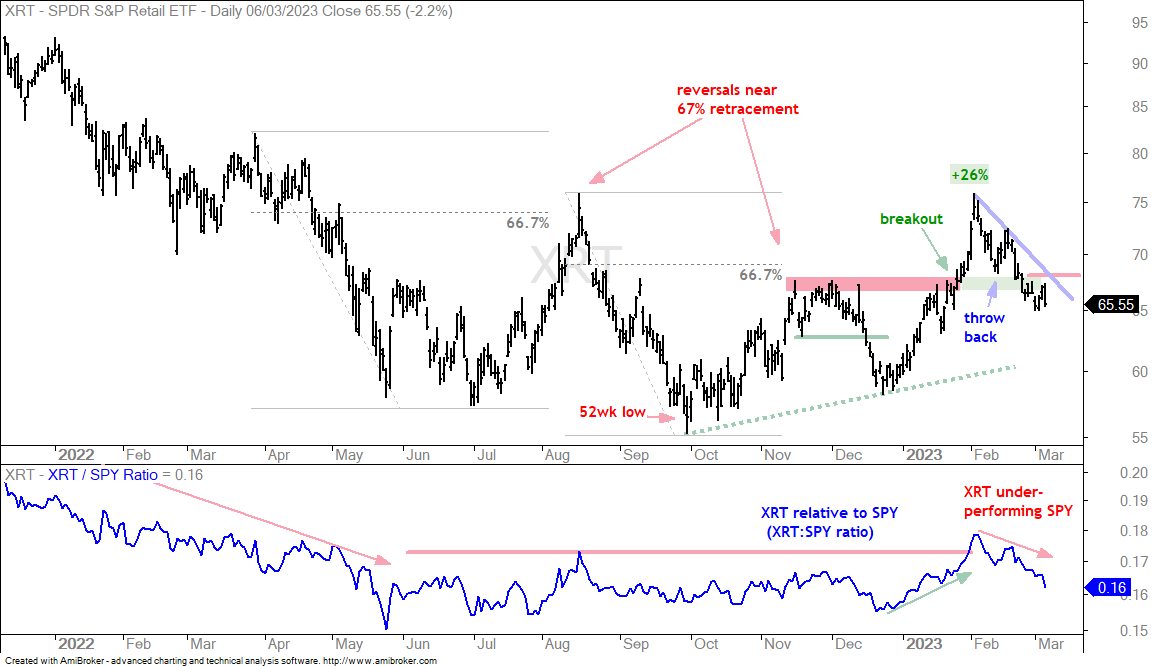
The next chart shows the Retail SPDR (XRT) with a 26% surge and breakout earlier this year. The ETF fell back to the breakout zone and bounce, but this bounce and breakout zone did not hold as XRT fell further. XRT bounced with the market on Thursday-Friday, but did not get a short-term breakout and fell 2.2% on Monday. The short-term trend is still down and XRT shows relative weakness as the XRT:SPY ratio fell sharply since early February. This is a negative. I am setting resistance at 68 and a breakout is needed to turn XRT into a positive again.
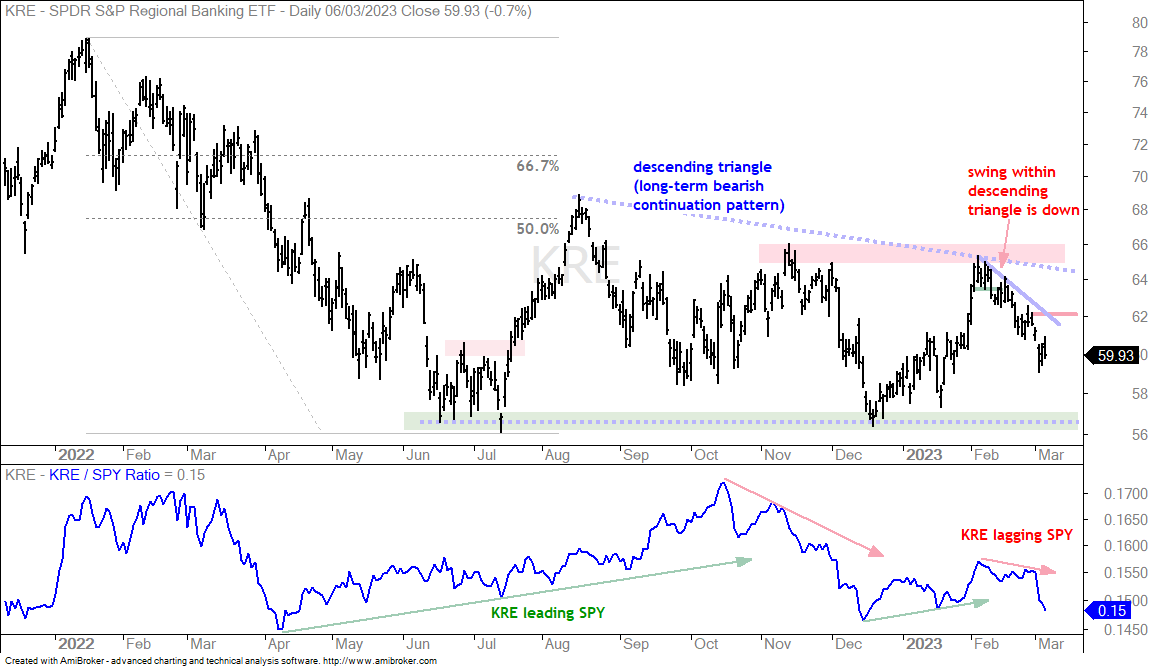
The next chart shows the Regional Bank ETF (KRE) hitting resistance in early February and reversing its upswing with a short-term support break on February 9th (red arrow). KRE continued lower the rest of the month and even fell here in March. KRE is one of the weakest ETFs and I am marking short-term resistance at 62.30.
Breakouts and Downswings to Watch (IYT, TAN, PBW, XBI)
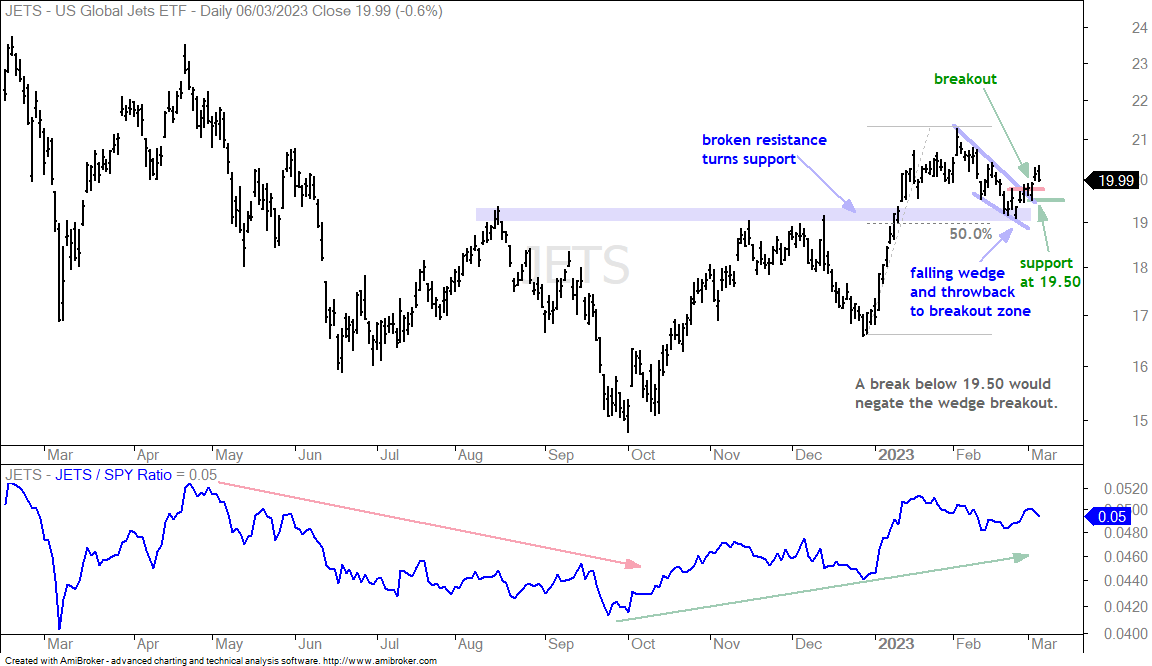
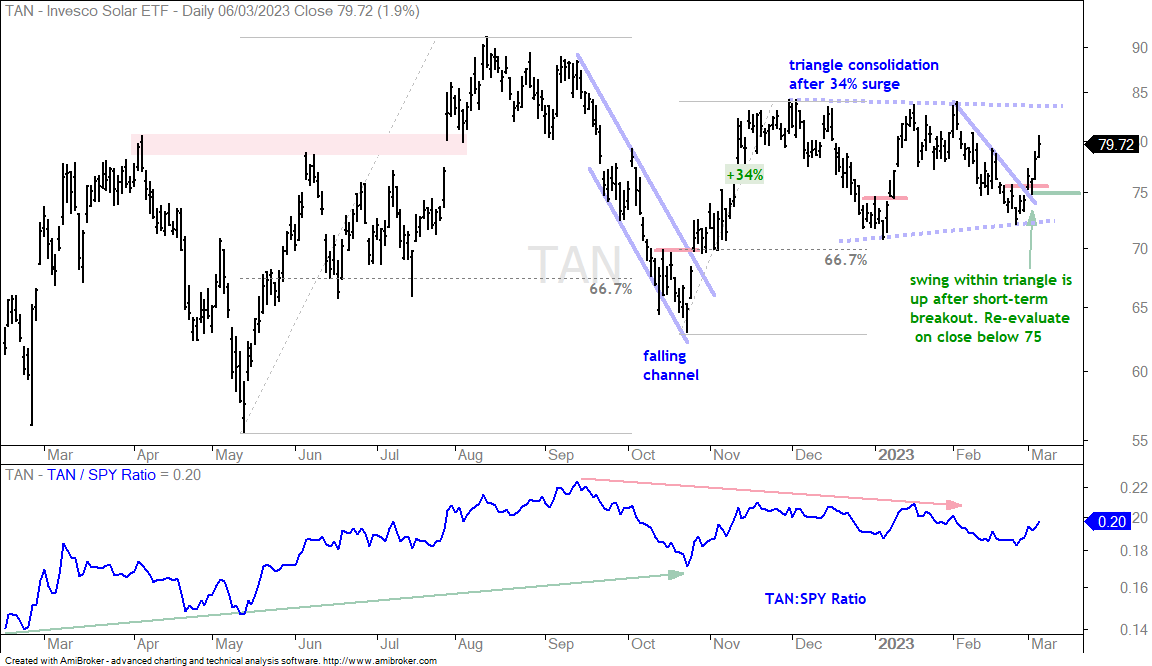
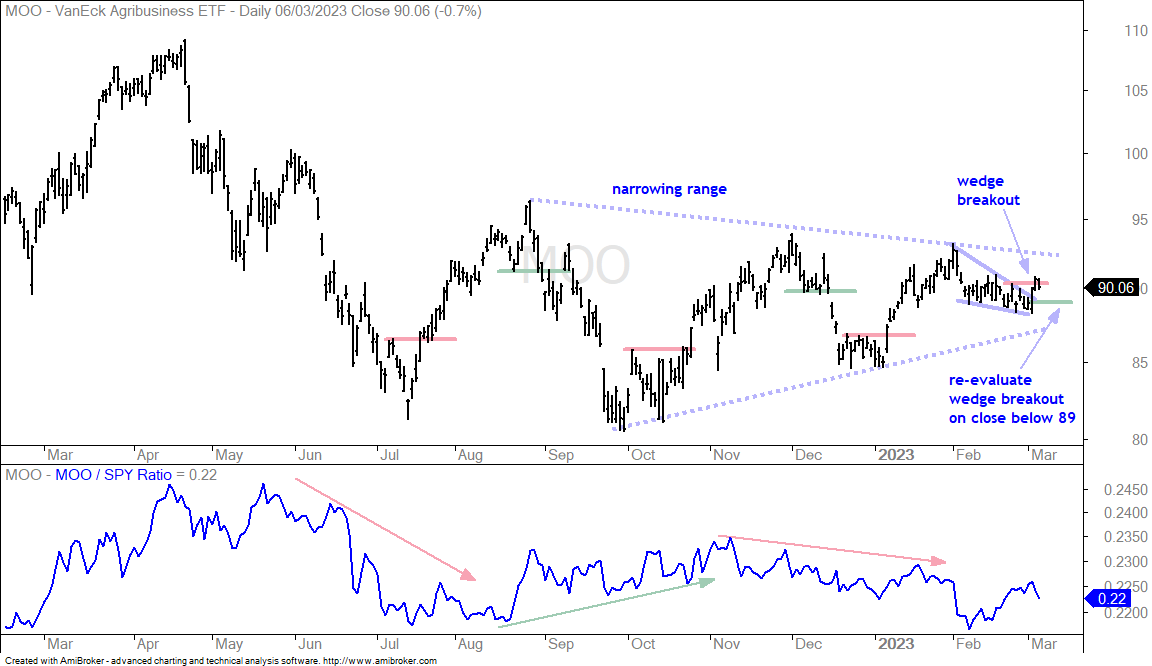
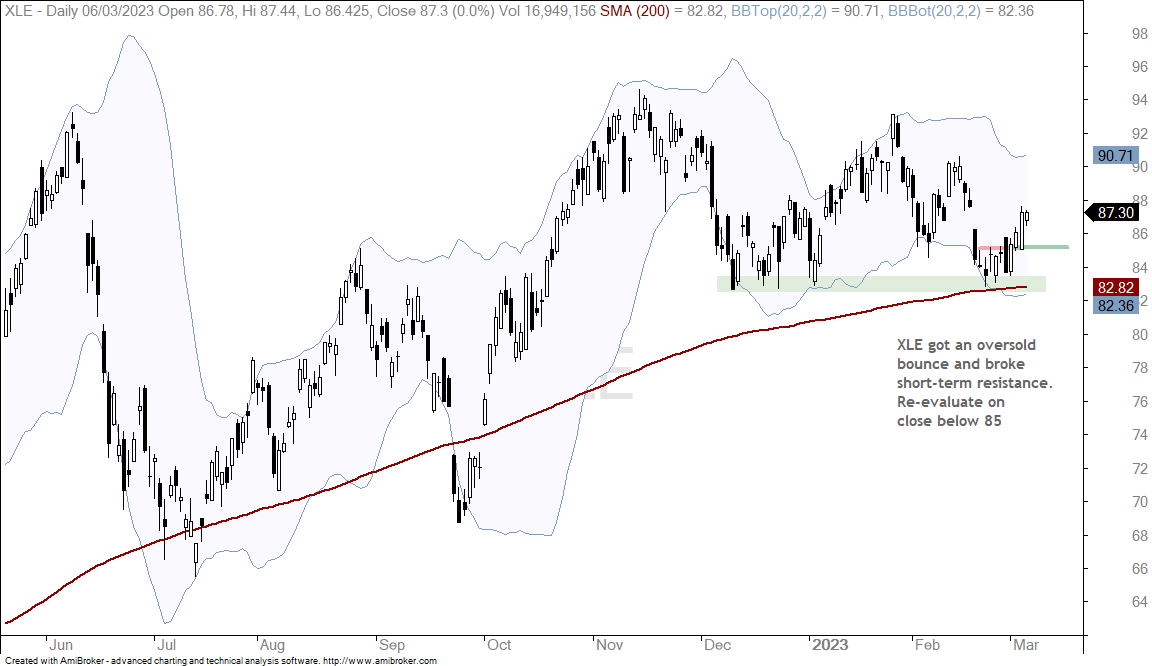
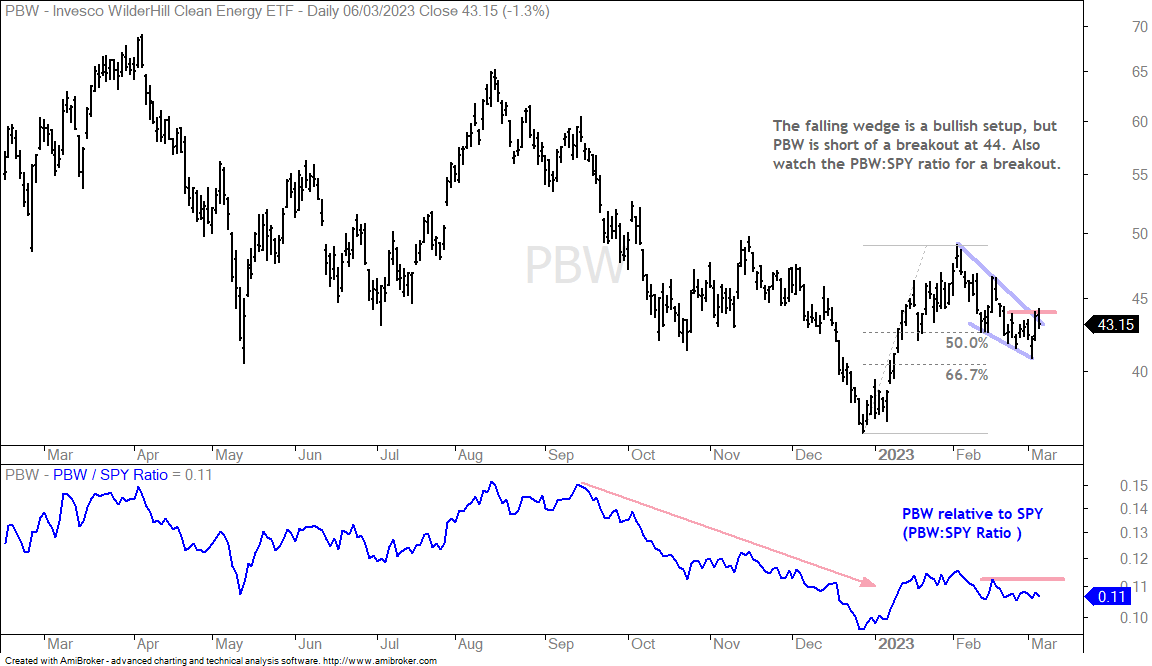
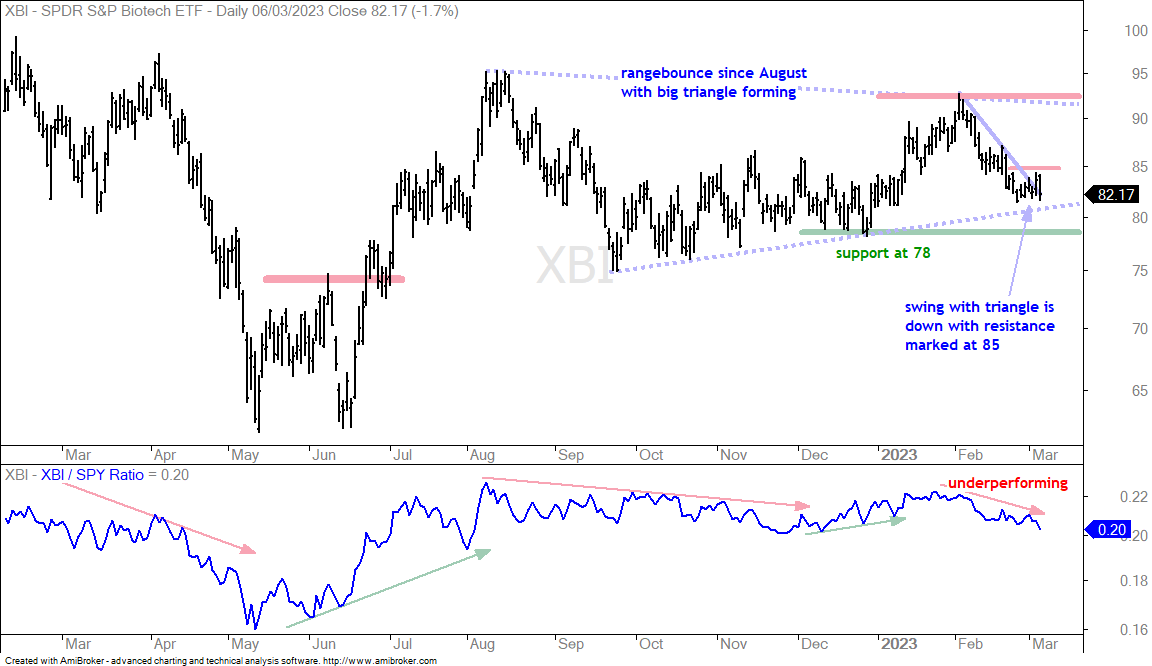
The next charts show breakouts and pullbacks to watch. The Airlines ETF (JETS), Solar Energy ETF (TAN), Energy SPDR (XLE) and Agribusiness ETF (MOO) have breakouts to monitor. The breakouts reversed the downswings so I set the re-evaluation levels. The Clean Energy ETF (PBW) and Biotech SPDR (XBI) have potentially bullish corrections working so I set short-term resistance.
The Price Leaders (KIE, PPA, XES, PHO)
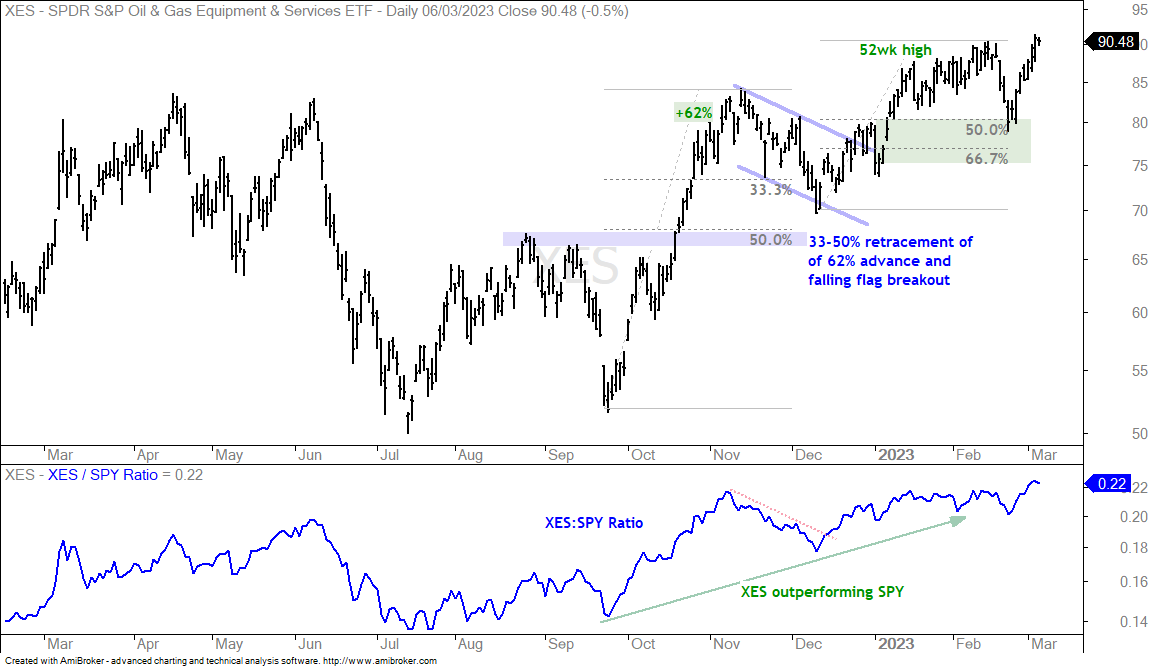
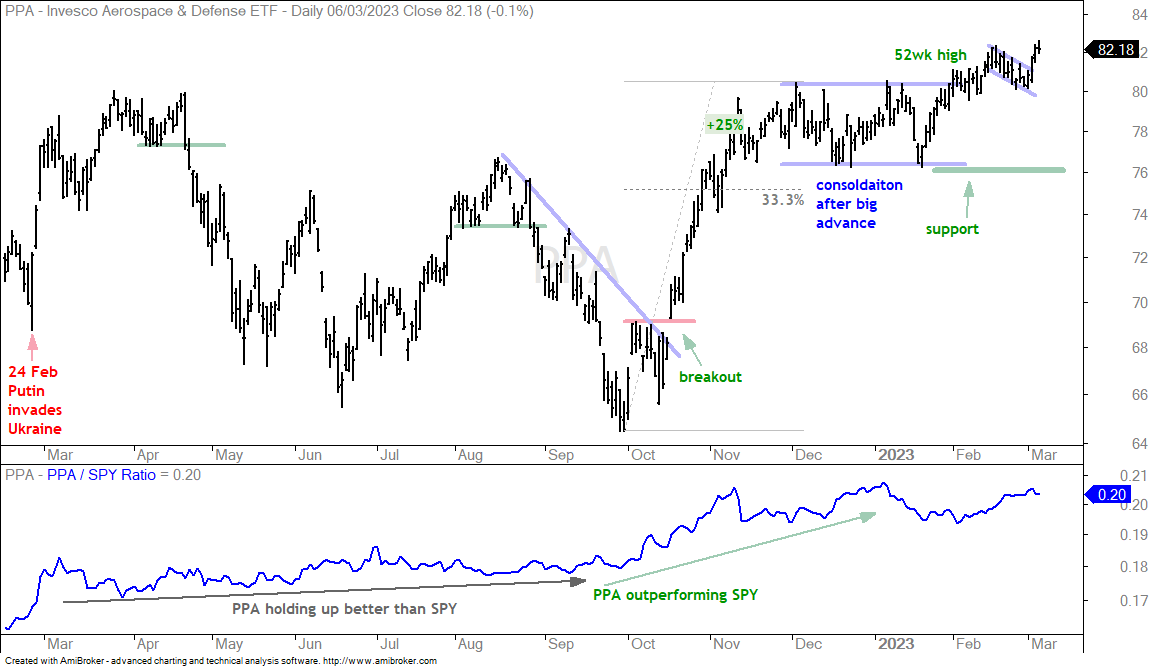
The Aerospace & Defense ETF (PPA) and Oil & Gas Equipment & Services ETF (XES) are clear price leaders because they recorded fresh 52-week highs in March. A 52-week high means the ETF is in a clear uptrend and the ETF is a leader. Note that only 11 of the 275 ETFs in the MasterList recorded 52-week highs the last five days (EUFN, EWI, EWP, EQUAL-WEIGHT, GREK, ITA, PPA, PSCC, PSCI, XES, CANE). The first chart shows XES falling to the 50% retracement and the top of the support zone in late February and then surging to a new high. There is no setup on this chart, just a leading uptrend.
The next chart shows PPA breaking out of a small falling flag last week and hitting a new high. Again, there is no setup on this chart now, just a leading uptrend.
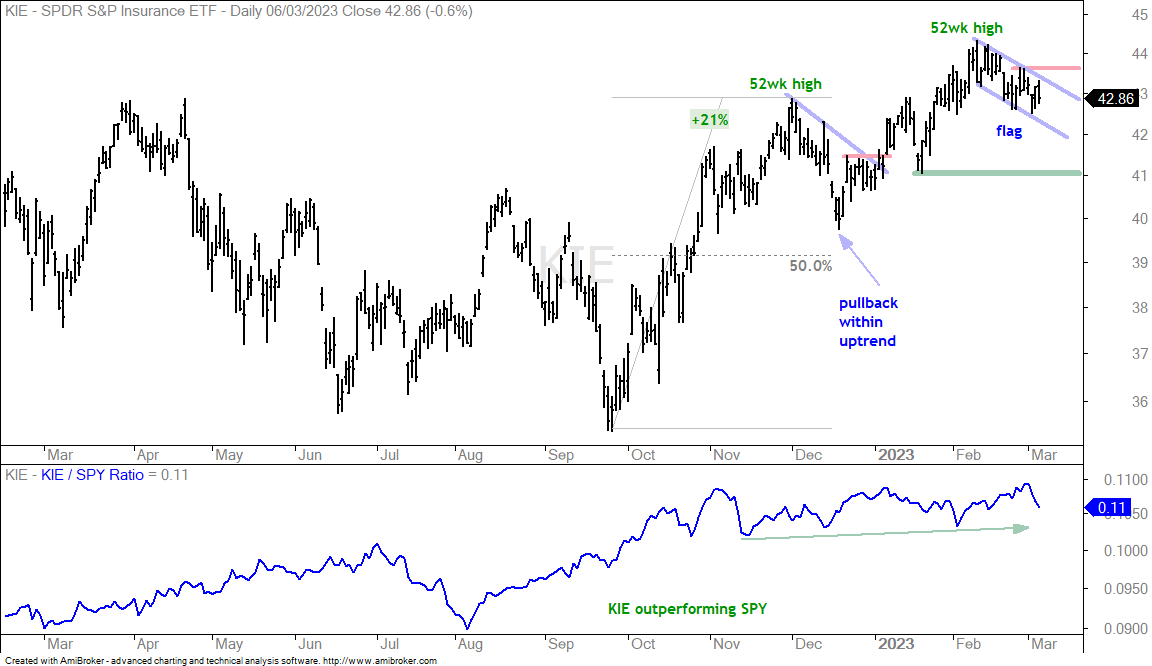
The next chart shows the Insurance ETF (KIE) hitting a new high in mid February and falling the last few weeks. This is a pullback within an uptrend and the pattern looks like a falling flag. A breakout at 43.6 would be bullish.
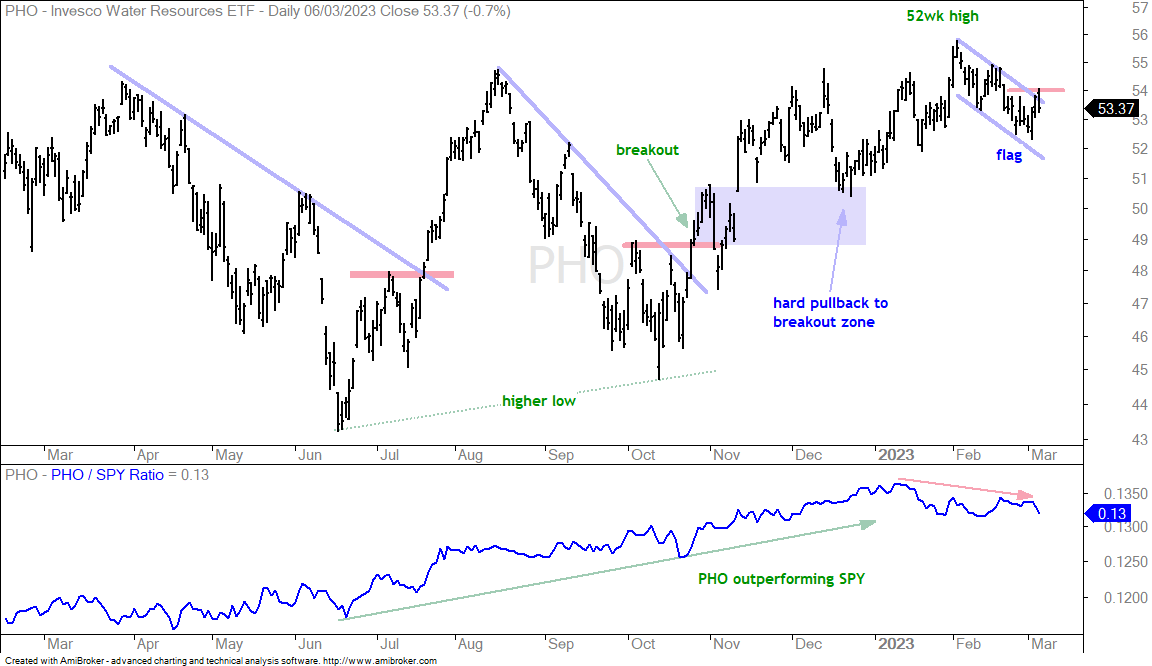
The next chart shows PHO with a new high in early February and a falling flag pullback into early March. A breakout at 54 would be bullish.
Platinum Breaks out as Copper and Base Metals Set Up
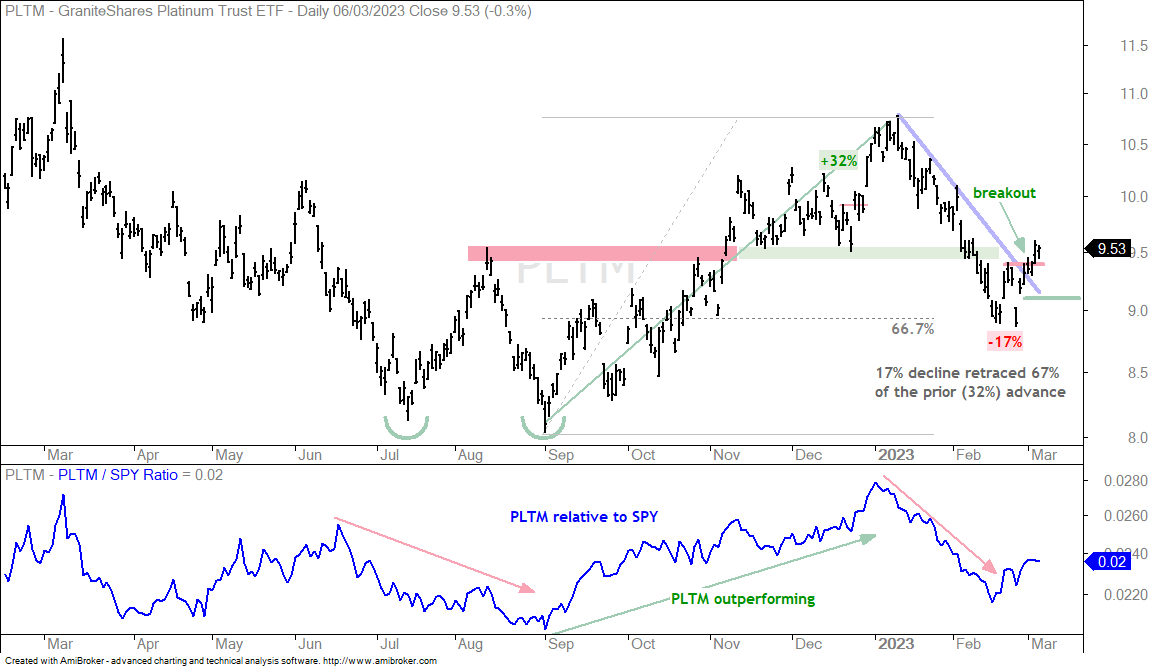
The Platinum ETF (PLTM) broke out after retracing 67% of the prior advance. The 17% decline was deep and broke the mid December low, but the retracement amount (67%) was normal and PLTM established a clear resistance level at 9.40. The ETF broke this level and the breakout is bullish until proven otherwise, which is the hard part. I am picking 9.10 as my re-evaluation level. A strong breakout should hold and a close below 9.10 would negate the breakout.
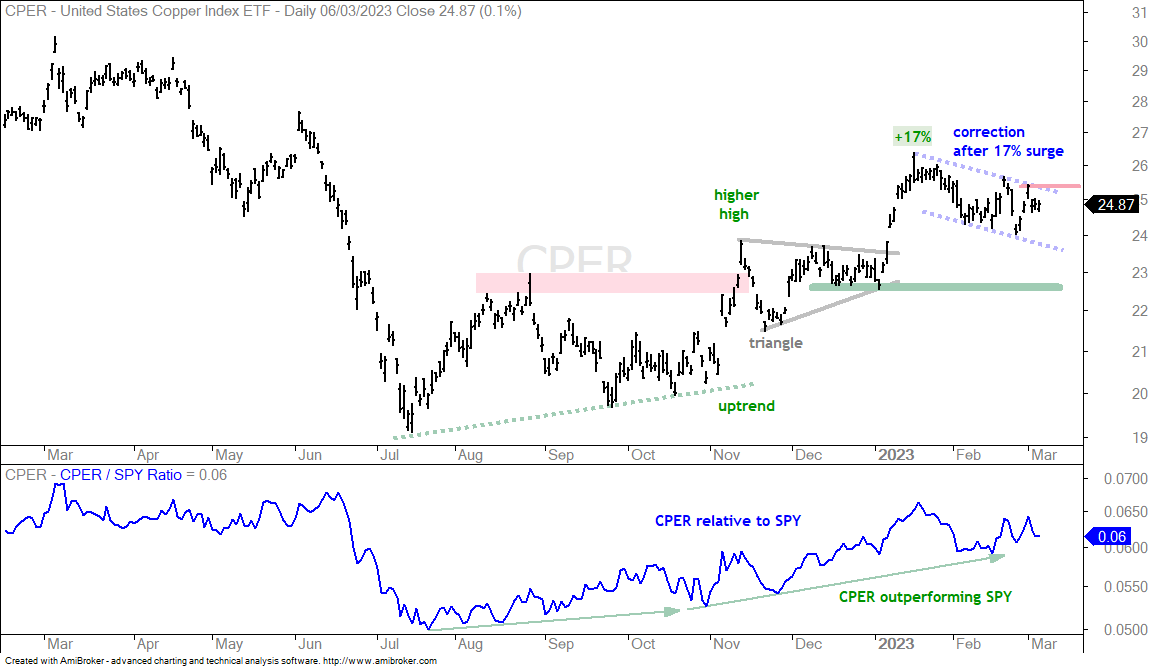
The next chart shows the Copper ETF (CPER) setting up with a correction after the 17% surge. The blue dashed lines define this correction and the immediate trend is down as long as CPER fails to break out. I am setting resistance at 25.5 and a breakout here would be bullish.
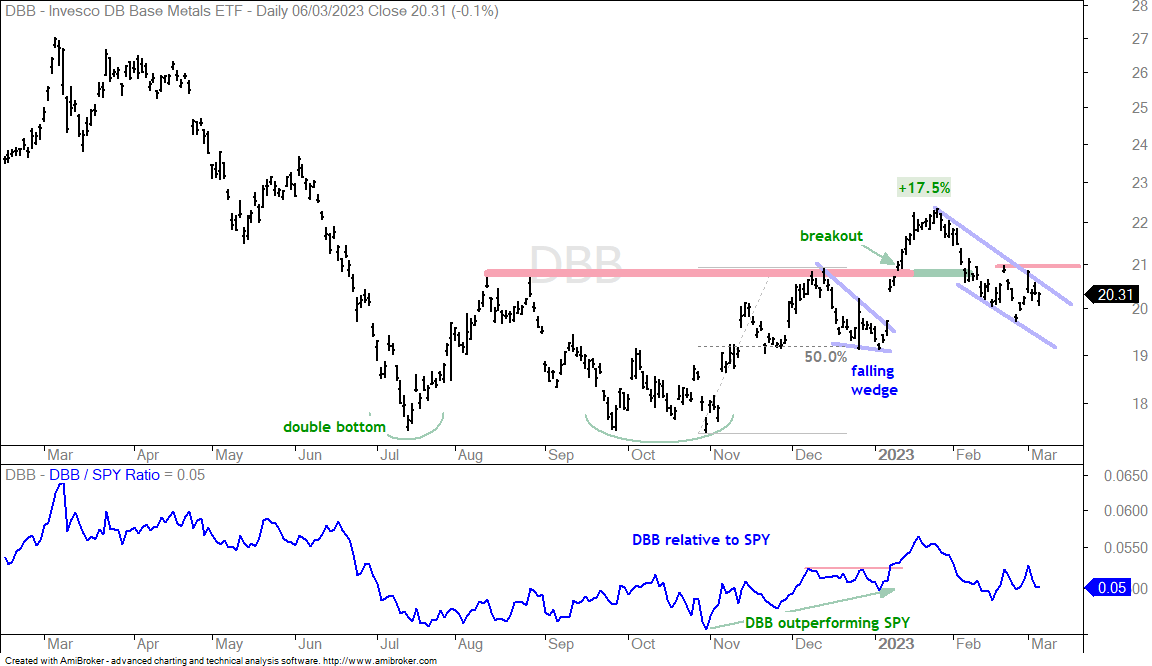
The DB Base Metals ETF (DBB) setup is similar to CPER. The immediate trend is down with resistance set at 21.
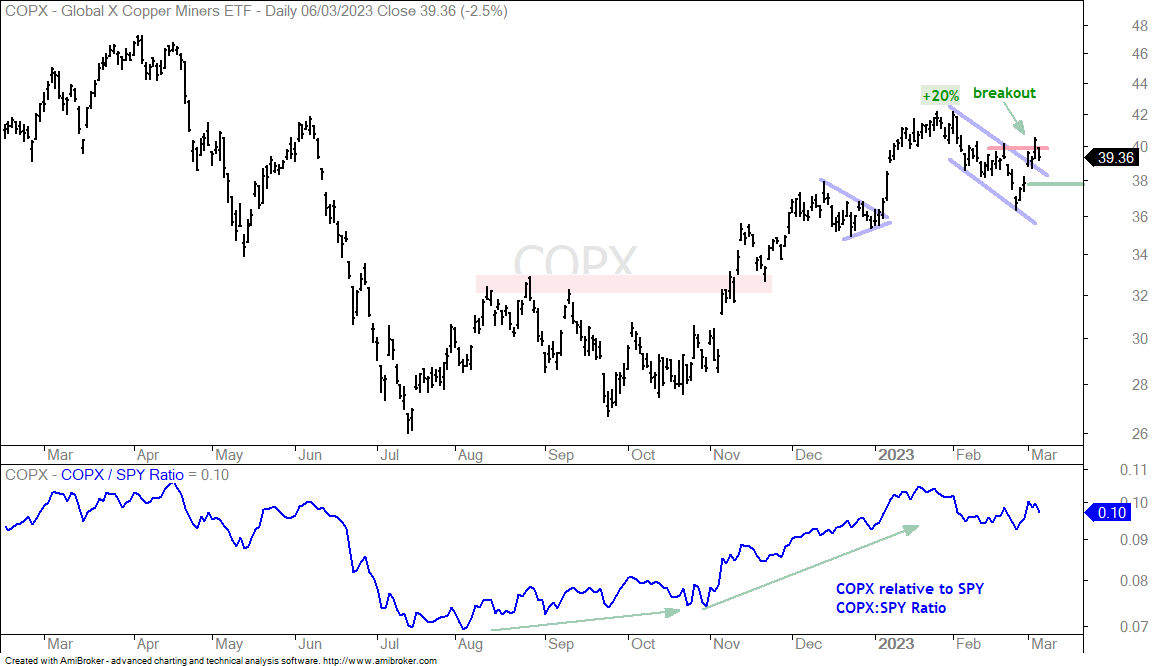
The next chart shows the Copper Miners ETF (COPX) taking the lead with a break above the mid February high. This move is enough to reverse the short-term downtrend. I would be careful with this breakout because CPER and DBB have yet to confirm and COPX has above average volatility (risk).