Using Trend Signals and Oversold Conditions to Get a Jump on the Breakout

Use CRTL+P to Print

Using Trend Signals and Oversold Conditions to Get a Jump on the Breakout

Use CRTL+P to Print

Welcome to the Chart Fix!

Looking to get a jump on a breakout? During long-term uptrends, short-term oversold conditions present opportunities to trade in the direction prevailing uptrend, which is the dominant force at work. Today we will show how to identify the long-term uptrend using the Trend Composite and find oversold setups using the Momentum Composite.

  • Transports ETF Extends Uptrend with Breakout
  • Using Oversold Conditions to Get a Discount
  • CSX Forms Bullish Continuation Pattern
  • Getting the Jump on the Breakout

Recent Reports and Videos at TrendInvestorPro

  • Selling Pressure Broadens – Copper Leads Commodities Lower
  • Breadth Deteriorates as Credit Markets Show Stress
  • Smalls and Mids Struggle as Yields Rise and Risk Aversion Increases

Next Week at TrendInvestorPro

  • Testing the 200-day Cross and TrendTrio Signals for the Major Indexes
  • Using Sentiment and Capitulation Indicators to Identify Extremes

Click here to take a trial and gain full access.

Transports ETF Extends Uptrend with Breakout

The Transports ETF (IYT) formed a bullish continuation pattern from July to November and broke out with a strong advance the last three weeks. As implied in the description, a bullish continuation pattern forms within an existing uptrend. IYT was clearly in an uptrend as the Trend Composite turned positive at the beginning of July (blue dashed line). Positive values mean the majority of indicators are bullish. The Trend Composite aggregates signals in five trend-following indicators and is part of the TrendInvestorPro Indicator Edge plugin for StockCharts ACP.
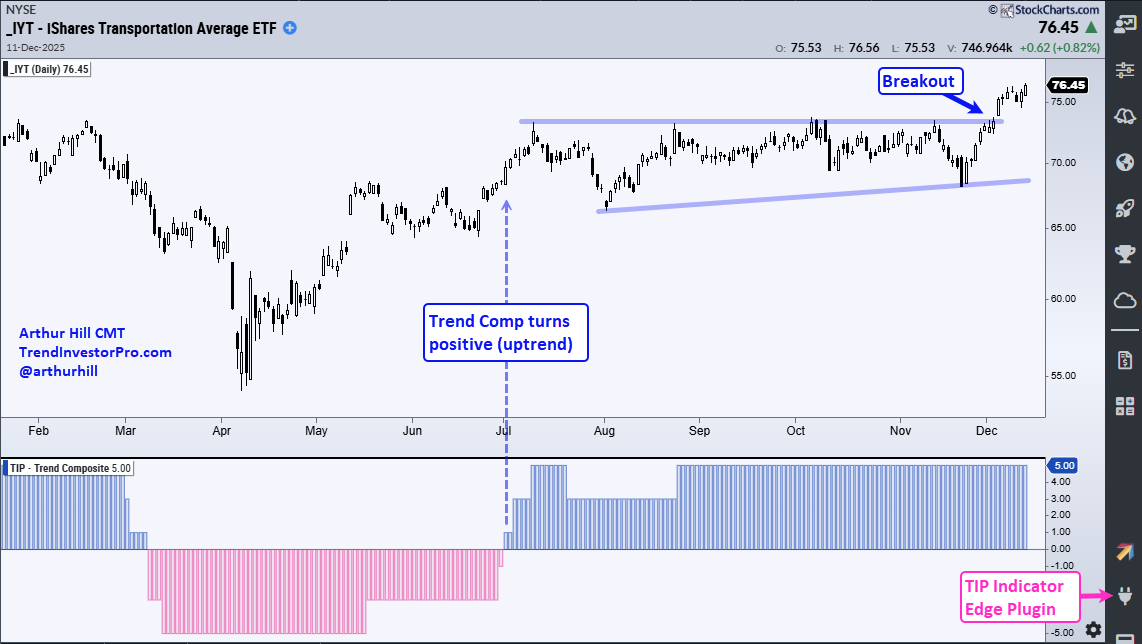
IYT extended higher into mid July and then moved into a trading range or consolidation pattern. A consolidation represents a rest within the uptrend. The blue lines show a higher low from July to November and equal highs (resistance) from July to November. Overall, the pattern is an Ascending Triangle, which is a classic bullish continuation pattern. The December breakout confirms the pattern and signals a resumption of the uptrend.

Looking for indicators with an edge? Check out the TIP Indicator-Edge Plugin for StockCharts ACP. Click here to learn more.

Using Oversold Conditions to Get a Discount

Once in an uptrend, chartists can look for oversold conditions to find optimal entry points within the uptrend. An oversold condition indicates that there was a pullback or consolidation within the uptrend. These conditions are not just for short-term traders. Trend-followers looking to accumulate within an uptrend can use oversold conditions to build a position.
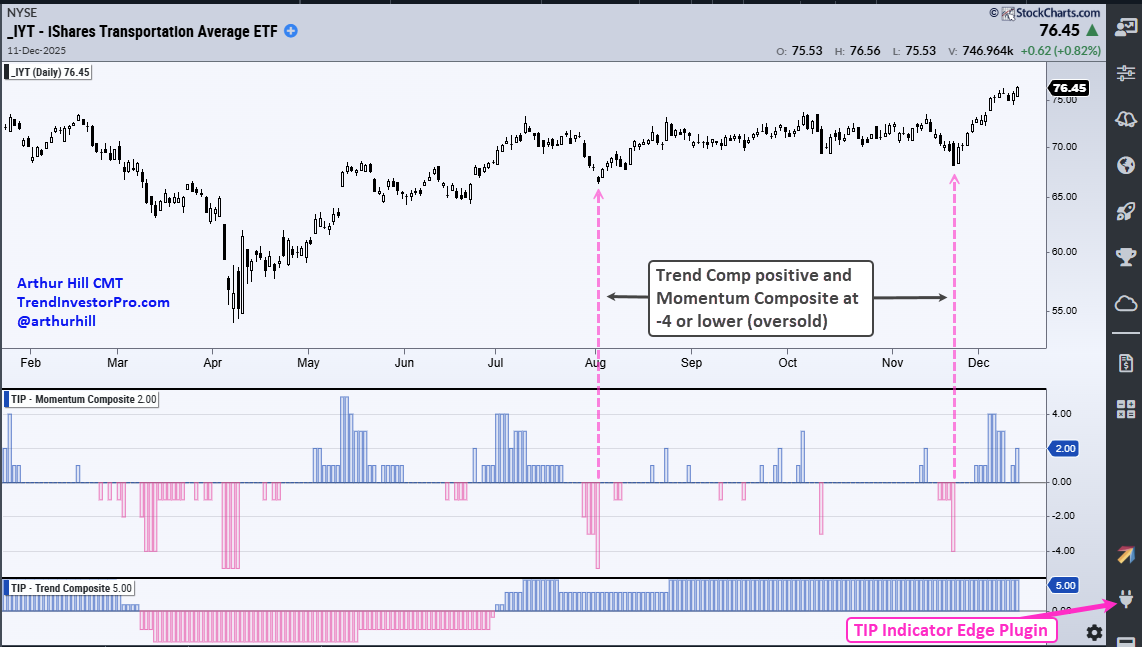
The chart above shows IYR with the Momentum Composite in the middle window. This indicator aggregates signals in five momentum oscillators. A value of -4 means four of the five indicators are oversold. The dashed pink lines show this indicator becoming oversold at the beginning of August and in late November. Price action looked ugly on the chart, but keep in mind that oversold conditions present opportunities because the long-term uptrend is the dominant force at work.

CSX Forms Bullish Continuation Pattern

CSX Corp (CSX) is a railroad stock and part of the Transports ETF. It is also in an uptrend with a bullish continuation pattern taking shape. CSX surged from April to mid August with the Trend Composite turning positive in late June. 

The stock hit resistance in August and consolidated into December. Again, this is a consolidation within an uptrend, which makes it a bullish continuation pattern. This time we have a classic cup-with-handle taking shape. A break above rim resistance would signal a continuation higher.

Getting the Jump on the Breakout

Chartists looking to get a jump on this breakout can look for oversold conditions and short-term bullish continuation patterns. This is what we specialize in at TrendInvestorPro. In fact, CSX was featured as it pulled back and became oversold. The chart below shows a falling channel retracing around 61.8% of the prior advance. Both the pattern and the retracement amount are typical for corrections. CSX broke out in late November and extended higher into December.
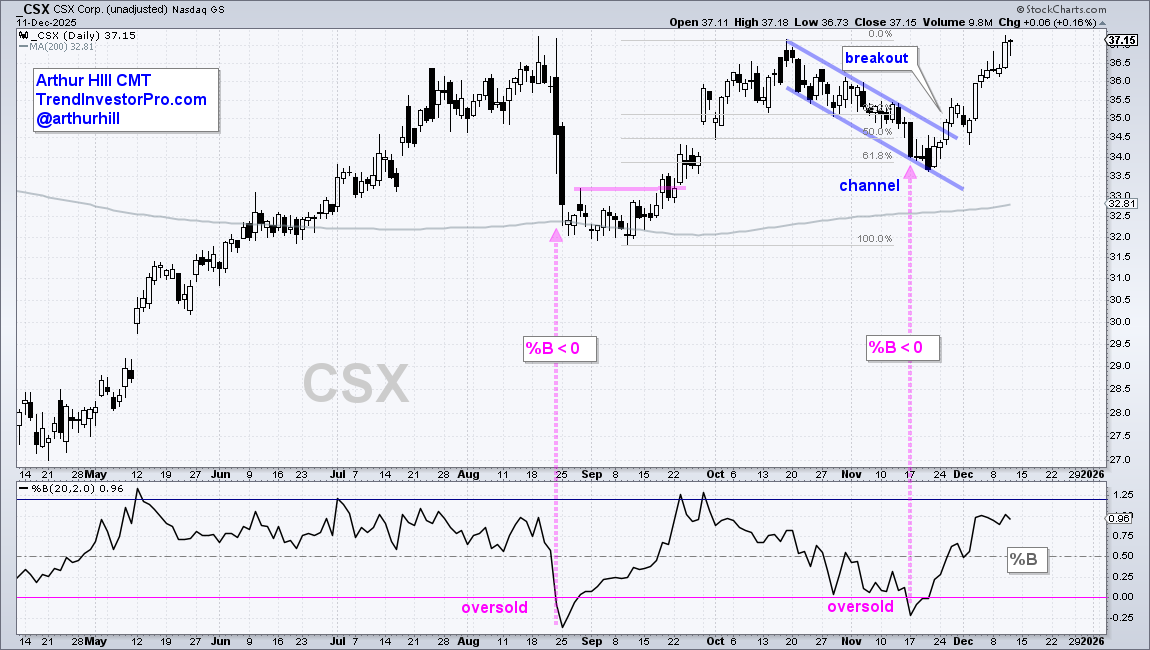
The indicator window shows %B (20,2), which is one of the five indicators in the Momentum Composite. Oversold conditions are present when %B dips below zero, which means the close was below the lower Bollinger Band (20,2). Oversold conditions serve as alerts to focus on price action for a tradable setup and signal, which we got with CSX.  

Recent Reports and Videos at TrendInvestorPro

  • Selling Pressure Broadens – Copper Leads Commodities Lower
  • Breadth Deteriorates as Credit Markets Show Stress
  • Smalls and Mids Struggle as Yields Rise and Risk Aversion Increases

Next Week at TrendInvestorPro

  • Testing the 200-day Cross and TrendTrio Signals for the Major Indexes
  • Using Sentiment and Capitulation Indicators to Identify Extremes

Click here to take a trial and gain full access.

Breadth not Ideal, but Net Bullish – Homebuilder Breakout could Bode well for 2026

Market breadth is not very strong, but it is strong enough to support a bull market. At the very least, key breadth metrics are not net bearish. Today’s Chart Fix shows how to quantify signals using new highs, new lows and the percentage of stocks with golden crosses. We then dissect the breakout in the Homebuilders ETF, which could hold the key to broadening leadership in 2026.

Breadth not Ideal, but Net Bullish – Homebuilder Breakout could Bode well for 2026 Read More »

3-step Process to Increase your Success Rate – Trend, Relative Performance and Chart Setup

Successful entries are rarely accidents. The best trades come from a repeatable process that starts with long term trend identification, a relative performance assessment and a robust chart setup. Use this three-step framework to filter names, focus on leaders, and time entries with favorable reward to risk ratios.

3-step Process to Increase your Success Rate – Trend, Relative Performance and Chart Setup Read More »

Discretionary Lags – Speculative Names Thrown Out – Trend Signals within MAG7 & Utilities

The stock market moved from offense to defense over the last few weeks. Speculative tech names led the market into October, but defensive names took over in November. Healthcare, consumer staples and gold are holding strong, while the ARK Innovation ETF breaks support and Microsoft

Discretionary Lags – Speculative Names Thrown Out – Trend Signals within MAG7 & Utilities Read More »

Defensive Sector Stands Strong as Economically Sensitive Sector Breaks Down

Stock market performance remains mixed with a high percentage of S&P 500 stocks trading below their 200-day SMAs. This number has yet to exceed 50%, but should be watched because the Consumer Discretionary and Technology sectors show deterioration. Despite a mixed market, the Healthcare sector is rising above the

Defensive Sector Stands Strong as Economically Sensitive Sector Breaks Down Read More »

QQQ Channels Higher – 5 Healthcare Leaders – Case Study on Trading Pullbacks (ARTY-MSFT)

Welcome to the Friday Chart Fix! Today’s report starts with the leading uptrend in QQQ. Large-caps tech stocks may seem ripe for a correction, but there are no signs of weakness on the price chart. Even though QQQ and the MAG7 are leading, there is strength in other areas with five healthcare stocks outperforming six of the MAG7. This report concludes with

QQQ Channels Higher – 5 Healthcare Leaders – Case Study on Trading Pullbacks (ARTY-MSFT) Read More »

Trend Signals in Healthcare and Healthcare Stocks – 5 New Signals and 12 Leading Uptrends

Welcome to the Friday Chart Fix! Today’s report focuses on the Healthcare sector, which sprang to life this week as the Trend Composite turned positive. This signal, however, was not the first bullish signal. Healthcare showed signs of capitulation at the end of July, there was a double bottom breakout in late August and a bull flag

Trend Signals in Healthcare and Healthcare Stocks – 5 New Signals and 12 Leading Uptrends Read More »

102 Days above 50-day – New Lows – Tech Power – Commodity Bulls – Oil Gets Interesting

SPY reached a milestone this week as it held above its 50-day SMA for more than 100 days, which was the seventh such occurrence since 2000. Even though SPY is 2.2% above its 50-day, only half of its components are above their 50-day SMAs and new lows are expanding. However, a correction in SPY could remain elusive until tech stocks and the MAG7 buckle. Elsewhere, it is a bull market in commodities and even energy is starting turn up.

102 Days above 50-day – New Lows – Tech Power – Commodity Bulls – Oil Gets Interesting Read More »

TLT Still Lagging, Best Hunting Grounds, IWM Starts Leading, Healthcare and Biogen

Welcome to the Friday Chart Fix! Bonds are surging, but not outperforming stocks, which is positive for stocks. Mid-caps show the most internal strength, but the Russell 2000 ETF is outperforming the S&P MidCap 400 SPDR. Healthcare breadth improved with a key indicator crossing the 50% threshold and XLV broke its

TLT Still Lagging, Best Hunting Grounds, IWM Starts Leading, Healthcare and Biogen Read More »

New Highs vs Lows, XLC Goes Beast Mode – Risk is On – Dissecting Gold – A Cyber Setup

Welcome to the Friday Chart Fix! Today’s report starts with a bullish breadth indicator and the level to watch going forward. We then turn to the strongest sector: Communication Services. It has been on fire since May and continues to lead. Overall, stocks are in good shape because the EW Technology sector is trading above resistance

New Highs vs Lows, XLC Goes Beast Mode – Risk is On – Dissecting Gold – A Cyber Setup Read More »

Uptrends Expand, Tech Consolidates, Cybersecurity Breaks Out, A Classic Trading Setup – Big Banks Lead

Welcome to the Friday Chart Fix. Today’s report starts with the percentage of stocks above their 200-day SMAs, which hit a multi-month high as uptrends expand. The Technology SPDR is above its 200-day, but consolidating the last four weeks as it digests big gains. Within tech, the Cybersecurity ETF broke out after a pullback and a top component

Uptrends Expand, Tech Consolidates, Cybersecurity Breaks Out, A Classic Trading Setup – Big Banks Lead Read More »

Three Big Negatives Overshadow the Uptrends in SPY and QQQ

SPY and QQQ remain in long-term uptrends, but three big negatives are hanging over the stock market right now. Two negatives are tied to important cyclical groups and the third is reminiscent of summer 2022. This report will analyze the recent breakdown in housing, continued weakness in semiconductors and the big breakout in the 10-yr Treasury Yield.

Three Big Negatives Overshadow the Uptrends in SPY and QQQ Read More »

Drop in Yields Triggers Gap-Surge in Home Builders (Free)

The 10-yr Treasury Yield plunged as Treasury bonds surged on the heels of a new nomination for Treasury secretary. These moves lifted small-caps, banks and homebuilders. Banks have been leading for some time and small-caps started their move last week. Homebuilders held out for interest rates and got their catalyst on Monday. Today’s report will analyze

Drop in Yields Triggers Gap-Surge in Home Builders (Free) Read More »

Four Prerequisites to Improve Your Odds – A Live Example (Free)

Even though trading based on chart analysis involves some discretionary decisions, chartists can improve the odds of success by systematizing their process. This report will show four prerequisite filters based on a top-down approach. We will start with the broader market, look at the sector, and then apply two qualifying filters to the stock. First, I would make sure

Four Prerequisites to Improve Your Odds – A Live Example (Free) Read More »

Scroll to Top