
")

Bearish Reversal for QQEW – New Highs Surge as Low Vol Leads – Strength in EW Sectors
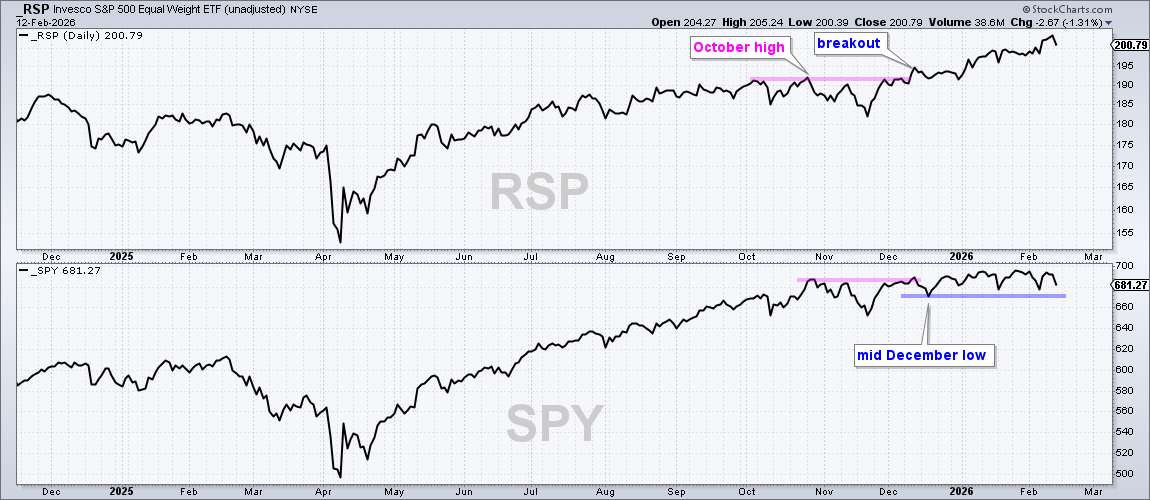
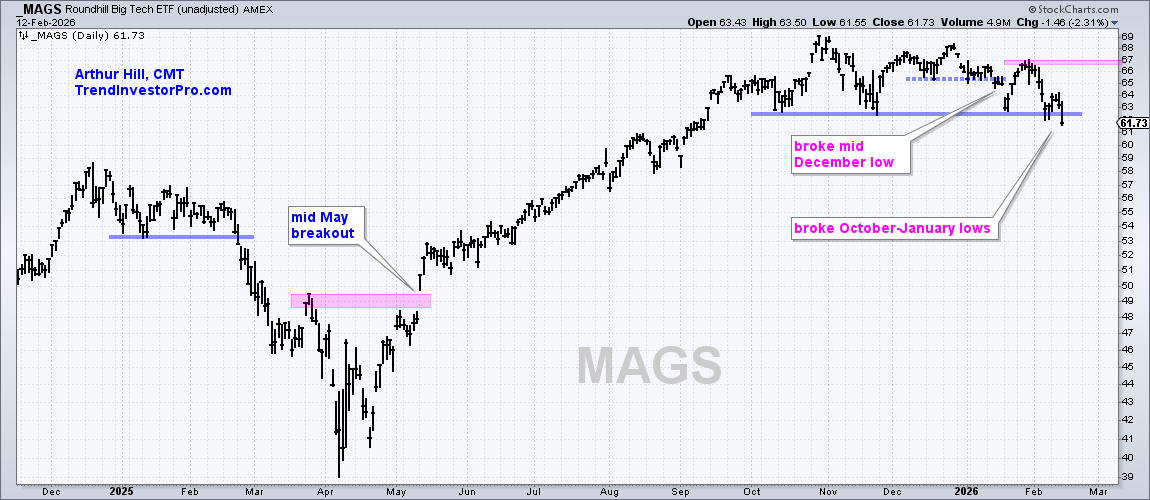
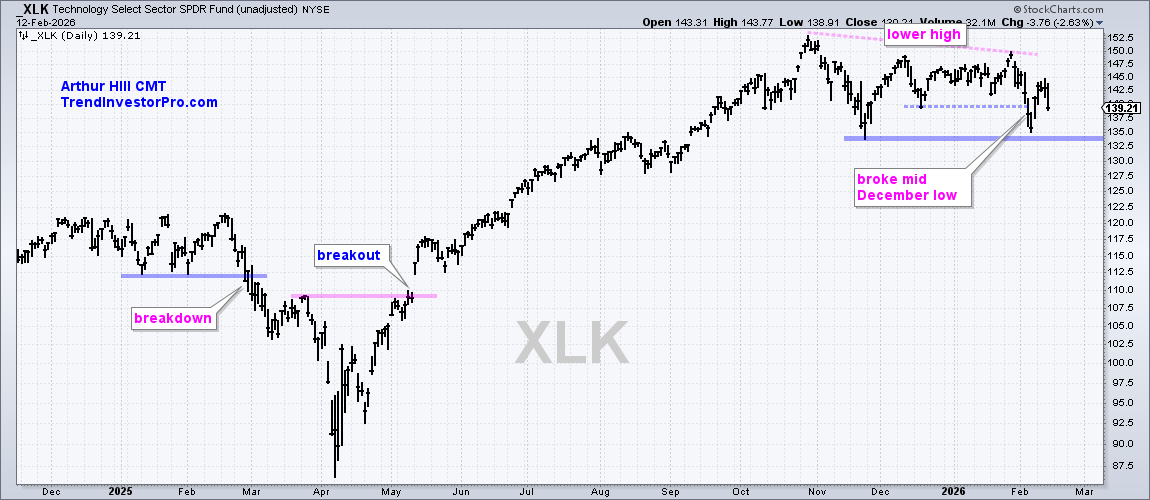
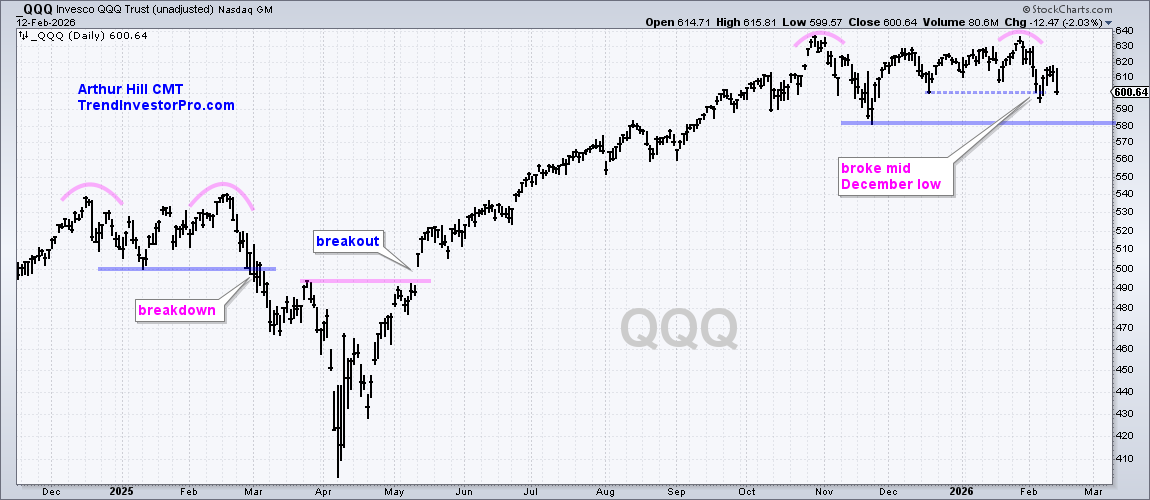
Money is moving out of Nasdaq 100 stocks and into more mundane parts of the stock market. It is not just a few large-caps in QQQ. We are seeing weakness throughout as the Nasdaq 100 Equal-Weight ETF (QQEW) formed and confirmed
Bearish Reversal for QQEW – New Highs Surge as Low Vol Leads – Strength in EW Sectors Read More »