Complimentary
Market Pullbacks Provide Opportunities to Build your WatchList – Here’s How
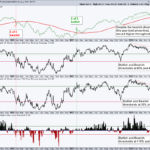
The stock market is in pullback mode with the S&P 500 EW ETF down 5.15% over the past month and down 1% year-to-date. This makes it a good time to monitor relative performance and create a relative strength watch list. Stocks and ETFs holding up best during pullbacks often lead when the market regains its footing. Today’s report will show a starter list and analyze the chart for an AI Robotics ETF.