The next Chart Trader will be posted on Thursday morning, January 25th.
Broad Market Recap
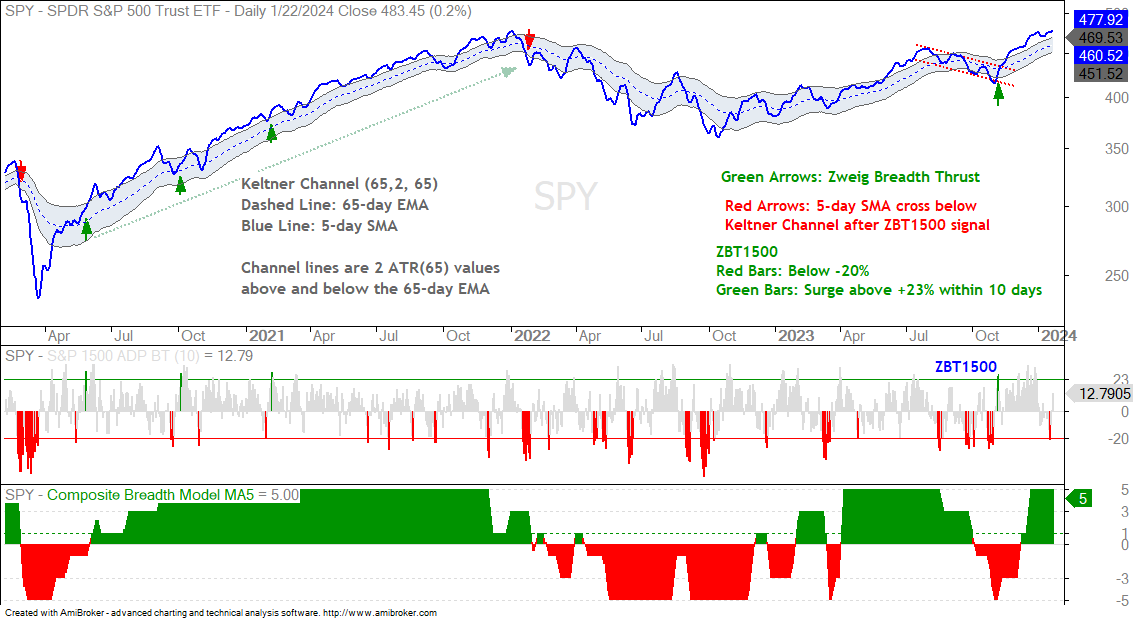
The broad market environment remains bullish, which means we are in a bull market. There can still be corrections and pullbacks along the way. Corrections and pullbacks, however, create opportunities when the weight of the evidence remains bullish. One pullback or correction will be deep enough to signal a bear market. I will cross that bridge when the time is appropriate.
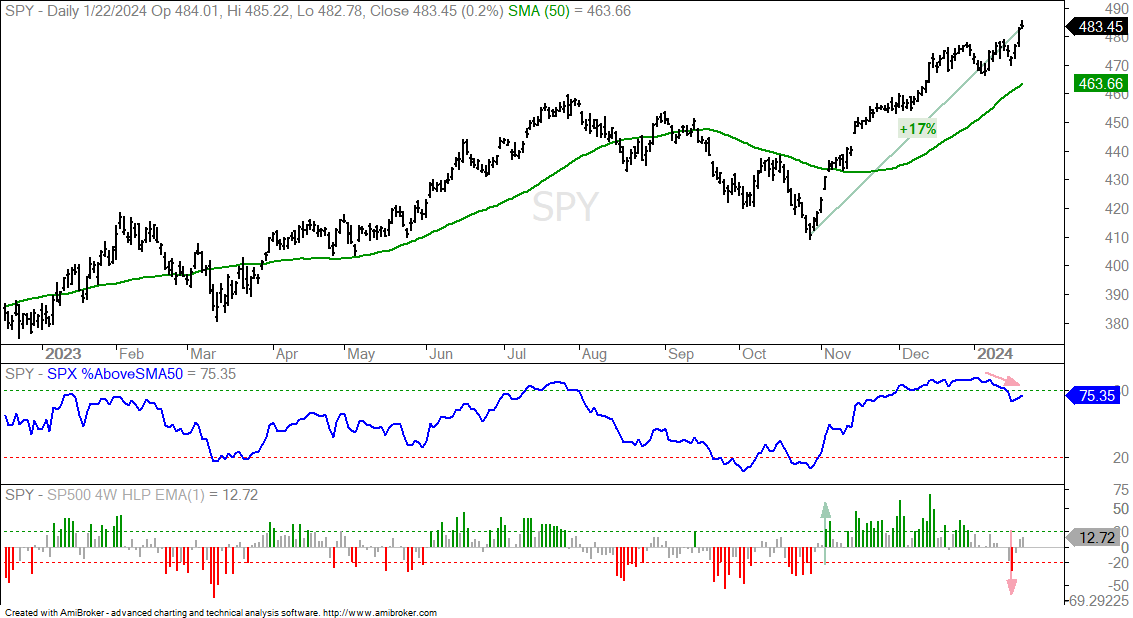
The weight of the evidence remains bullish for stocks, but SPY and QQQ are very extended after big advances since late October. SPY is up 17% since late October and up 2.31% the last three days. This is the sharpest 3-day advance since November 14th. Corrections and pullbacks do occur in bull markets. Pullbacks are actually healthy and lead to trading setups.
I am seeing short-term deterioration in breadth within the S&P 500. The first indicator window shows SPX %Above 50-day SMA hovering above 80% from late November to early January and moving below 80% last week (red arrow). SPY surged to a new high and yet fewer stocks are above their 50-day SMAs. This means fewer stocks participated in the advance over the past week or so.
The lowest window shows 4-week High-Low Percent for the S&P 500. This is the percentage of stocks making 4-week highs less the percentage making 4-week lows. In general, a move above 20% is short-term bullish, and a move below -20% is short-term bearish. This indicator moved above +20% on November 2nd (green arrow) and below -20% on January 17th (red arrow). This shows an expansion in the number of stocks recording 4-week lows. The indicator recovered somewhat the last two days, but needs to get back above 20% to be significant.
Seasonal Pattern for S&P 500
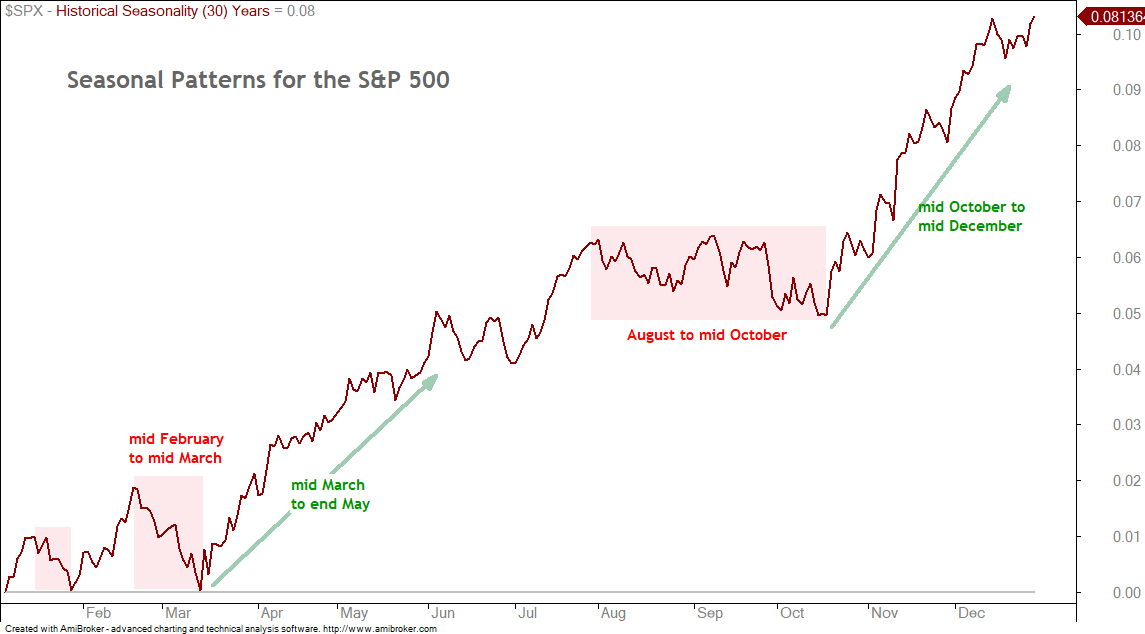
Even though timing a correction within a strong uptrend is difficult, the seasonal pattern for the S&P 500 argues for a correction sometime between now and mid March. Two negative periods stand out: mid February to mid March and August to mid October (red shading). Seasonally speaking, February is one of the weakest months.
SPY with the Sharpest Advance since 2021
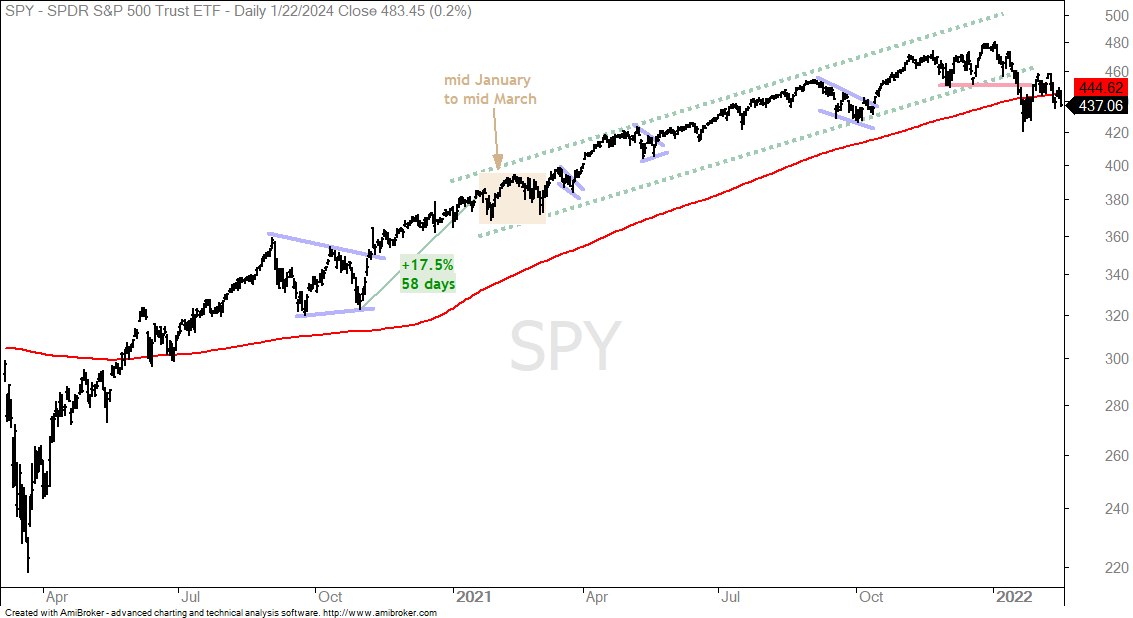
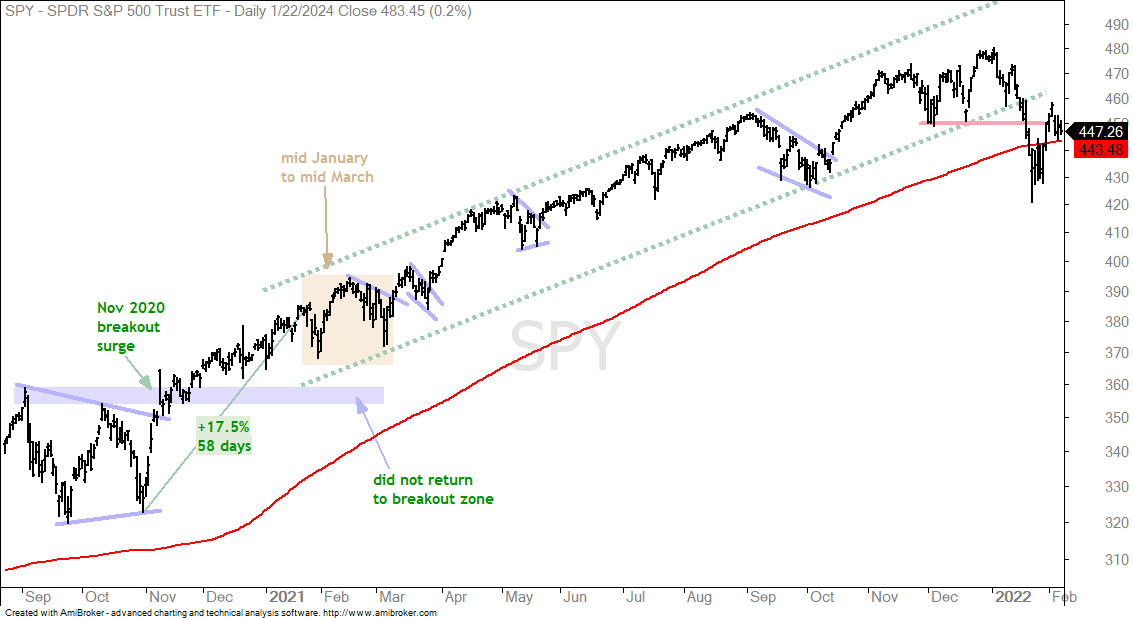
The current 17.19% advance in 58 trading days is the steepest 58 day surge since January 2021. The chart below shows this surge triggering a triangle breakout in early November 2020. SPY was “overbought” in early November 2020, but continued higher into January 2022. The green dashed lines define this extended advance. There were healthy and normal pullbacks along the way, but the trend did not reverse until a clear breakdown in January.
The next chart focuses on the uptrend after the 17.5% surge. First, notice the breakout surge in November 2020. SPY did not return to this breakout zone (blue shading) because the pullbacks were relatively shallow. The yellow shading highlights the period from mid January to mid March. There were pullbacks in late January and again from mid February to early March. Overall, the period from January to mid March was choppy. The blue lines highlight some tradable pullbacks within this advance.
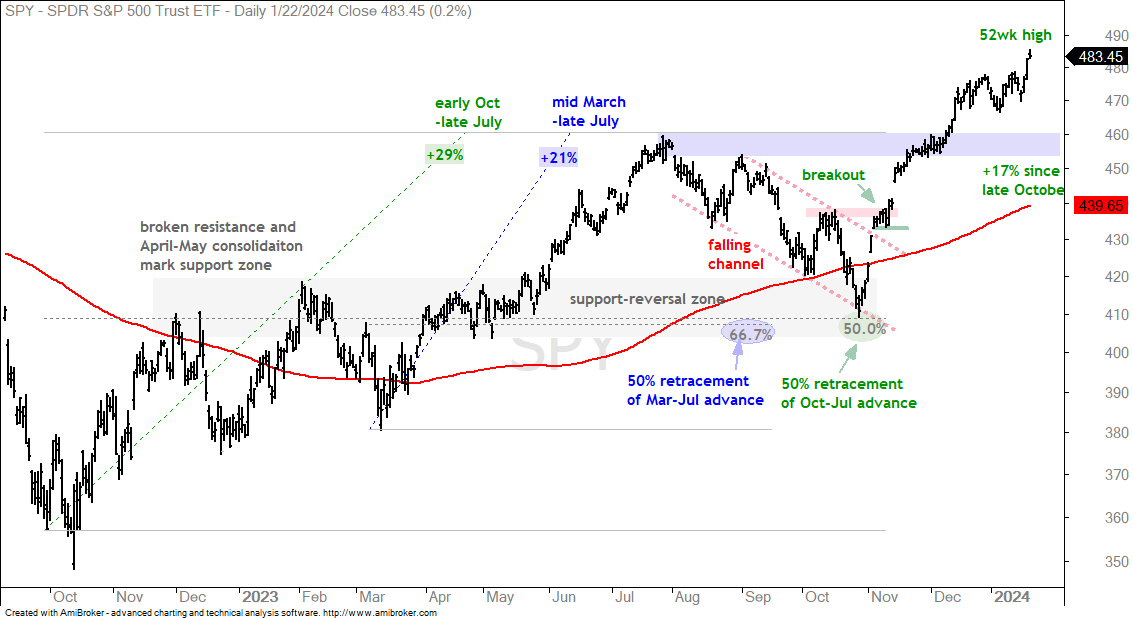
The next chart shows the current 17.19% surge and new high. The long-term and short-term trends are up. As with November 2020, there is a big thrust breakout and follow through to new highs. As with January 2021, SPY is quite overbought and we are entering a period of seasonal weakness, which could lead to choppy trading. The breakout zone around 455-460 turns first support (blue shading). We could, however, see a shallower pullback that does not make it this far.
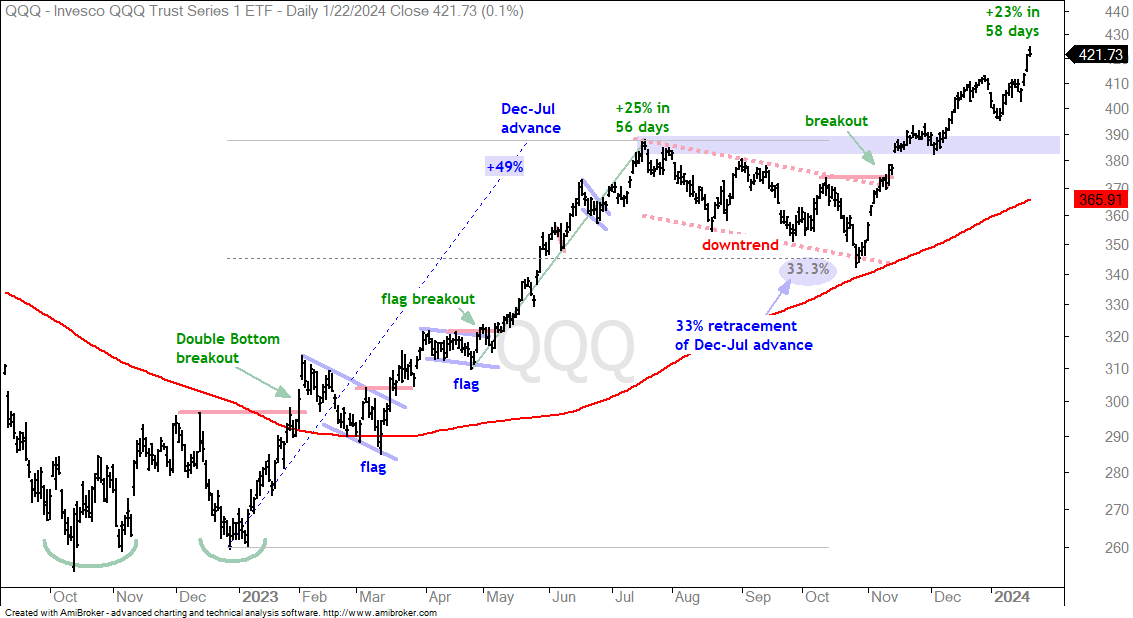
The next chart shows QQQ with a 23% advance the last 58 days. This is the sharpest 58 day surge since July 19th (2023), when QQQ was up 25% in 56 days. Notice that QQQ peaked in the second half of July. QQQ is currently overextended and ripe for a corrective period. Broken resistance turns into support in the 380-390 area.
Large-caps and Techs Lead the Way
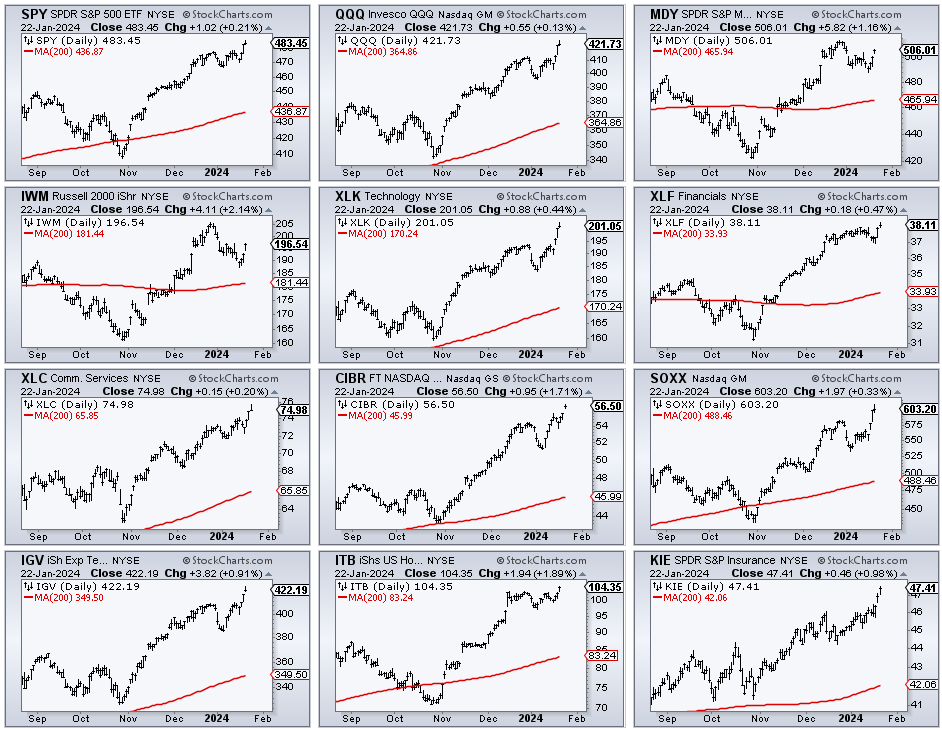
Large-caps are still leading as SPY and QQQ hit new highs on Monday. Small-caps (IWM) and mid-caps (MDY) are lagging, but both surged over the last three days. The Technology SPDR (XLK), Finance SPDR (XLF) and Communication Services SPDR (XLC) are the leading sectors with new highs over the last few days. Elsewhere, a number of tech-related ETFs hit new highs recently (SKYY, CIBR, FDN, SOXX, IGV). We also saw new highs in the Home Construction ETF (ITB) and the Insurance ETF (KIE).
Chart Analysis, Setups and Trading Ideas
Walgreens-Boots Hits Support-Reversal Zone
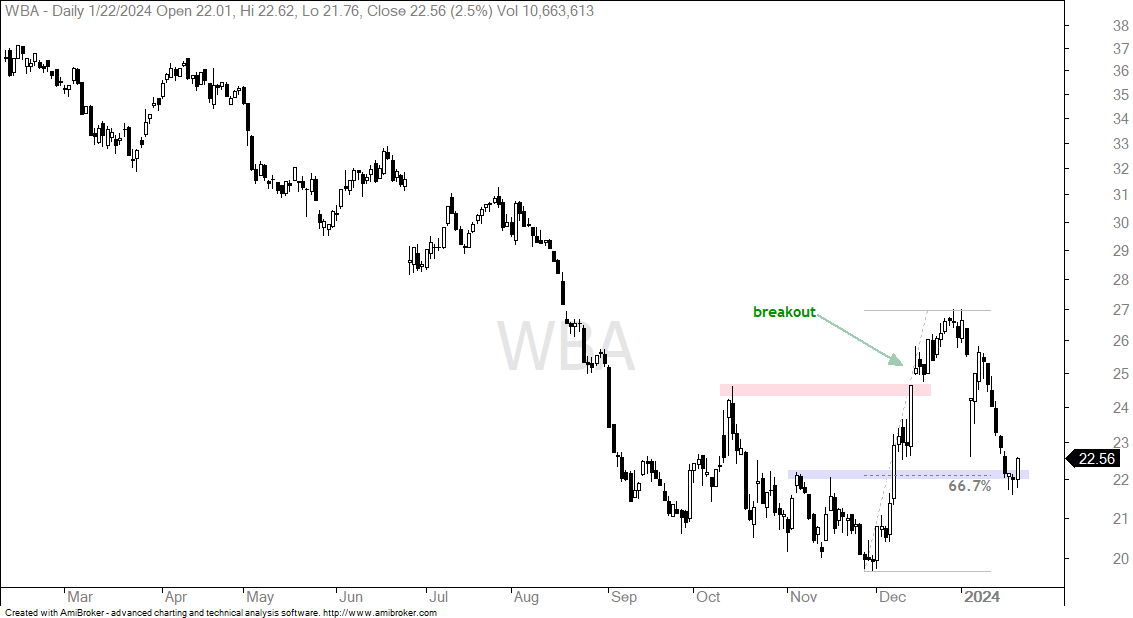
WBA is a turnaround story because the company has a new CEO, who used to head up Express Scripts. I have no opinion on the company fundamentals or the new strategy, but WBA has been a great disappointment since 2015. WBA traded in the upper 90s in 2015 and fell to 20 in late November 2023. The stock surged in December with a move to 27 and broke above the October high in the process. It then fell back rather sharply, but this decline found support near the November highs and the 67% retracement. This is a Support-Reversal Zone. WBA fell sharply on Wednesday, formed two hammer-type candlesticks on Thursday-Friday and surged on Monday. This amounts to a four candlestick reversal at the Support-Reversal Zone. This is the first bullish signal and a close below last week’s low would call for a re-evaluation. WBA reported earnings on January 4th.
Disney Gets Breakout and Follow Through
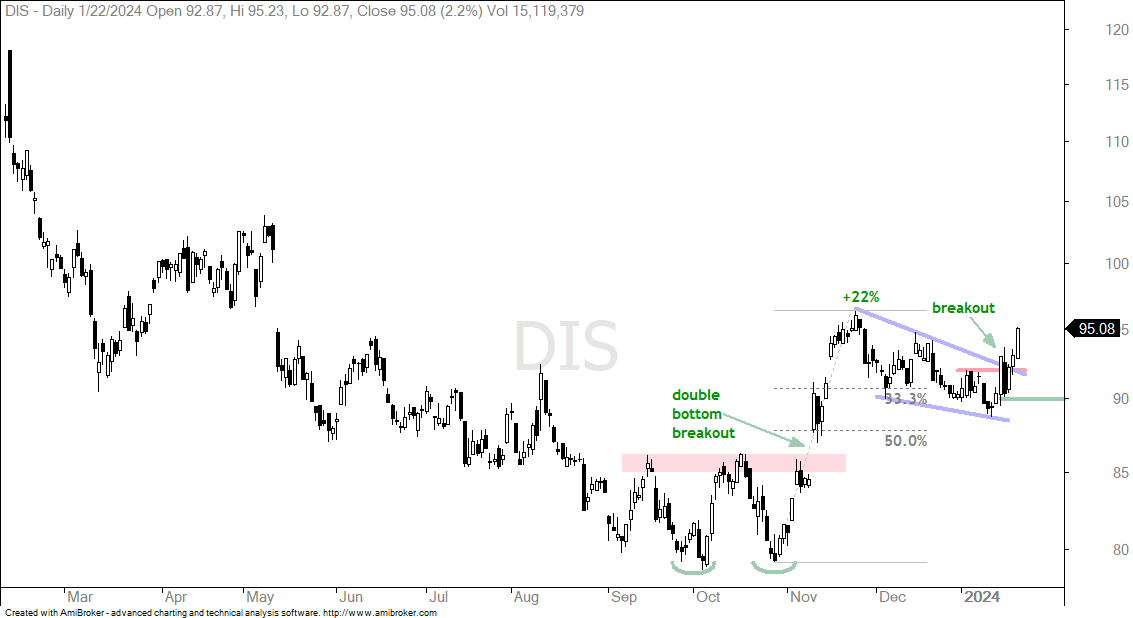
DIS sprang to life over the last six days with a falling wedge breakout and follow through. Overall, DIS formed a Double Bottom in October and broke out with a 22% surge into late November. The stock then retraced 33-50 percent of this advance with a decline to the upper 80s. Notice that this decline also formed a falling wedge, which is typical for corrections after sharp advances. DIS broke out of this wedge with a surge on January 16th, but immediately fell back with a long black candlestick. It looked like the breakout might fail, but the bulls returned the next day and DIS advanced three straight days. This is the follow through to the breakout. The low of the long black candlestick now marks re-evaluation support at 90. A close below this level would negate the breakout. DIS reports earnings on February 7th. Also note that DIS is in the middle of a proxy fight with two activist shareholders, which could increase volatility.
Henry Schein Forms Bull Flag
HSIC is part of the Healthcare SPDR (XLV), which is one of the strongest sectors over the last two months (+9.46%). The stock surged with the market in November, fell back into early December and surged again into yearend. After a 17% advance in December, the stock corrected with a falling flag into January. I view this as a short correction and a bullish continuation pattern. A breakout at 75 would reverse this flag and open the door to the mid 80s. Upon a breakout, I would set my initial re-evaluation at 72, which is last week’s low. HSIC reports earnings on February 14th.
Managing a Trade with MSI and AMAT
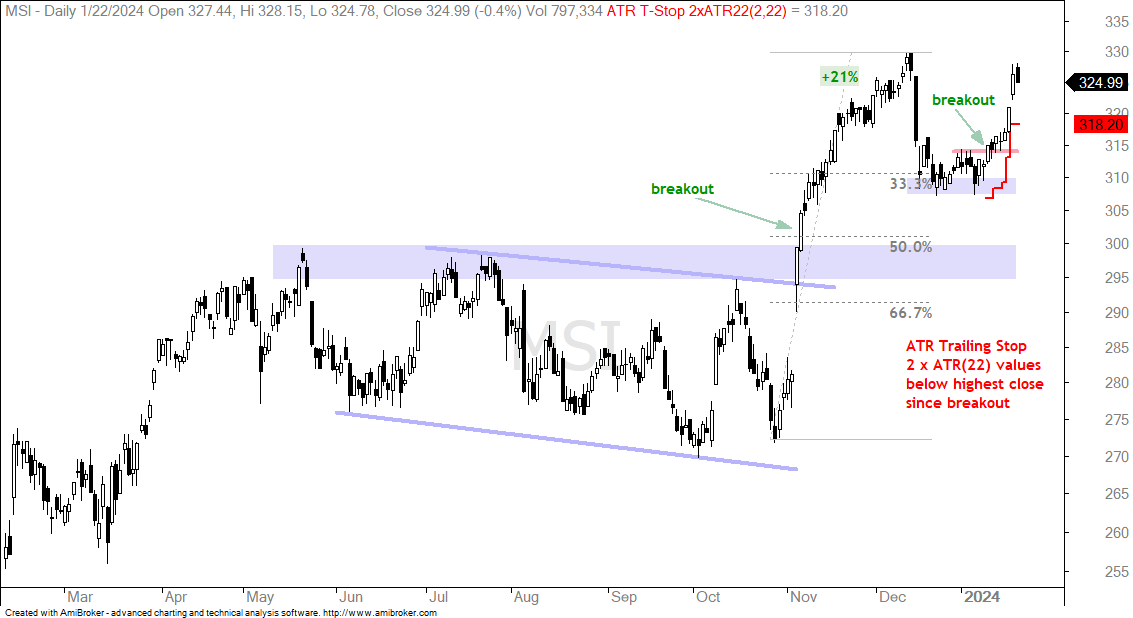
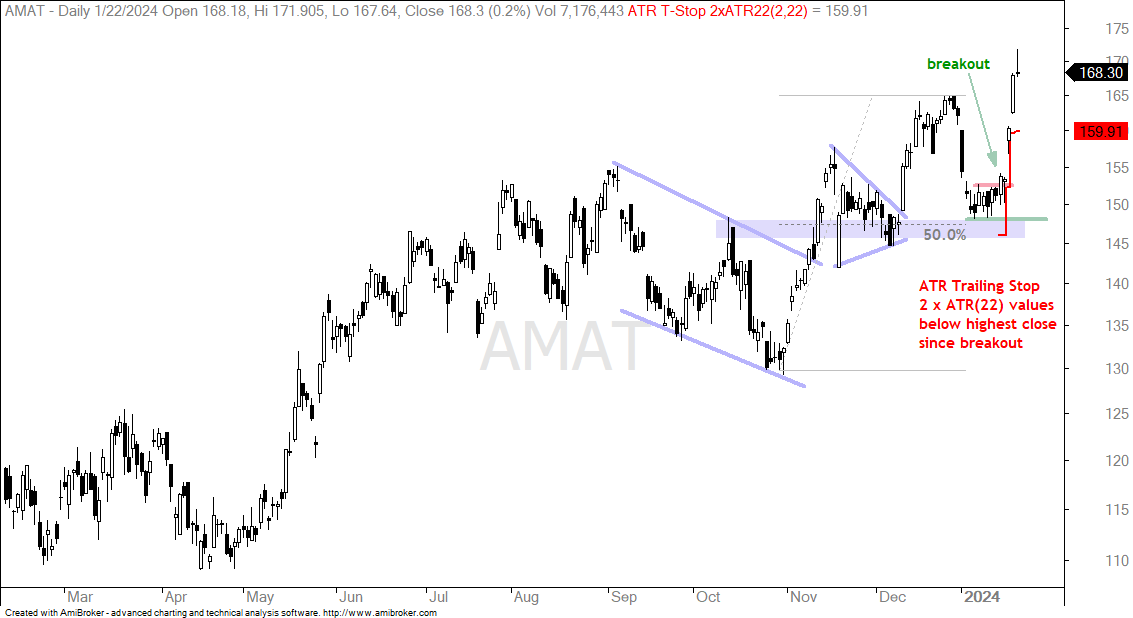
Motorola Solutions (MSI) and Applied Materials (AMAT) were featured with bullish setups on January 9th and 11th, respectively. Both were firming in Support-Reversal Zones and both broke short-term resistance. These two tech stocks surged with the rest of the sector last week. Now it is time to manage the trade and follow a plan. With short-term swing trading, I like to take money off the table after a sharp move. MSI is up around 3.5% since the breakout and AMAT is up over 9%. Traders can consider closing half of the position and then setting a trailing stop for the remainder.
The chart below shows MSI with the ATR Trailing Stop (red line). This stop is 2 ATR(22) values below the highest close since the breakout. I chose 2 for the multiplier because this value means the stop starts just below the January low. It trails higher when price extends after the breakout, which was on January 10th.
The next chart shows AMAT with the ATR Trailing Stop, which is also 2 ATR(22) values below the highest close since the breakout. The initial stop on the breakout day was was at 146, which is just below the January low. AMAT surged after this breakout and the current stop is at 159.91. The ATR Trailing Stop is also part of the TIP Indicator Edge Plugin for StockCharts ACP.