-Current Analysis
Equity ETF Report – Bear Market Bounce – 11 with Leading Uptrends and Bullish Charts
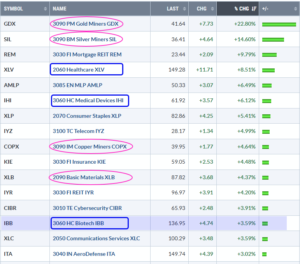
Stocks are in the midst of an oversold bounce, but the weight of the evidence remains bearish for the stock market. This means the pickings are slim when it comes to equity ETFs. Today’s report focuses on equity ETFs that